Download presentation
Presentation is loading. Please wait.

1
Accelerating the rise of solar energy
Geoffrey S. Kinsey, PhD Zuva Energy Consulting Boston, Massachusetts, USA June 20, 2014

2
My background

3
Demand =11.2 TWh 1 quad=293 billion kWh

4
Kilowatt-hours to gallons-of-gas equivalent
33 kilowatt-hours [kWh] 1 gallon A Tesla Model S can go 90 miles on 33 kW-h

5
Some gasoline equivalents
33 kW-hr of energy is in one gallon of gasoline: Driving 300 miles, 25 mpg: Driving 300 miles, electric car: Flying from New York to Los Angeles: Leaving a 40-W cable box on 24/7, per year: Energy to get water to LA, per capita, per year: Clothes dryer, per year 42” Plasma TV, 2 hours per day, per year: 42” LED TV, 2 hours per day, per year: 1 12 3 50 10 14 30 7 2

6
Energy efficiency

7
Which is most expensive?
…It depends…

8
The externalities…

9
The externalities…

10
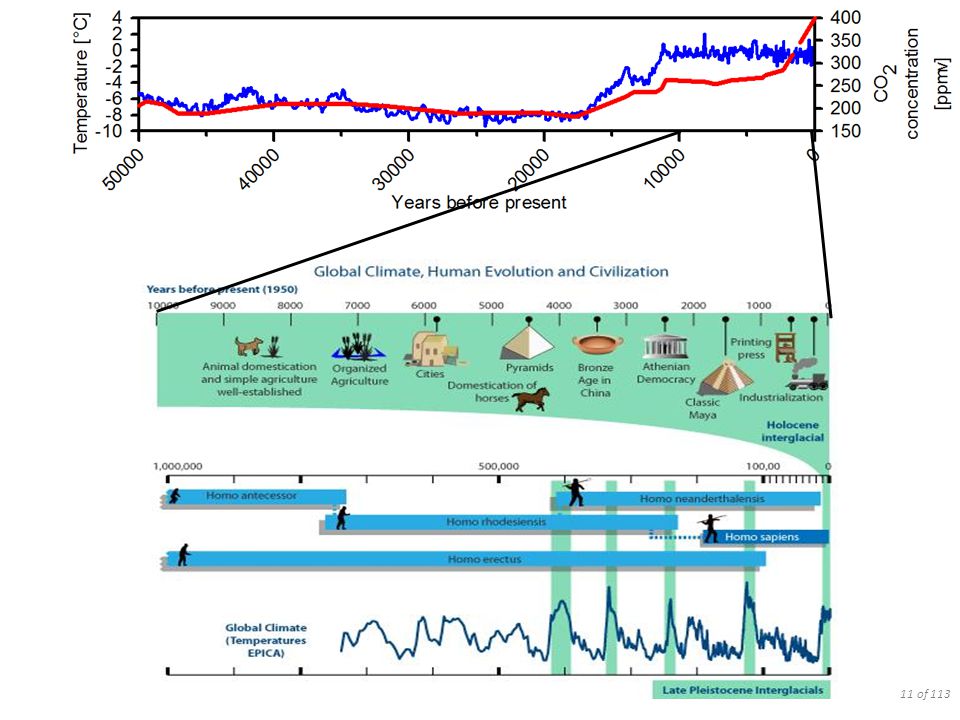
Our comfy climate

12
The externalities…

15
Does CO2 absorb sunlight?

17
Effects on the cryosphere

19
Probability=100% So this is happening. We’re now left with slowing it...

20
Projections

21
What does +6° C look like? ?

22
What does -6° C look like?

23
Doubt exists…

24
Credible doubt?

25
Doubt exists…

26
Doubt exists…

27
Doubt vs. credible doubt

28
The “period of consequences”

29
Leave the fossil fuels in the ground
Solutions Winston Churchill, November 12, 1936: Efficiency Conservation Solar Wind Storage (Nuclear) Leave the fossil fuels in the ground
 Leave the fossil fuels in the ground.")
30
Energy Resources Non-renewable energy resources are stores of energy which form over millions of years… Renewable energy resources are stores of energy which can be recycled or replaced by natural processes in less than 100 years.

31
FOSSIL FUELS 85% of the world’s commercial energy
COAL NATURAL GAS OIL

32
Electricity capacity in the U.S.

33
How many “solar energies” are there?
“Solar energy” (sunlight) Wind Hydroelectric Biomass Coal Oil Natural gas
 Wind. Hydroelectric. Biomass. Coal. Oil. Natural gas.")
34
? Solar Energies Not solar: “Solar energy” (sunlight) Nuclear Wind
Hydroelectric Biomass Coal Oil Natural gas Nuclear Geothermal ?

35
Passive Solar Construction
Solar Thermal Energy Passive Solar Construction

36
Solar hot water (not electric!)
")
37
Solar Electricity

38
Solar energy in space: satellites

39
Solar cells on Earth: where there are no outlets

40
Solar energy in space Opportunity, April 2014 Someday… For ?

41
Concentrating Solar Thermal (CSP)
The solar landscape Silicon PV Thin-Film PV diffuse collection SOLAR concentration Concentrating Solar Thermal (CSP) Concentration PV (CPV)
 Concentration PV. (CPV)")
42
Solar thermal: utility-scale energy

43
Solar cells on Earth: solar cars?

44
Solar cells on Earth: solar planes?

45
Solar cells on Earth: residential

46
Solar cells on Earth: utility scale

47
Solar cells on Earth: concentration PV

48
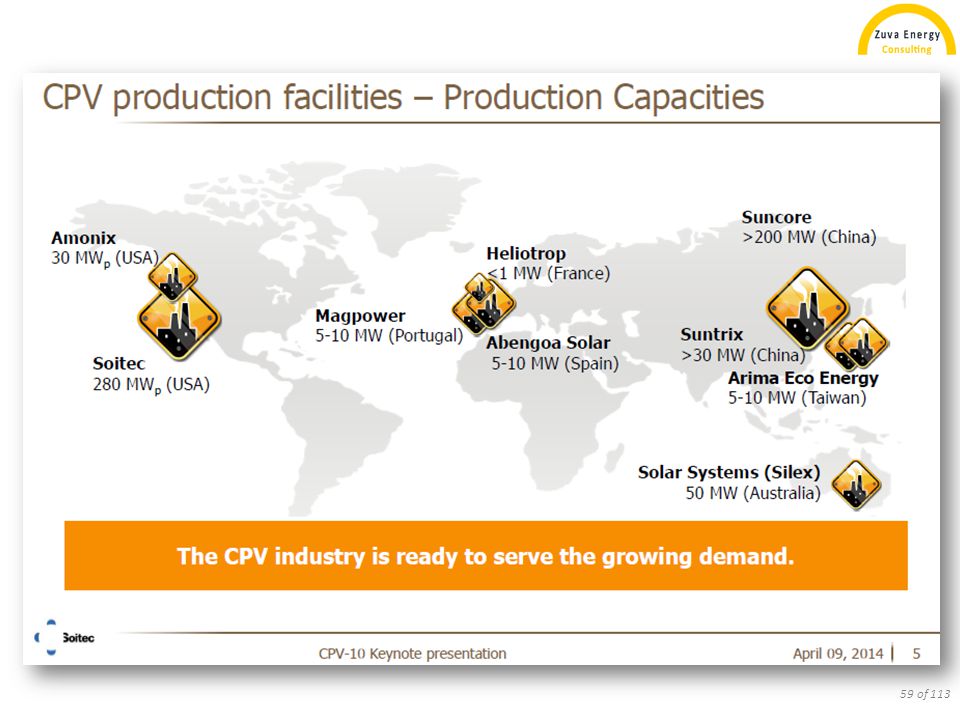
Concentration Photovoltaics (CPV)
")
49
The PV tipping point? Source: EPIA

50
World PV Capacity: 2013 140 GW=

51
…mostly in Europe Source: EPIA

52
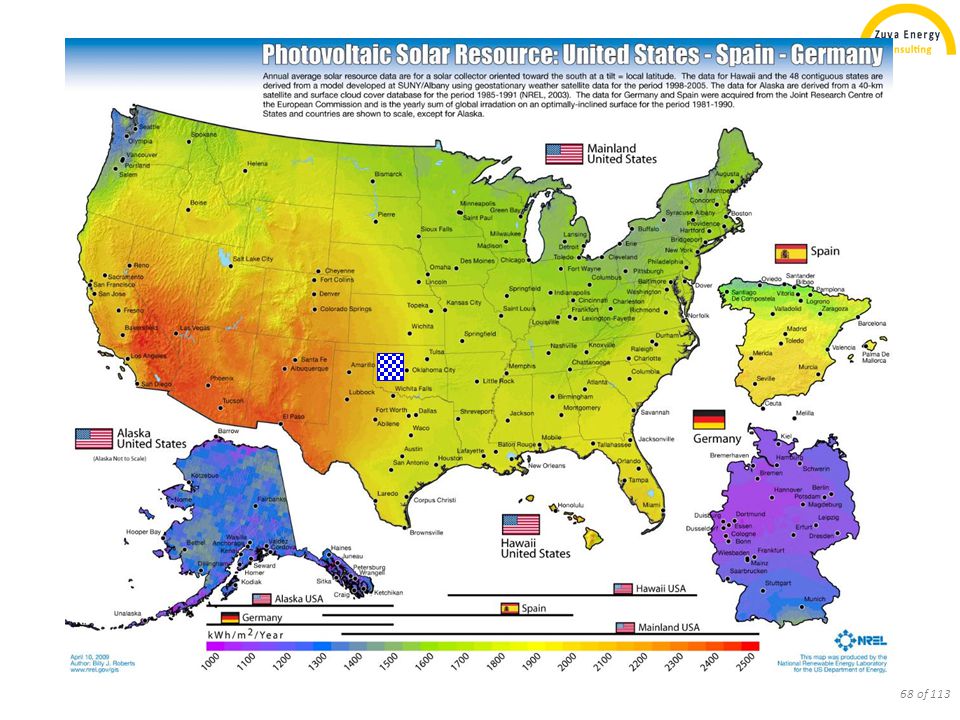
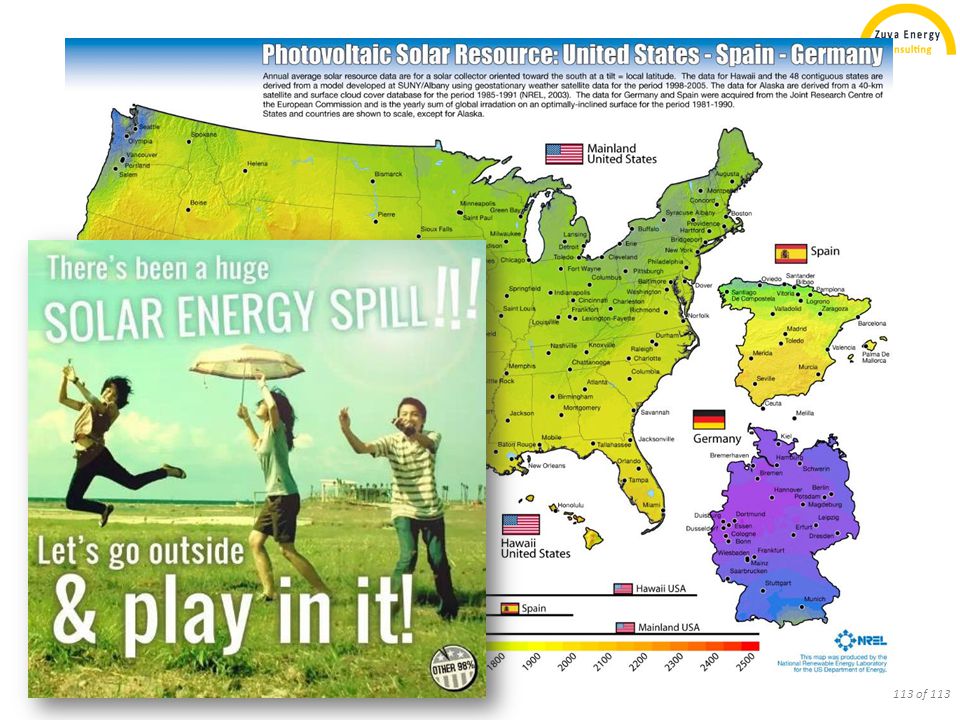
U.S. vs. Germany…

53
Who's wearing the training wheels?

54
Concentrating Solar Thermal (CSP)
The solar landscape Silicon PV Thin-Film PV diffuse collection SOLAR concentration Concentrating Solar Thermal (CSP) Concentration PV (CPV)
 Concentration PV. (CPV)")
55
Photovoltaic (PV) module: components
 module: components")
56
Photovoltaics (PV) direct conversion of sunlight into electricity is efficient semiconductor materials are expensive

57
Laboratory efficiencies
Cell at 25°C, standard spectrum

58
Module operating efficiency: 1/3 of the sun
coefficients per ASTM E : 34.5% 34.2% 33.3%! 33.5% outdoor operating efficiency rating confirmed at NREL G. S. Kinsey, W. Bagienski, A. Nayak, R. Gordon, V. Garboushian, “Advancing Efficiency and Scale in CPV Arrays”, IEEE J. Photovolt., vol. 3, no. 2, pp , doi: /JPHOTOV , 2013.

60
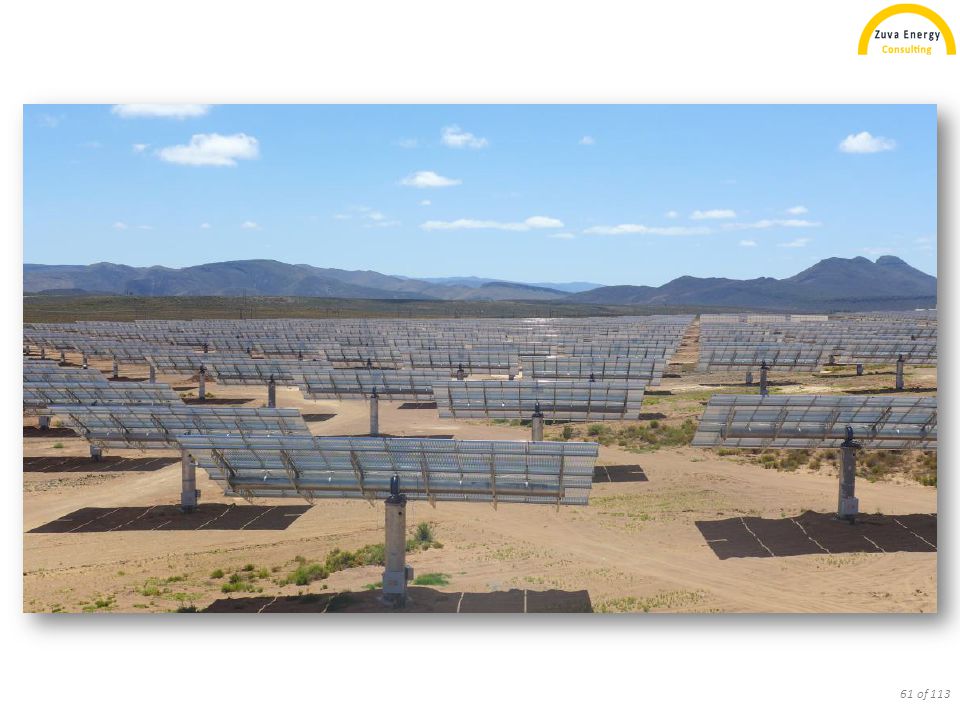
Soitec Solar's 44-MW Touwsrivier power plant

62
=11.2 TWh 1 quad=293 billion kWh

63
How much land area do we need?

64
How much land area do we need?

66
How much land area do we need?

67
How much land area do we need?

70
Sooooo… How do we pay for it?

71
Electricity consumption: example

72
PV for residential use

73
Levelized cost comparison
U.S. Energy Information Administration, "Levelized Cost of New Generation Resources in the Annual Energy Outlook 2013"

74
PV cost: a rapidly moving target
5.7 kW of modules: $24,000 (2007) $5,000 (2012)
 $5,000 (2012)")
75
The German Feed-in Tariff (FiT)
Source: J. Seel et al., " Why Are Residential PV Prices in Germany So Much Lower Than in the United States? ", Lawrence Berkeley National Laboratory, 2013

76
Soft costs dominate Source: J. Seel et al., " Why Are Residential PV Prices in Germany So Much Lower Than in the United States? ", Lawrence Berkeley National Laboratory, 2013

77
Electricity capacity in the U.S.

78
Soft costs Customer acquisition Installation
Permitting, inspection, interconnection

79
It hasn't been this way for long…
Source: J. Seel et al., " Why Are Residential PV Prices in Germany So Much Lower Than in the United States? ", Lawrence Berkeley National Laboratory, 2013

80
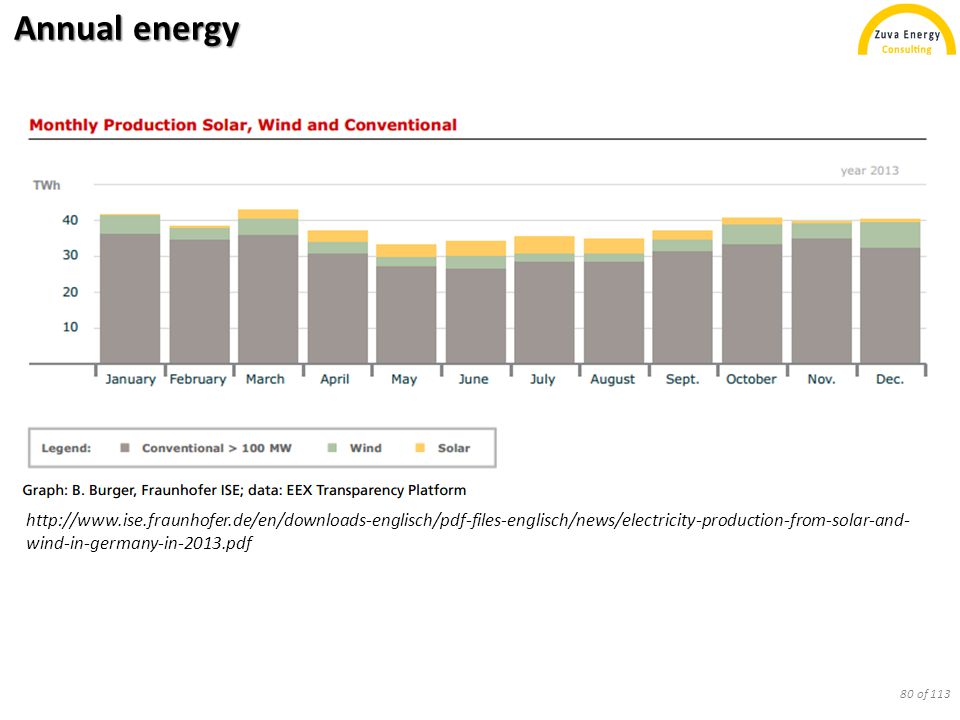
Annual energy
81
Germany peaked at ~40% solar power!
A good day for solar Germany peaked at ~40% solar power!

82
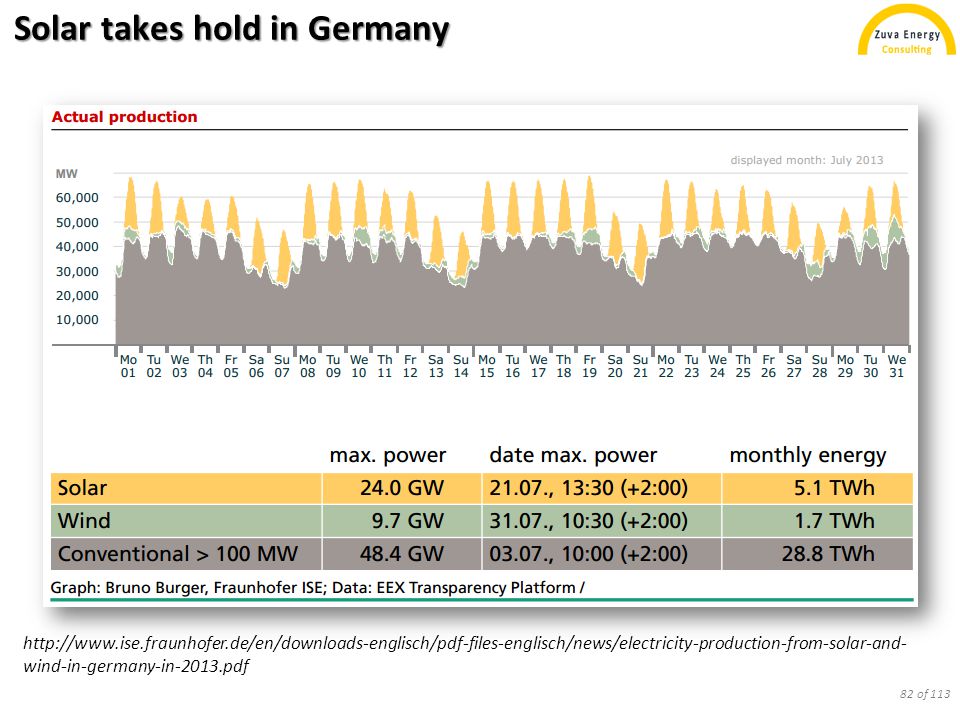
Solar takes hold in Germany
83
Germany's paperwork Minh Le, "Revitalizing American Competitiveness in Solar Technologies," available at:

84
Paperwork in the U.S. Minh Le, "Revitalizing American Competitiveness in Solar Technologies," available at:

85
Paperwork in the U.S. 18,000 jurisdictions Average delay: 70 days
Minh Le, "Revitalizing American Competitiveness in Solar Technologies," available at:

86
What's different? Feed-in tariff
this shifts the incentive from $/W to ¢/kW-h Reduces perceived risk Incentivizes long-term energy generation, long-lasting (durable) arrays Minimal permitting Renewables given priority Scale
 arrays. Minimal permitting. Renewables given priority. Scale.")
87
Residential vs. utility scale in the USA
Germany California Valley Solar Ranch (250 MW on trackers)
")
88
Heilbronn, Germany, April 30, 2011
Who needs a tracker? Heilbronn, Germany, April 30, 2011

89
Who needs a tracker? increases $/W:
(“$” go up, but the “W” stays the same!) greater installation complexity moving parts, complex installation, O&M, etc.
![]()
90
The need for tracking Want TW-h, not just GW:
Utility demand: flat output & high capacity factor requires tracking hardware
![]()
91
CPV example: Amonix

92
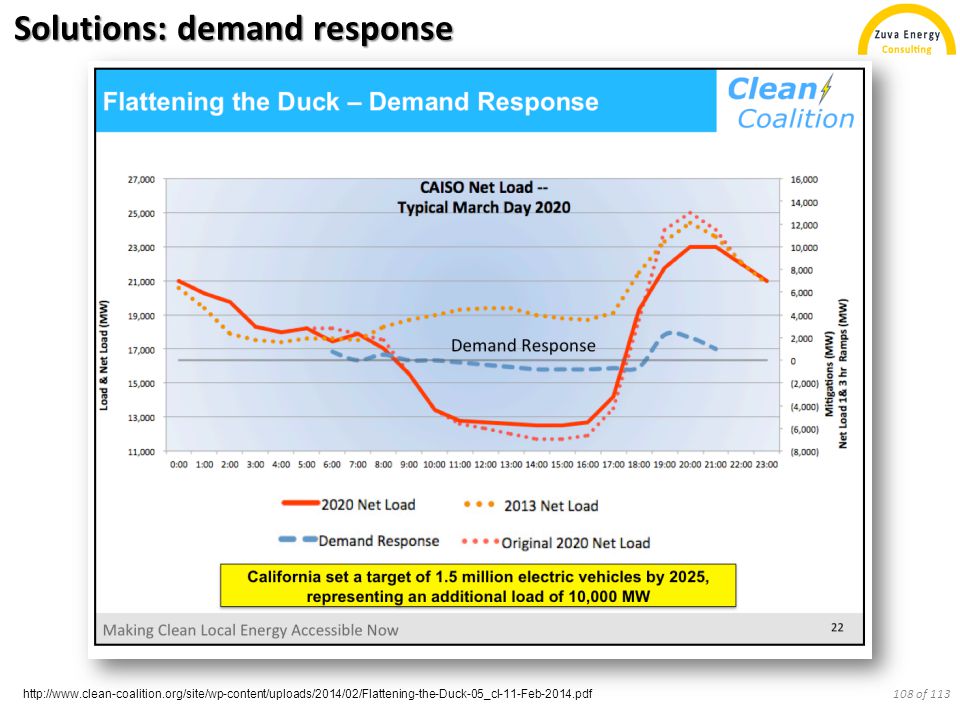
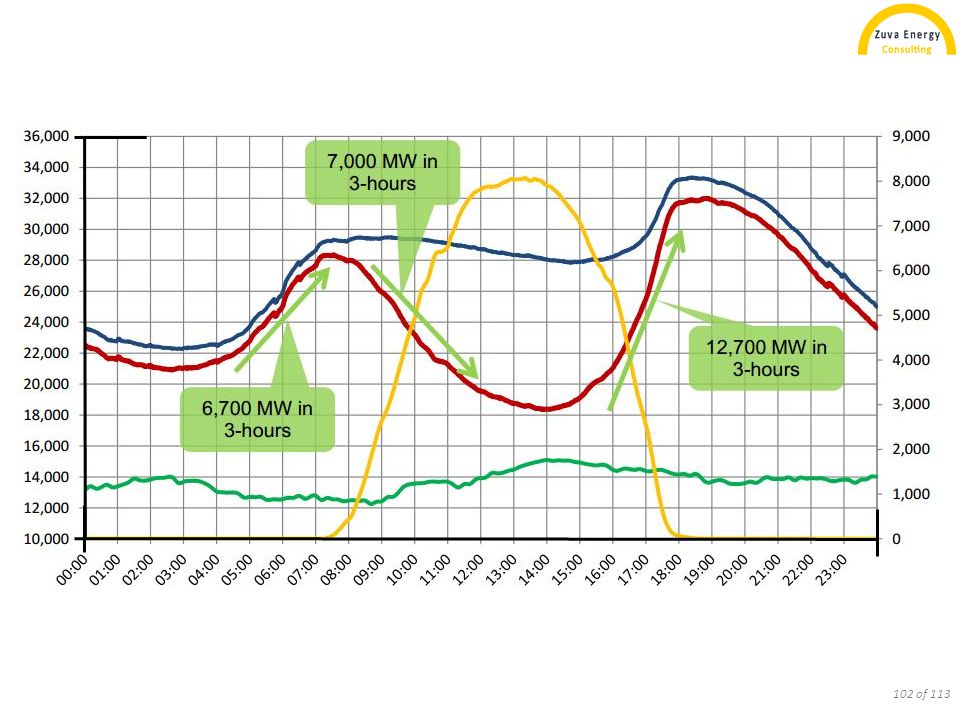
The duck curve

93
2013 (actual) 2020 (CAISO estimate)
 2020 (CAISO estimate)")
94
horizontal N-S tracker
fixed, latitude tilt solar, CAISO wind, CAISO net load, CAISO
![]()
95
Supply and demand: irradiance vs. electrical load

96
Leave the fossil fuels in the ground
Solutions Efficiency Conservation Solar Wind Storage (Nuclear) Leave the fossil fuels in the ground
 Leave the fossil fuels in the ground.")
97
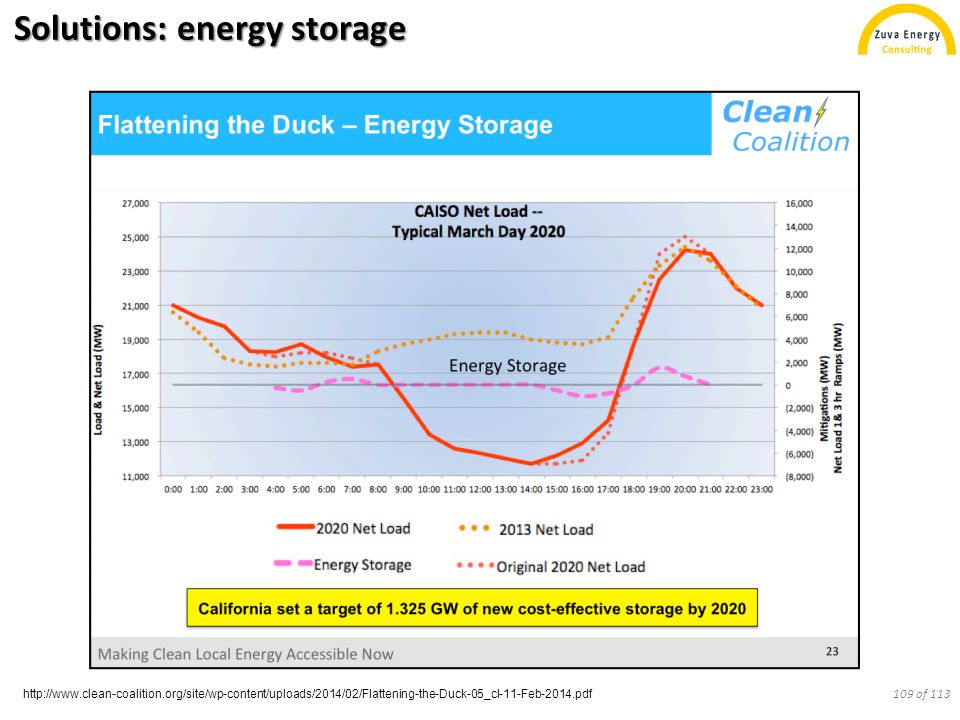
Cost Energy doesn’t like to be stored long-term potential for cost reduction is limited. Short-term cost reduction of 30-50%!

98
“Vehicle-to-grid”

99
Vehicle to grid

100
How hard is charging?

101
“Vehicle-to-grid”

103
Storage: vehicle-to-grid

104
http://www. clean-coalition
105
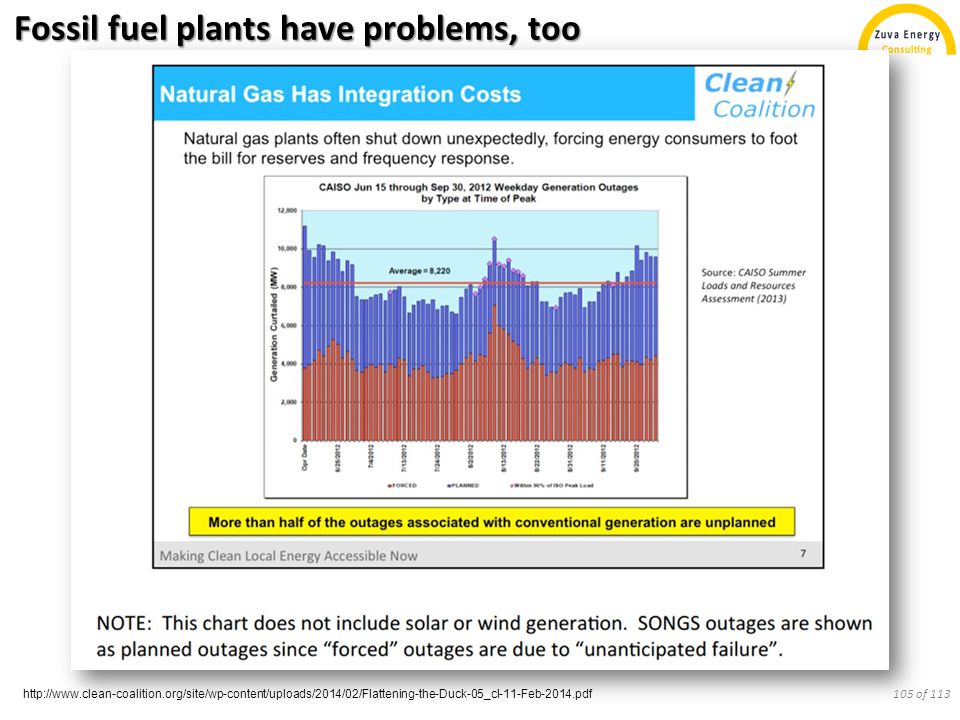
Fossil fuel plants have problems, too
106
http://www. clean-coalition

107
Solutions: energy trading

108
Solutions: demand response
109
Solutions: energy storage
110
Solutions: curtailment

111
Solutions: combined

112
Conclusion

115
Backup slides

116
Why can't we get nearer to 100%?

117
Why can't we get nearer to 100%?
Water pressure from rain high above the dam is used before it reaches the dam Rain that lands below the dam is lost

118
Solar spectrum

119
Terrestrial Spectrum: Available Current

120
Band edge limitation: silicon (single-junction) cell
Eg=1.1 eV (~1130 nm) Photons with energy > Eg thermalize down and lose energy Photons with energy < Eg pass through the cell unabsorbed
 Photons with energy > Eg thermalize down and lose energy. Photons with energy < Eg pass through the cell unabsorbed.")
121
Semiconductor band edge limitation
Energy [eV] Si: 1.1 eV0.7 V Eg=1.1 eV (~1130 nm) Silicon (Single Junction) 2 photons converted to current at 0.7 V
 Silicon (Single Junction) 2 photons converted to current at 0.7 V.")
122
Semiconductor band edge limitation
Energy [eV] Ge: 0.7 eV0.3 V GaAs: 1.4 eV1.1 V Si: 1.1 eV0.7 V GaInP: 1.9 eV1.6 V Silicon (single junction) III-V (multijunction) 3 photons converted to current at 3.0 V less photon energy lost to heat 2 photons converted to current at 0.7 V
 III-V (multijunction) 3 photons converted to current at 3.0 V. less photon energy lost to heat. 2 photons converted to current at 0.7 V.")
123
Fracking

125
Operating efficiency: 1/3 of the sun
coefficients per ASTM E : 34.5% 34.2% 33.3%! 33.5% outdoor operating efficiency rating confirmed at NREL G. S. Kinsey, W. Bagienski, A. Nayak, R. Gordon, V. Garboushian, “Advancing Efficiency and Scale in CPV Arrays”, IEEE J. Photovolt., vol. 3, no. 2, pp , doi: /JPHOTOV , 2013.

Similar presentations


 Hainan c agGY Ia-1 (2) Anhui agGY Ia-2 (3) agGY Ia-1 2 2 WD-2 WD-8 WD-36 agGY Ia-2 3 3.>")


