Download presentation
Presentation is loading. Please wait.

1
Scientific Method starting on p. 29
System – Hypothesis- Testing hypothesis- Model – Theory- Stages in the Scientific Method

2
Look at page 31 Stages in scientific method Whoosh!

3
SYSTEM SURROUNDINGS C3H7OH + O2 Energy Released Potential Energy CO2 + H2O

4
Section 1 Scientific Method
Chapter 2 Analyze this graph and formulate a Hypothesis p. 30

5
Homework Chapter 2 Section 1: P. 31 ( 1-5)
")
6
Qualitative and Quantitative
Qualitative – describes qualities, characteristics, textures, etc. Descriptions without numbers Quantitative – Describes quantities, mass, volume, length (numbers) 6
 6.")
7
Units of Measurement Quantity – what is being measured.
example: volume, length, mass Unit – a standard of measurement example: liter, meter, kilogram 7

8
T. Trimpe 2008 http://sciencespot.net/
Lesson 1: Length T. Trimpe

9
English vs. Metric Units
Which is longer? A. 1 mile or 1 kilometer B. 1 yard or 1 meter C. 1 inch or 1 centimeter 1.6 kilometers 1 mile 1 yard = meters 1 inch = 2.54 centimeters Left Image: Right Image:

10
Metric Units km m cm mm The basic unit of length in the metric system in the meter and is represented by a lowercase m. Metric Units 1 Kilometer (km) = 1000 meters 1 Hectometer (hm) = 100 meters 1 Meter = 100 Centimeters (cm) 1 Dekameter (dam) =10 meters 1 Meter = 1000 Millimeters (mm) 1 Meter = 10 Decimeters (dm) Which is larger? A. 1 meter or 105 centimeters B. 4 kilometers or 4400 meters C. 12 centimeters or 102 millimeters D millimeters or 1 meter
 = 1000 meters 1 Hectometer (hm) = 100 meters. 1 Meter = 100 Centimeters (cm) 1 Dekameter (dam) =10 meters. 1 Meter = 1000 Millimeters (mm) 1 Meter = 10 Decimeters (dm) Which is larger A. 1 meter or 105 centimeters. B. 4 kilometers or 4400 meters. C. 12 centimeters or 102 millimeters. D millimeters or 1 meter.")
11
Measuring Length How many millimeters are in 1 centimeter?
1 centimeter = 10 millimeters How many millimeters are in 1 centimeter? What is the length of the line in centimeters? _______cm What is the length of the line in millimeters? _______mm What is the length of the line to the nearest centimeter? ________cm HINT: Round to the nearest centimeter – no decimals. Ruler:

12
T. Trimpe 2008 http://sciencespot.net/
Lesson 2: Mass T. Trimpe

13
English vs. Metric Units
1 pound = grams Which is larger? 1. 1 Pound or 100 Grams 2. 1 Kilogram or 1 Pound 3. 1 Ounce or 1000 Milligrams 100 kg = pounds 1 ounce of gold = 28,349.5 milligrams

14
Kilogram Prototype Image - http://en.wikipedia.org/wiki/Kilogram
Metric Units kg g cg mg Mass refers to the amount of matter in an object. The base unit of mass in the metric system is the kilogram and is represented by kg. Metric Units 1 Kilogram (kg) = 1000 Grams (g) 1 Hectogram (hg) = 100 grams 1 Gram (g) = 1000 Milligrams (mg) 1 Dekagram (dag) =10 grams 1 Gram (g) = 100 Centigrams (cg) 1 Gram = 10 Decigrams (dg) Which is larger? A. 1 kilogram or 1500 grams B milligrams or 1 gram C. 12 milligrams or 12 kilograms D. 4 kilograms or 4500 grams Kilogram Prototype Image -
 = 1000 Grams (g) 1 Hectogram (hg) = 100 grams. 1 Gram (g) = 1000 Milligrams (mg) 1 Dekagram (dag) =10 grams. 1 Gram (g) = 100 Centigrams (cg) 1 Gram = 10 Decigrams (dg) Which is larger A. 1 kilogram or 1500 grams. B milligrams or 1 gram. C. 12 milligrams or 12 kilograms. D. 4 kilograms or 4500 grams. Kilogram Prototype Image -")
15
_______ + ______ + _______ = ________ g
Measuring Mass We will be using triple-beam balances to find the mass of various objects. The objects are placed on the scale and then you move the weights on the beams until you get the lines on the right-side of the scale to match up. Once you have balanced the scale, you add up the amounts on each beam to find the total mass. What would be the mass of the object measured in the picture? _______ + ______ + _______ = ________ g Top Image: Bottom Image:

16
T. Trimpe 2008 http://sciencespot.net/
Lesson 3: Volume T. Trimpe

17
English vs. Metric Units
Which is larger? A. 1 liter or 1 gallon B. 1 liter or 1 quart C. 1 milliliter or 1 fluid ounce 1 fl oz = ml 1 12-oz can of soda would equal approximately 355 ml. 1 gallon = 3.79 liters It would take approximately 3 ¾ 1-liter bottles to equal a gallon. 1 quart = liters

18
Liter Image: http://www.dmturner.org/Teacher/Pictures/liter.gif
Metric Units kL cL mL L Volume is the amount of space an object takes up. The base unit of volume in the metric system is the liter and is represented by L. Metric Units 1 liter (L) = 1000 milliliters (mL) 1 milliliter (mL) = 1 cm3 1 Kiloliter (kL) = 1000 Liters (L) 1 Hectoliters (hL) = 100 Liters 1 Dekaliter (daL) =10 Liters 1 Liter (L) = 100 Centiliters (cL) Liter (L) = 10 Deciliters (dL) Which is larger? A. 1 liter or 1500 milliliters B. 200 milliliters or 1.2 liters C. 12 cm3 or 1.2 milliliters Liter Image:
 = 1000 milliliters (mL) 1 milliliter (mL) = 1 cm3. 1 Kiloliter (kL) = 1000 Liters (L) 1 Hectoliters (hL) = 100 Liters. 1 Dekaliter (daL) =10 Liters 1 Liter (L) = 100 Centiliters (cL) 1 Liter (L) = 10 Deciliters (dL) Which is larger A. 1 liter or 1500 milliliters. B. 200 milliliters or 1.2 liters. C. 12 cm3 or 1.2 milliliters. Liter Image:")
19
Measuring Volume We will be using graduated cylinders to find the volume of liquids and other objects. Read the measurement based on the bottom of the meniscus or curve. When using a real cylinder, make sure you are eye-level with the level of the water. What is the volume of water in the cylinder? _____mL What causes the meniscus? A concave meniscus occurs when the molecules of the liquid attract those of the container. The glass attracts the water on the sides. Top Image: Bottom Image:

20
Measuring Liquid Volume
What is the volume of water in each cylinder? Images created at A B C Pay attention to the scales for each cylinder.

21
Measuring Solid Volume
10 cm 9 cm 8 cm We can measure the volume of regular object using the formula length x width x height. _____ X _____ X _____ = _____ We can measure the volume of irregular object using water displacement. Amount of H2O with object = ______ About of H2O without object = ______ Difference = Volume = ______ Click here for an online activity about volume. Choose Lessons Volume & Displacement

22
Converting Units Conversion Factor – equal ratio that enables you to change one unit to another Example: 1kg = 1000 g 1kg g 1000g or kg 22

23
Practice ____g = 57.8 mg _____km = 125m ____mL = 0.65L ____cg = 5.7mg
____L = 286 mL ____m = 112 cm ___mg = 9.7 cg ___ kg = 21 mg __ mm = 0.003km

24
SOLVE ___ g = 125mg kg +95cg+2g g .95 g g .125g g

25
Solve ___g=125mg + .15kg + 95cg + 2g ___cm=.13km + 29mm + 113cm + 1.5m
___g=2835mg + 245cg + 3g + .23kg

26
Memorize! 1 L = 1000ml = 1000cm3 1mL = 1cm3
And all other conversions on green sheet

27
Sample Problem A – pg. 14 Convert 0.851L to ml 27

28
Sample problems Convert 253 ml to liters Answer: 28

29
Sample Problem Convert 1258 cm to m Answer: 29

30
Sample Problem Convert 15 g to kg Answer: 30

31
Sample Problem Convert 5.25 hours to seconds Answer: 31

32
Density A physical property.
Density equals the mass of an object divided by its volume. D =m/V Units you will see: kg/m3 or g/ml or g/cm3 Density can be used to identify substances. 32

33
Kilogram per cubic meter
Derived SI Units p. 36 Quantity Quantity Symbol Unit Unit Abbreviation Area A Square meter m2 Volume V Cubic meter m3 Density D Kilogram per cubic meter kg

34
SI Base Units p. 34

35
Density Practice What is the density of a block of marble that occupies 310cm3 and has a mass of 853 grams?

36
Density Practice A diamond has a density of 3.26 g/cm3. What is the mass of a diamond that has a volume of 0.35 cm3?

37
Density Practice What is the volume of a sample of liquid mercury that has a mass of 76.2g, given that the density of mercury is 13.6 g/ml ?

38
Now… Density Worksheet 1 & 2
Homework: Quiz over p. 42 (1-5) – next class
 – next class.")
39
Uncertainty in Measurement
A digit that must be estimated is called uncertain. A measurement always has some degree of uncertainty 39

40
Why Is there Uncertainty?
Measurements are performed with instruments No instrument can read to an infinite number of decimal places

41
Which of these balances has the greatest uncertainty in measurement?

42
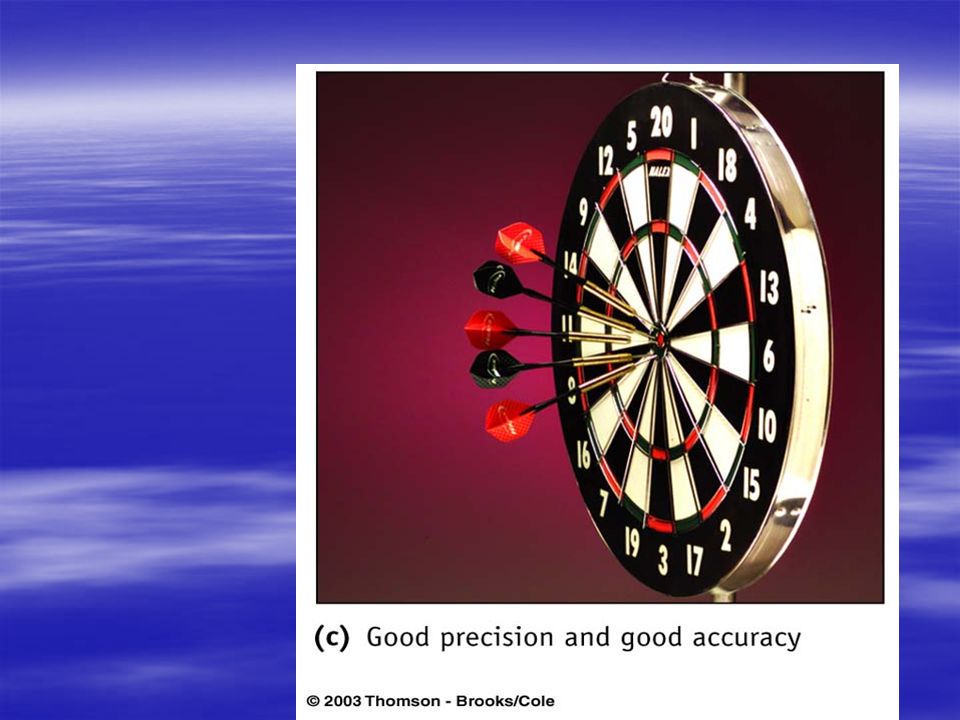
Accuracy vs. Precision ACCURATE = CORRECT PRECISE = CONSISTENT
Accuracy - how close a measurement is to the accepted value Precision - how close a series of measurements are to each other ACCURATE = CORRECT PRECISE = CONSISTENT

46
Experimental Data Carbon = 12.0107 amu
During your experiment, you obtained the following values: , , Are these Precise or Accurate?

47
Percent Error Indicates accuracy of a measurement
% error = Accepted – Experimental x Accepted

48
Percent Error % error = - 2.9 %
A student determines the density of a substance to be 1.40 g/mL. Find the % error if the accepted value of the density is 1.36 g/mL. % error = 1.36 – x 100= % error = %

49
Significant Figures Indicate precision of a measurement.
Recording Sig Figs Sig figs in a measurement include the known digits plus a final estimated digit 2.35 cm

50
Rules for Counting Significant Figures - Details
Nonzero integers always count as significant figures. 3456 has 4 sig figs.

51
Rules for Counting Significant Figures - Details
Zeros -Beginning zeros do not count as significant figures. has 3 sig figs

52
Rules for Counting Significant Figures - Details
Zeros - Middle zeros always count as significant figures. 16.07 has 4 sig figs.

53
Rules for Counting Significant Figures - Details
Zeros End zeros are significant only if the number contains a decimal point. 9.300 has 4 sig figs.

54
Rules for Counting Significant Figures - Details
Exact numbers have an infinite number of significant figures. 1 inch = cm, exactly

55
Counting Sig Fig Examples
Significant Figures Counting Sig Fig Examples ____ sig figs ___ sig figs 3. 5,280 3. 5,280 ____ sig figs ____ sig figs

56
Sig Fig Practice #1 How many significant figures in each of the following? m 5 sig figs 17.10 kg 4 sig figs L 3.29 x 10³ s 3 sig figs cm 2 sig figs

57
Significant Figures (13.91g/cm3)(23.3cm3) = 324.103g 324 g
Calculating with Sig Figs Multiply/Divide - The # with the fewest sig figs determines the # of sig figs in the answer. (13.91g/cm3)(23.3cm3) = g 4 SF 3 SF 3 SF 324 g
(23.3cm3) = g. 4 SF. 3 SF. 3 SF. 324 g.")
58
Rules for Significant Figures in Mathematical Operations
6.38 x 2.0 = 12.76 13 (2 sig figs)
")
59
Sig Fig Practice #2 Calculation Calculator says: Answer
3.24 m x 7.0 m ____ m __ m2 100.0g ÷ 23.7cm3 ________ g/cm3 ____g/cm3 0.02cm x 2.371cm ______ cm ____ cm2 710 m ÷ 3.0 s ________ m/s ____ m/s

60
Significant Figures 3.75 mL + 4.1 mL 7.85 mL 3.75 mL + 4.1 mL 7.85 mL
Calculating with Sig Figs (con’t) Add/Subtract - The # with the lowest decimal value determines the place of the last sig fig in the answer. 3.75 mL mL 7.85 mL 3.75 mL mL 7.85 mL 7.9 mL
 Add/Subtract - The # with the lowest decimal value determines the place of the last sig fig in the answer mL mL mL mL mL mL. 7.9 mL.")
61
Significant Figures Calculating with Sig Figs (con’t)
Exact Numbers do not limit the # of sig figs in the answer. Counting numbers: 12 students Exact conversions: 1 m = 100 cm “1” in any conversion: 1 in = 2.54 cm

62
Significant Figures Practice Problems 6. 18.9 g - 0.84 g 18.06 g
5. (15.30 g) ÷ (6.4 mL) 4 SF 2 SF = g/mL 2.4 g/mL 2 SF g g 18.1 g 18.06 g
 ÷ (6.4 mL) 4 SF. 2 SF. = g/mL. 2.4 g/mL. 2 SF g g. 18.1 g g.")
63
Scientific Notation In science, we deal with some very LARGE numbers:
1 mole = In science, we deal with some very SMALL numbers: Mass of an electron = kg

64
Imagine the difficulty of calculating the mass of 1 mole of electrons!
kg x ??????????????????????????????????

65
Scientific Notation: A method of representing very large or very small numbers in the form: M x 10n M is a number between 1 and 9.9 n is an integer

66
. 2 500 000 000 Step #4: Re-write in the form M x 10n 9 8 7 6 5 4 3 2
Step #1: Insert an understood decimal point Step #2: Decide where the decimal must end up so that one number is to its left Step #3: Count how many places you bounce the decimal point Step #4: Re-write in the form M x 10n

67
2.5 x 10⁹ The exponent is the number of places we moved the decimal.

68
0.0000579 1 2 3 4 5 Step #2: Decide where the decimal must end
up so that one number is to its left Step #3: Count how many places you bounce the decimal point Step #4: Re-write in the form M x 10n

69
5.79 x 10⁻⁵ The exponent is negative because the number we started with was less than 1.

70
PERFORMING CALCULATIONS IN SCIENTIFIC NOTATION

71
Scientific Notation Practice Problems ________g 7. 2,400,000 g
kg 9. 7 10-5 km 104 mm ________ kg ________ km _______ mm

72
Scientific Notation Type on your calculator: = 671.6049383 = 670 g/mol
Calculating with Sci. Notation (5.44 × 10⁷ g) ÷ (8.1 × 10⁴ mol) = Type on your calculator: EXP EE EXP EE ENTER EXE 5.44 7 8.1 ÷ 4 = = 670 g/mol = 6.7 × 10² g/mol
 ÷ (8.1 × 10⁴ mol) = Type on your calculator: EXP. EE. EXP. EE. ENTER. EXE ÷ 4. = = 670 g/mol. = 6.7 × 10² g/mol.")
73
Direct Proportions The quotient of two variables is a constant
As the value of one variable increases, the other must also increase As the value of one variable decreases, the other must also decrease The graph of a direct proportion is a straight line

74
Inverse Proportions The product of two variables is a constant
As the value of one variable increases, the other must decrease As the value of one variable decreases, the other must increase The graph of an inverse proportion is a hyperbola

75
Proportions Direct Proportion y x Inverse Proportion y x

Similar presentations


>")


