Download presentation
Presentation is loading. Please wait.

1
Week 1 Ecology Chapters 52-54

2
Dispatch—Make 3 observations on the distribution of biomes

3
Goal and Name same side Line up for pic

4
Descending air absorbs moisture Ascending air releases moisture
Air Cells Descending air absorbs moisture Ascending air releases moisture

5
Group whiteboard Draw a mountain
Predict what happens to air as it rises over a mountain

6
How mountains affect rainfall. RAINSHADOW

7
Show the O2 and CO2 cycle Be as detailed as possible
One person will be picked to present

8
Nitrogen cycle

9
Dispatch If your group needs to presentfind a group to listen and approve you If your group is approved listen to group’s nitrogen presentation if they have all components, tell me

10
Nitrogen Cycle Animation

11
Population vs. Community

12
Population Ecology QUESTIONS: What is a population?
What affects the size a population can get?

13
Population A population is a group of individuals of a single species that simultaneously occupy the same general area. Two characteristics that affect populations are ________ and _______

14
Population characteristics
Density~ # of individuals per unit of area •counts •sample size estimate •indirect indicators •mark-recapture Dispersion~ pattern of spacing •random~ unpredictable, patternless spacing (a) •clumped~ patchy aggregation (b) •uniform~ even spacing (c)
 •clumped~ patchy aggregation (b) •uniform~ even spacing (c)")
15
Density is the result of a dynamic interplay
Between processes that add individuals to a population and those that remove individuals from it

16
Births and immigration add individuals to a population.
PopuIation size Emigration Deaths Deaths and emigration remove individuals from a population.

17
Activity: Make a graph for a bacterial population and an elephant population

20
Dispatch—Get a textbook
Draw an exponential growth curve? What species exhibit this growth? What about the environment would make an r species exhibit exponential growth? Describe what a population’s carry capacity is and what it means to the population? Compare and contrast density- dependent to density-independent factors? Take our calendar and tell your tablemates 3 upcoming deadlines Pick up a growth half sheet and a paper that says class set Wilderness Park 9:30 TOMORROW

21
Population Growth Models
Exponential model (blue) • idealized population in an unlimited environment (J-curve); r-selected species (r=per capita growth rate) Logistic model (red) •carrying capacity (K): maximum population size that a particular environment can support (S-curve); K-selected species
 • idealized population in an unlimited environment (J-curve); r-selected species (r=per capita growth rate) Logistic model (red) •carrying capacity (K): maximum population size that a particular environment can support (S-curve); K-selected species.")
22
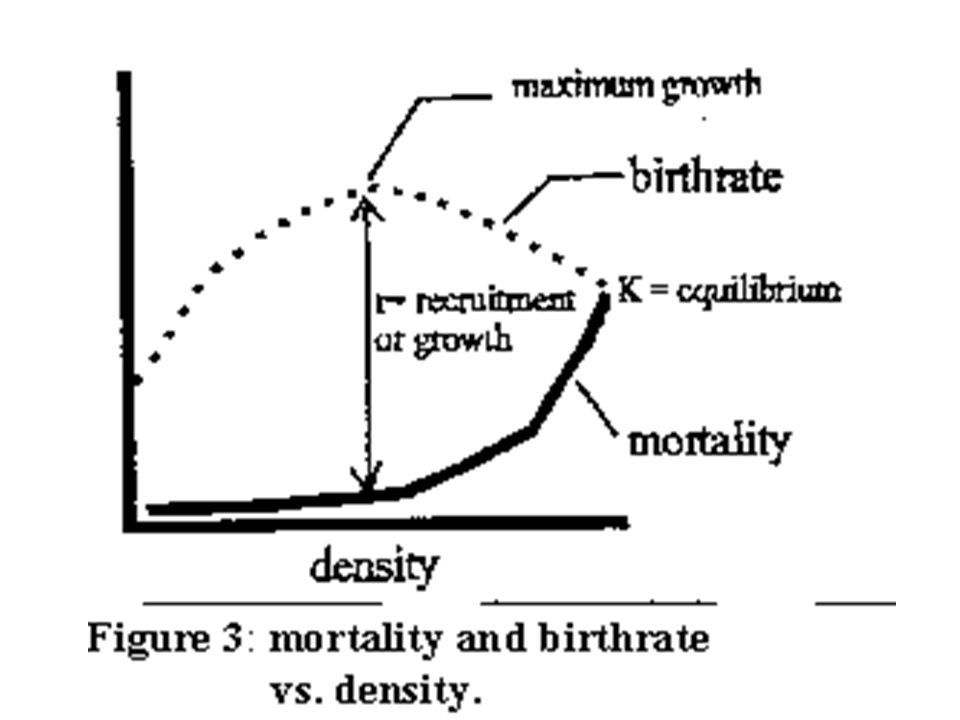
Demography: factors that affect growth & decline of populations
Birthrate (natality, fecundity)~ # of offspring produced Death rate (mortality) Age structure~ relative number of individuals of each age Survivorship curve~ plot of numbers still alive at each age
~ # of offspring produced. Death rate (mortality) Age structure~ relative number of individuals of each age. Survivorship curve~ plot of numbers still alive at each age.")
23
R vs. K survivorship curves

24
Population life history “strategies”
r-selected (opportunistic) Short maturation & lifespan Many (small) offspring; usually 1 (early) reproduction; no parental care High death rate Ex:________ K-selected (equilibrial) Long maturation & lifespan Few (large) offspring; usually several (late) reproductions; extensive parental care Low death rate Ex:____________
 Short maturation & lifespan. Many (small) offspring; usually 1 (early) reproduction; no parental care. High death rate. Ex:________. K-selected (equilibrial) Long maturation & lifespan. Few (large) offspring; usually several (late) reproductions; extensive parental care. Low death rate. Ex:____________.")
25
Population limiting factors
Density-dependent factors •competition •predation •stress/crowding •waste accumulation Density-independent factors •weather/climate periodic disturbances

26
Community Ecology QUESTIONS: 1) What is a community?
2) Who are the members of this community? 3) What is a food chain?
 Who are the members of this community 3) What is a food chain")
27
Differences in Community structure
Community~ an assemblage of populations living close enough together for potential interaction. Many different ______. Communities differ dramatically in their species richness (number of species) & relative abundance of different species
 & relative abundance of different species.")
28
How can we account for the species found together as members of a community?
2 Hypotheses: •Individualistic~ all the species just happened to live in the same area b/c they all had similar abiotic requirements. Example they all needed same temperature, rainfall, soil type which is why they live in the same habitat. •Interactive~ all the species are locked into association by mandatory biotic interactions. Species are found together b/c they have formed relationships +, - and o.

29
Between Species TASK: Add a column to the right and give an example of each type of interaction

30
Activity: Interaction Charades
I will give your group an interaction and you act it out

Similar presentations


. 2.d.1 – All biological.>")


