Download presentation
Presentation is loading. Please wait.

1
Angstrom Care 培苗社 Atomic Structure II
積極推崇『我要學』的心態, 糾正『要我學』的被動心態。

2
Topic 2 Atomic structure (4 hours)
State the position of protons, neutrons and electrons in the atom State the relative mass and relative charge of protons, electrons and neutrons. The accepted values are: Relative Mass Charge proton neutron electron 5x Define the terms mass number (A), atomic number (Z) and isotopes of an element. Deduce the symbol for an isotope given its mass number and atomic number. Use the notation AZX eg 126C.
, atomic number (Z) and isotopes of an element Deduce the symbol for an isotope given its mass number and atomic number. Use the notation AZX eg 126C.")
3
2.1.6 Compare the properties of the isotopes of an element
Calculate the number of protons, electrons and neutrons in atoms and ions from the mass number, atomic number and charge. Compare the properties of the isotopes of an element Isotopes have the same chemical properties but different physical properties. Examples include 1H, H, 1H; 6C, C; Cl Cl. Discuss the uses of radioisotopes Examples should include 14C in radiocarbon dating, 60Co in radiotherapy and 131 Iodine and 125 Iodine as medical tracers Aim 7: Students should be aware of the dangers to living things of radioisotopes but also justify their usefulness with the examples above.

4
NUCLIDES AND THE PERIODIC TABLE
A = Mass Number 7 Chemical Symbol of Element Li Z = Atomic Number 3 What is the atomic number of an element? What is the mass number of an element? Write down the nuclide notation for a sodium atom that has 11 protons and 12 neutrons. Is the relative atomic mass of a nuclide related to the atomic number or the mass number? Which nuclide is used as the reference mass against which all relative atomic masses are measured?

5
How do isotopes of the same element differ?
Write down the mole mass of this reference nuclide – remembering that although relative atomic masses have no units, the actual mole mass does! How do isotopes of the same element differ? Look at a copy of the Periodic table. Are all the relative atomic masses listed whole numbers? How can the existence of isotopes be used to explain the relative atomic masses that you see? The mean relative atomic mass of an element is the weighted mean of all the relative isotope masses present in the sample. Naturally occurring substances contain mixtures of different isotopes which can be separated by a mass spectrometer. Each isotope’s mass to charge ratio can be identified and the amount of each isotope present in the sample quantified. Applications include using mass spectra to identify where ancient metal samples were obtained and hence make deductions about trade routes.

6
Learning check: Neon has two isotopes of mass number 20 and 22. They are present in the approximate ratio 9:1 or percentage abundances of 90% and 10%. Show that naturally occurring neon has a RAM of approx. 20.2

7
The Periodic Table On the blank periodic table on the next slide or provided: Label or colour in the alkali metal group, the alkaline earth metal group, the halogens and the noble gases. Mark clearly the period that contains hydrogen and helium Draw a dividing line that separates the metals and the non- metals – labelling each section of the periodic table clearly Try to show where you would expect the elements to be gases. Extension work: Find out what the two horizontal sets of elements at the bottom of the periodic table are called Fill in as many element symbols as you can

8
THE PERIODIC TABLE

9
Radiocarbon dating Radiocarbon dating
This method of scientific dating is used for samples which were once alive (eg in bone, charcoal, leather). All of these contain carbon, a proportion of which is radioactive 14C, an isotope that is continuously being formed in the upper atmosphere. As living organisms take up radiocarbon along with other carbon atoms, the ratio between the two forms remains constant. However when they die the radiocarbon decays and is not replaced. Since it decays at a known constant rate, the decreasing concentration of 14C can be measured and the date when the material died estimated.
. All of these contain carbon, a proportion of which is radioactive 14C, an isotope that is continuously being formed in the upper atmosphere. As living organisms take up radiocarbon along with other carbon atoms, the ratio between the two forms remains constant. However when they die the radiocarbon decays and is not replaced. Since it decays at a known constant rate, the decreasing concentration of 14C can be measured and the date when the material died estimated.")
10
Radiotherapy Radiotherapy, also called radiation therapy, is the treatment of cancer and other diseases with ionizing radiation. Ionizing radiation deposits energy that injures or destroys cells in the area being treated (the "target tissue") by damaging their genetic material, making it impossible for these cells to continue to grow. Although radiation damages both cancer cells and normal cells, the latter are able to repair themselves and function properly. Radiotherapy may be used to treat localized solid tumors, such as cancers of the skin, tongue, larynx, brain, breast, or uterine cervix. It can also be used to treat leukemia and lymphoma (cancers of the blood-forming cells and lymphatic system, respectively). Gamma rays are a form of photons used in radiotherapy. Gamma rays are produced spontaneously as cobalt 60 atoms release radiation as they decompose, or decay
 by damaging their genetic material, making it impossible for these cells to continue to grow. Although radiation damages both cancer cells and normal cells, the latter are able to repair themselves and function properly. Radiotherapy may be used to treat localized solid tumors, such as cancers of the skin, tongue, larynx, brain, breast, or uterine cervix. It can also be used to treat leukemia and lymphoma (cancers of the blood-forming cells and lymphatic system, respectively). Gamma rays are a form of photons used in radiotherapy. Gamma rays are produced spontaneously as cobalt 60 atoms release radiation as they decompose, or decay.")
11
Medical tracers

12
2.2 The Mass Spectrometer (1h)
2.1.1 Describe and explain the operation of a mass spectrometer. A simple diagram of a single beam mass spectrometer is required. The following stages of operation should be considered: vaporization, ionization, acceleration, deflection and detection 2.1.2 Describe how the mass spectrometer may be used to determine relative atomic mass using the 12C scale. 2.1.3 Calculate non-integer relative atomic masses and abundance of isotopes from given data.

13
THE MASS SPECTROMETER How a mass spectrometer works
If something is moving and you subject it to a sideways force, instead of moving in a straight line, it will move in a curve - deflected out of its original path by the sideways force. Suppose you had a cannonball travelling past you and you wanted to deflect it as it went by you. All you've got is a jet of water from a hose-pipe that you can squirt at it. Frankly, its not going to make a lot of difference! Because the cannonball is so heavy, it will hardly be deflected at all from its original course. But suppose instead, you tried to deflect a table tennis ball travelling at the same speed as the cannonball using the same jet of water. Because this ball is so light, you will get a huge deflection. The amount of deflection you will get for a given sideways force depends on the mass of the ball. If you knew the speed of the ball and the size of the force, you could calculate the mass of the ball if you knew what sort of curved path it was deflected through. The less the deflection, the heavier the ball.

14
An outline of what happens in a mass spectrometer

16
Stage 1: Vaporization – the sample is heated or boiled to produce atoms or molecules
Stage 2: Ionization - the atom is ionised by knocking one or more electrons off to give a positive ion. This is true even for things which you would normally expect to form negative ions (chlorine, for example) or never form ions at all (argon, for example). Mass spectrometers always work with positive ions. Stage 3: Acceleration - the ions are accelerated so that they all have the same kinetic energy. Stage 4: Deflection - the ions are then deflected by a magnetic field according to their masses. The lighter they are, the more they are deflected. The amount of deflection also depends on the number of positive charges on the ion - in other words, on how many electrons were knocked off in the first stage. The more the ion is charged, the more it gets deflected. Stage 5: Detection - the beam of ions passing through the machine is detected electrically.
 or never form ions at all (argon, for example). Mass spectrometers always work with positive ions. Stage 3: Acceleration - the ions are accelerated so that they all have the same kinetic energy. Stage 4: Deflection - the ions are then deflected by a magnetic field according to their masses. The lighter they are, the more they are deflected. The amount of deflection also depends on the number of positive charges on the ion - in other words, on how many electrons were knocked off in the first stage. The more the ion is charged, the more it gets deflected. Stage 5: Detection - the beam of ions passing through the machine is detected electrically.")
17
What the mass spectrometer output looks like
The mass of each ion being detected is related to the size of the magnetic field used to bring it on to the detector. The machine can be calibrated to record current (which is a measure of the number of ions) against m/z directly. The mass is measured on the 12C scale. What the mass spectrometer output looks like The output from the chart recorder is usually simplified into a "stick diagram". This shows the relative current produced by ions of varying mass/charge ratio.
 against m/z directly. The mass is measured on the 12C scale. What the mass spectrometer output looks like. The output from the chart recorder is usually simplified into a stick diagram . This shows the relative current produced by ions of varying mass/charge ratio.")
19
Finding the weighted average for Mg
From the mass spectrum 78.99% Mg-24; 10.00% Mg-25; 11.01%Mg-26 Consider if we had 100 atoms of Mg Then we would have of Mg-24 which weigh We would have of Mg-25 which weigh And we would have of Mg-26 which weigh Total So 100 atoms weigh amu Therefore the average for 1 atom is 24.32amu A= 24.32 Mg Z= 12

20
Isotope calculations Sometimes we need to know the abundance of two isotopes
If the weighted average for Chlorine atoms is and Cl exists as two isotopes 35Cl and 37Cl. What are their respective percentage abundances? Let there be x % of 35Cl Then there is (100 – x) of 37Cl Assuming 100 atoms,then 35x +37{100-x} = 35.45 100 This gives 35x – 37x = 3545 Or = 2x And x = 77.5% of 35Cl
 of 37Cl. Assuming 100 atoms,then 35x +37{100-x} = This gives 35x – 37x = Or 155 = 2x. And x = 77.5% of 35Cl.")
21
2.3 Electron Arrangement (2h)
Describe the electromagnetic spectrum. Students should be ale to identify the ultraviolet, visible and infrared regions and to describe the variation in wavelength, frequency and energy across the spectrum. Distinguish between a continuous spectrum and a line spectrum Explain how the lines in the emission spectrum of hydrogen are related to the energy levels of electrons.

22
More details 2.2.3 Students should be able to draw an energy-level diagram, show transitions between different energy levels and recognize that the lines in a line spectrum are directly related to these differences. An understanding of convergence is expected. Series should be considered in the ultraviolet, visible and infrared regions of the spectrum. Calculations, knowledge of quantum numbers and historical references are not required. Aim 7: Interactive simulations modeling the behaviour of electrons in the hydrogen atom can be used.

23
2.2.4 Deduce the electron arrangement for atoms and ions up to Z = 20
For example, or 2,8,7 for Z = 17. and O2- is 2.8 or 2,8

24
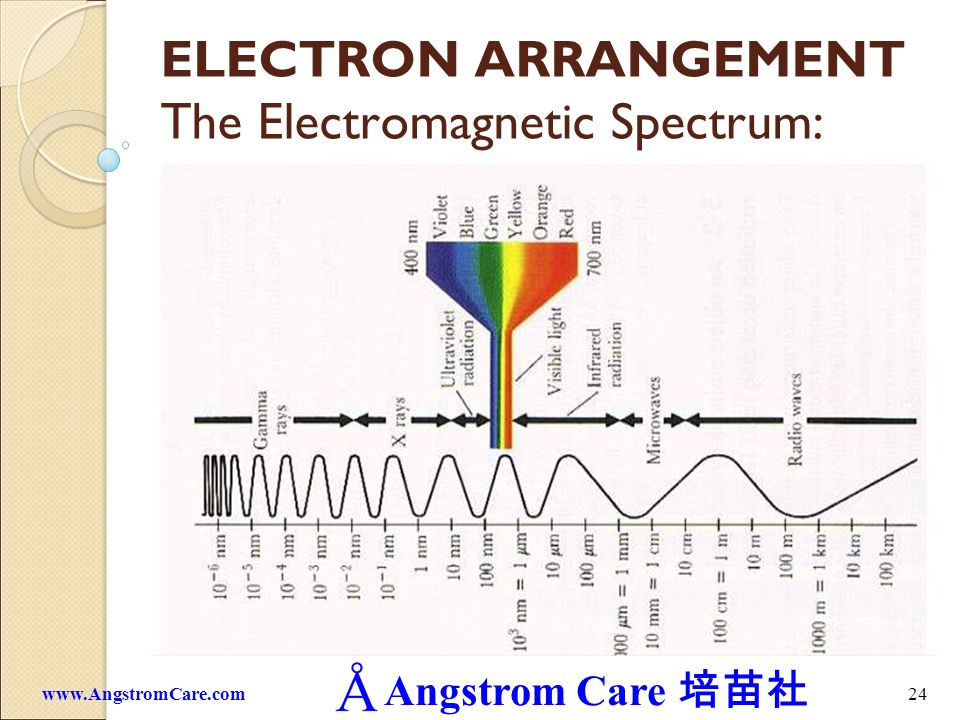
ELECTRON ARRANGEMENT The Electromagnetic Spectrum:
26
How does the wavelength vary as one passes from the visible to the infrared region of the spectrum?
How does the frequency change as one goes from the radio to the ultraviolet region? Which part of the visible spectrum is associated with the highest energy? E = h v

27
Continuous spectra

28
Line Emission spectra

29
CONTINUOUS AND LINE SPECTRA
Use the hand held spectrometers to look at the light emitted by the overhead lights in the lab and the small red neon LED’s on some of the switches or the neon emission tube. Sketch what you see in each case in the space below and label the spectra as line or continuous

30
FLAME TESTS

31
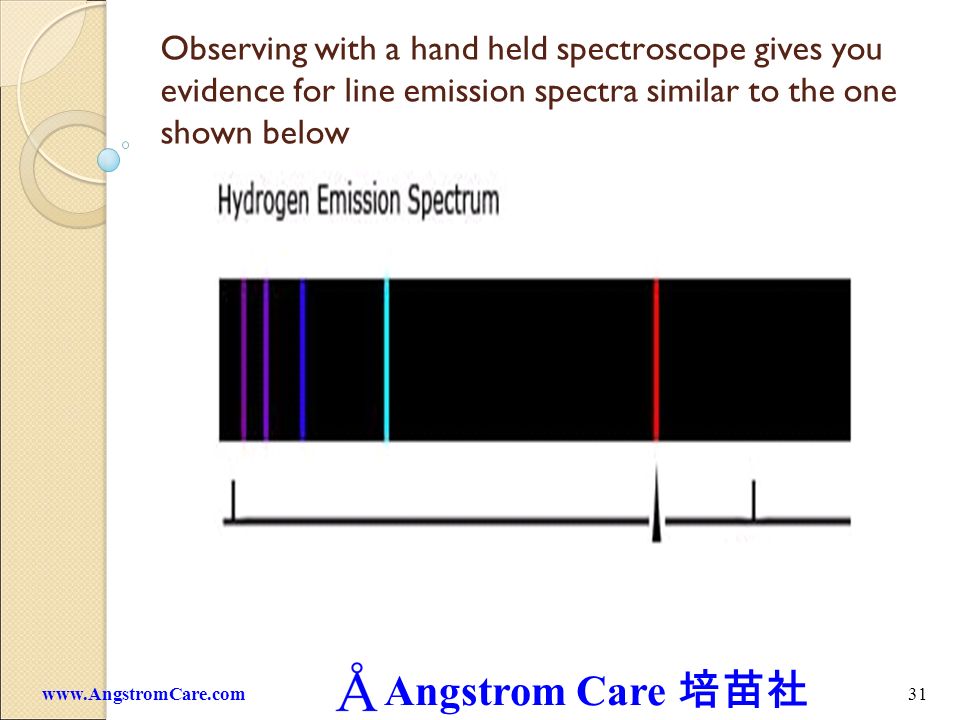
Observing with a hand held spectroscope gives you evidence for line emission spectra similar to the one shown below
32
What do spectra tell us? After a class discussion, you should understand that: The energy transfers that occur in the flame test are: Electrons gain energy from the Bunsen flame, forming excited atoms Electrons lose energy when they fall back to their lower states and emit radiation. One particular set of transitions results in visible light. The emission line spectra that you see through a spectroscope are evidence for: The existence of separate (or discrete) electron energy levels in an atom.
 electron energy levels in an atom.")
33
LINE EMISSION SPECTRA OF DIFFERENT ELEMENTS
Each element has its own characteristic set of energy levels. Each element therefore has its own set of emission lines - the emission line “fingerprint pattern” can be used to identify the element. As the number of electrons in the atom increase, the line emission spectrum gets more complex. For the simplest element, hydrogen, there is only 1 electron with 1 ground state but many excited states available to it.

34
LINE EMISSION SPECTRA OF HYDROGEN ATOMS
Lines in the H-atom emission spectrum do not occur at random Lines exist in a number of series, each series being governed by a mathematical rule. Each series converges to a high energy limit, since the rungs on the electron energy ladder get closer together the higher up the electron goes.

35
LINE EMISSION SPECTRA OF HYDROGEN ATOMS

36
Past IB Questions 1. Energy levels for an electron in a hydrogen atom are A. evenly spaced. B. farther apart near thenucleus. C. closer together near the nucleus. D. arranged randomly. 2. Which statement is correct for the emission spectrum of the hydrogen atom? A. The lines converge at lower energies. B. The lines are produced when electrons move from lower to higher energy levels. C. The lines in the visible region involve electron transitions into the energy level closest to the nucleus. D. The line corresponding to the greatest emission is in the Ultra Violet region

37
________________________________ n = ¥
(a) The diagram below (not to scale) represents some of the electron energy levels in the hydrogen atom. ________________________________ n = ¥ ________________________________ n = 6 ________________________________ n = 5 ________________________________ n = 4 ________________________________ n = 3 ________________________________ n = 2 ________________________________ n = l (i) Draw an arrow on the diagram to represent the electron transition for the ionization of hydrogen. Label this arrow A.(2) (ii) Draw an arrow on the diagram to represent the lowest energy transition in the visible emission spectrum. Label this arrow B.(2)
 The diagram below (not to scale) represents some of the electron energy levels in the hydrogen atom. ________________________________ n = ¥ ________________________________ n = 6. ________________________________ n = 5. ________________________________ n = 4. ________________________________ n = 3. ________________________________ n = 2. ________________________________ n = l. (i) Draw an arrow on the diagram to represent the electron transition for the ionization of hydrogen. Label this arrow A.(2) (ii) Draw an arrow on the diagram to represent the lowest energy transition in the visible emission spectrum. Label this arrow B.(2)")
38
The Answers 1. B [1] 2. D [1] 3. (i)line starting at n = 1; line finishing at n = ∞ (not above ∞); upward arrow; 2 max 3 correct [2], 2 correct [1]. (iii) Line from n = 3 to n = 2; Arrow pointing downward (in any transition); 2 [4]
![The Answers 1. B [1] 2. D [1] 3. (i)line starting at n = 1; line finishing at n = ∞ (not above ∞); upward arrow; 2 max.](http://slideplayer.com/slide/253107/1/images/38/The+Answers+1.+B+%5B1%5D+2.+D+%5B1%5D+3.+%28i%29line+starting+at+n+%3D+1%3B+line+finishing+at+n+%3D+%E2%88%9E+%28not+above+%E2%88%9E%29%3B+upward+arrow%3B+2+max..jpg "3 correct [2], 2 correct [1]. (iii) Line from n = 3 to n = 2; Arrow pointing downward (in any transition); 2. [4]")
39
Thank you

Similar presentations


 - shows evidence for the basic atomic model Sub-atomic particles.>")
. All atoms in an element are the same. Atoms arent EMPTY.>")


... Four postulates (1808)... 2. Atoms of the same element are identical...>")
 is broken up into its component frequencies.>")


