Download presentation
Presentation is loading. Please wait.

1
Chemistry Unit 14: Global Warming
Welcome To The GowerHour

2
I. Ozone Depletion A. Layers of the Atmosphere

3
I. Ozone Depletion A. Layers of the Atmosphere

4
1. Troposphere: The layer of the atmosphere closest to the Earth (0 - ____ km). It contains ______ of the mass of air, and almost all of the ______vapor. All weather events (rain, hurricanes) occur here. Most aircrafts fly in this region of the atmosphere. Temperature __________ in the troposphere as altitude increases. Visible light comes from the sun and radiates back from the Earth as ________ radiation (______). Molecules such as ____ absorb the IR and trap the heat. Because the concentration of molecules is _________ at the Earth’s surface, the temperature is highest there, and decreases with increasing altitude. Because warm air _____ and cold air ______, convection currents occur in the troposphere. This leads to the mixing of the troposphere (tropo = turning, changing). 10 most water decreases infrared CO2 Heat greatest rises sinks

5
2. Stratosphere: The second layer of the atmosphere (~10 – ___ km)
2. Stratosphere: The second layer of the atmosphere (~10 – ___ km). Temperature _________ in this region of the atmosphere due to ___________ reactions that occur in the stratosphere. There is a high concentration of ____ in this region, known as the ___________. Because the temperature is warmest at the top of this layer, convection currents do not occur. Therefore air in the stratosphere remains “layered.” (strato = stratified, layered) 50 increases exothermic O3 ozone layer
. Temperature. _________ in this region of the atmosphere due to ___________ reactions that occur in the stratosphere. There is a high concentration of ____ in this region, known as the ___________. Because the temperature is warmest at the top of this layer, convection currents do not occur. Therefore air in the stratosphere remains layered. (strato = stratified, layered) 50. increases. exothermic. O3. ozone layer.")
6
3. Mesosphere: Layer above the stratosphere (~50 km - _____ km)
3. Mesosphere: Layer above the stratosphere (~50 km - _____ km). Temperature __________ in this region of the atmosphere. 4. Thermosphere (Ionosphere): Uppermost layer of the atmosphere (~80 km – ____km). Temperature _________ in this region of the atmosphere because the molecules absorb very high energy particles from the sun, which causes an increase in their ______ energy. There are many ____ in this part of the atmosphere. 80 decreases 500 increases kinetic ions
. Temperature __________ in this region of the atmosphere. 4. Thermosphere (Ionosphere): Uppermost layer of the atmosphere (~80 km – ____km). Temperature _________ in this region of the atmosphere because the molecules absorb very high energy particles from the sun, which causes an increase in their ______ energy. There are many ____ in this part of the atmosphere. 80. decreases increases. kinetic. ions.")
7
B. Ozone in the Troposphere:
1. Ozone in the lower atmosphere is a _________ and is formed during photochemical smog. It can lead to health problems such as irritation of the ___________ tract. Higher concentrations of ozone can lead to premature aging of the lung tissue. Tropospheric ozone is sometimes called “Bad Ozone.” pollutant respiratory

8
C. Ozone in the Stratosphere:
1. Natural formation of ozone in the stratosphere: O2 + UV light 2 O (light wavelength < ___ nm) O + O2 + M O3 + M* (M = inert substance such as __, absorbs extra energy) 240 N2
 O + O2 + M O3 + M* (M = inert substance such as __, absorbs extra energy) 240. N2.")
9
2. Natural depletion of ozone in the stratosphere:
a. O3 + UV light O + O2 (light wavelength _____ to _____nm, UV light) b. Visible light: ______ to ______ nm UV-A ______ to ______ nm (suntan) UV-B ______ to ______ nm (sunburn, skin cancer) UV-C < _____ nm (absorbed in upper atm) c. Ozone protects us from UV radiation by absorbing UV-A and UV-B radiation as it decomposes. 3. Prior to the use of CFCs, this natural cycle of ozone formation and depletion was in _______ equilibrium. 220 330 E increases 400 700 320 400 290 320 290 dynamic (opposing rates are equal, conc. of O3 is constant)
 b. Visible light: ______ to ______ nm. UV-A ______ to ______ nm (suntan) UV-B ______ to ______ nm (sunburn, skin cancer) UV-C < _____ nm (absorbed in upper atm) c. Ozone protects us from UV radiation by absorbing UV-A and UV-B radiation as it decomposes. 3. Prior to the use of CFCs, this natural cycle of ozone formation and depletion was in. _______ equilibrium E increases dynamic. (opposing rates are equal, conc. of O3 is constant)")
10
D. Chlorofluorocarbons (CFCs, Freons) 1. Introduced in the _____.
2. Benefits: non-toxic, non-flammable, stable, inert. Replaced compounds like SO2 and NH3. 3. Uses: a. _______________ b. _______________ c. _______________ d. _______________ 4. The peak year of production was ____, when ________ tons of CFCs were produced in the US. 5. Because of their inertness, CFCs are able to diffuse into the stratosphere. 1930’s refrigeration air conditioners foams aerosol cans 1977 1.5 x 10⁶

11
example: CFCl3 + UV light CFCl2 + Cl (Freon-11)
6. Once they reach the stratosphere, UV radiation between 175 and 220 nm causes the CFCs to decompose. example: CFCl3 + UV light CFCl2 + Cl (Freon-11) 7. The __ atoms act as a catalyst in the destruction of ozone: Cl + O3 ClO + _____ ClO + O Cl + _____ Each Cl atom can react with approximately _________ ozone (O3) molecules! Cl O2 O2 O O → 2 O2 100,000
 7. The __ atoms act as a catalyst in the destruction of ozone: Cl + O3 ClO + _____. ClO + O Cl + _____. Each Cl atom can react with approximately _________ ozone (O3) molecules! Cl. O2. O2. O3 + O → 2 O2. 100,000.")
12
8. CFCs a. are NOT soluble in ______. b. do not react in the ____________. c. are able to diffuse into the _____________ (____ years). d. remain in the atmosphere for 75 - _____ years! 9. In 1974, Sherwood _________ and Mario _______ from UCI determined that CFCs were depleting ozone in the atmosphere. They won the Nobel Prize for their research in 1995. water troposhere stratosphere > 10 300 Rowland Molina

13
10. Overview of process:

14
E. Antarctic Ozone Hole:
1. Discovered in 1985, but satellite data shows depleted ozone as early as _____ (a data analysis program automatically threw out data that was lower than a particular threshold). 2. Before the ozone hole, the [O3] in the stratosphere was about 350 ppb. In the Antarctic spring (__________), the [O3] declines to as low as ___ ppb. The largest (in km2) ozone hole was seen in ____. 1979 Sept./Oct. 96 1998
. 2. Before the ozone hole, the [O3] in the stratosphere was about 350 ppb. In the Antarctic spring (__________), the [O3] declines to as low as ___ ppb. The largest (in km2) ozone hole was seen in ____ Sept./Oct")
16
3. Chlorine in the stratosphere is found in two general forms:
ACTIVE SPECIES: (_____) Cl + ClO RESERVOIR SPECIES: (______) HCl + ClONO2 (Chlorine nitrate) 4. The formation of the ozone hole: a. Sun goes down for the winter, no heat, no photons. Ozone no longer formed. b. Polar vortex (mass of very cold air circulating around the south pole) forms (T < _____). c. Polar Stratospheric Clouds (PSCs) form (Clouds do not normally form in the stratosphere, only in the __________). BAD! SAFE - 80oC troposhere
 Cl + ClO. RESERVOIR SPECIES: (______) HCl + ClONO2 (Chlorine nitrate) 4. The formation of the ozone hole: a. Sun goes down for the winter, no heat, no photons. Ozone no longer formed. b. Polar vortex (mass of very cold air circulating around the south pole) forms (T < _____). c. Polar Stratospheric Clouds (PSCs) form (Clouds do not normally form in the stratosphere, only in the __________). BAD! SAFE. - 80oC. troposhere.")
17
d. These solid ice clouds provide a surface for reactions to take place:
HCl ClONO > Cl HNO3 SAFE SAFE ACTIVE e. SUN comes up in spring, and Cl2 reacts with UV radiation to form 2 Cl atoms. Cl2 + UV light --> 2 Cl f. Cl atoms begin to react with the ozone molecules, quickly depleting them. g. The intermediate ____ is found in high concentrations when O3 concentrations are at their lowest. ClO

19
Polar stratospheric clouds provide a surface for the rx:
HCl + ClONO Cl2 + HNO3 Cl2 + hn Cl Spring sunlight Antarctic O3 Depletion (in purple) 17.3
")
20
F. Ozone Depletion over Mid-Latitudes
1. From 1979 to present, ozone concentrations have decreased by ~_____ over the mid-latitudes. 10%

21
G. Effects of Ozone Depletion
1. Increased ____ radiation, which leads to higher rates of __________ and ________. 2. __________ suffer the highest rates of skin cancer in the world. 3. Punta Arenas, Chile, (53◦S) has seen increases in UV-B radiation that is __ times greater than when ozone levels are normal. From 1987 – 2000, there was a _____ increase in skin cancers. UV skin cancer cataracts Australians 38 66%
 has seen increases in UV-B radiation that is __ times greater than when ozone levels are normal. From 1987 – 2000, there was a _____ increase in skin cancers. UV. skin cancer. cataracts. Australians %")
22
H. Reduction of CFCs 1. Montreal Protocol (_____): 24 nations signed document to freeze CFCs at levels. 2. Today 100 nations have reduced production of CFCs. It is predicted that there will still be an ozone hole until _____. 3. Replacements for CFCs have been: _______ and _____. 4. The replacements are more reactive in the atmosphere, therefore do not make it to the ____________. 5. Though the replacements have reduced the problem of ozone depletion, they are still problematic to the environment because they are _________________. 1987 ~2070 HCFCs HFCs stratosphere greenhouse gases

23
II. Climate Change (Global Warming)
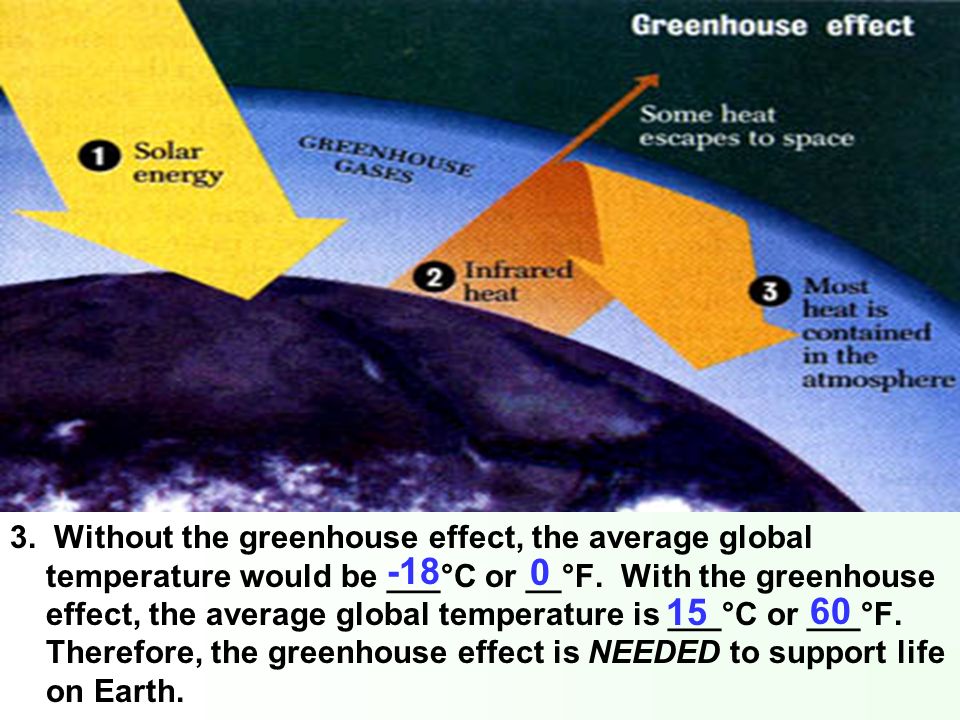
A. The Greenhouse Effect 1. The natural process by which ___________ absorb energy from the sun, thereby warming the Earth’s atmosphere. 2. The sun provides energy in the form of ____ and ________ light. This light is absorbed by the Earth’s surface and re-radiated as ___ radiation (____). Some of this heat is trapped by certain gases, like ____, ____, and ____. The rest of the heat escapes into ______. atmosphere UV visible IR heat CO2 CH4 N2O space
. Some of this heat is trapped by certain gases, like ____, ____, and ____. The rest of the heat escapes into ______. atmosphere. UV. visible. IR. heat. CO2. CH4. N2O. space.")
24
3. Without the greenhouse effect, the average global temperature would be ___°C or __°F. With the greenhouse effect, the average global temperature is ___°C or ___°F. Therefore, the greenhouse effect is NEEDED to support life on Earth. -18 15 60
25
Greenhouse Efficiency
4. Greenhouse gases: Gas Pre-industrial conc. Current conc. Greenhouse Efficiency CO2 280 ppm 385 ppm 1 CH4 715 ppb 1774 ppb 25 – 75 N2O 270 ppb 330 ppb 140 – 250 CFC-11 260 ppt 10,000 – 100,000 CFC-12 550 ppt

26
B. Global Warming 1. As the concentration of greenhouse gases have increased in the atmosphere, the global average temperature has ________, the global average sea level has _____, and the snow cover has ________. increased risen decreased

27
Figure 1 Figure 2

28
Keeling Curve: Plots of the longest continuous record of atmospheric carbon dioxide, taken at Mauna Loa Observatory, Hawaii (20oN, 156oW).
.")
29
The rise of carbon dioxide gas in our atmosphere has been measured continuously since 1958 and follows an oscillating line known as the "Keeling Curve”, named after Dr. Charles David Keeling, professor at Scripps Institution of Oceanography. A renowned expert on the way carbon moves through our planet’s environment, Keeling was the first to measure carbon dioxide in the atmosphere (1959) on a continuous basis.
 on a continuous basis..")
31
He discovered its annual fluctuations (the little squiggles in the curve) and was the first to report that global atmospheric concentrations of carbon dioxide were rising. The "Keeling curve" has become the symbol of the ever-changing chemistry of the atmosphere and the associated warming of the planet.

32
Keeling wanted to determine the cause of the yearly carbon dioxide fluctuations (squiggles)?
Was it processes on land, having to do with plant growth? Or did it come from the ocean? There are ways to distinguish between the two possibilities.

33
The answer is that the little squiggles in the Keeling curve are actually due to land plants. Since most of the land is in the northern hemisphere, the fluctuations are greatest there. (If the ocean were to blame, we should see a larger effect in the southern hemisphere.)
.")
34
Every spring, when trees leaf out and grasslands and farmlands green, the carbon dioxide in the air decreases, reflecting the uptake from photosynthesis. Conversely, in fall, when leaves and wilted plants are returned to the soil and decay, the carbon dioxide rises again. Thus, one can envision the Earth “breathing”on an annual cycle, and we can measure how deeply.

35
Why Hawaii? Recent increases in atmospheric carbon dioxide (CO2). The monthly CO2 measurements display small seasonal oscillations in an overall yearly uptrend; each year's maximum is reached during the Northern hemisphere’s late spring, and declines during the Northern Hemisphere growing season as plants remove some CO2 from the atmosphere.
. The monthly CO2 measurements display small seasonal oscillations in an overall yearly uptrend; each year s maximum is reached during the Northern hemisphere’s late spring, and declines during the Northern Hemisphere growing season as plants remove some CO2 from the atmosphere.")
36
Though Mauna Loa is an active volcano, Keeling and collaborators made measurements on the incoming ocean breeze and above the thermal inversion layer to minimize local contamination from volcanic vents. In addition, the data is normalized to negate any influence from local contamination

37
Figure 3

38
2. Eleven of the last twelve years rank among the 12 warmest years on record (since ____).
3. The total global average temperature increase from 1850 to present is ______. 4. The difference in global average temperature between now and the last ice age was only ____, therefore a small change in temperature is significant. 1850 0.76 oC 5 oC

39
Fossil fuel combustion
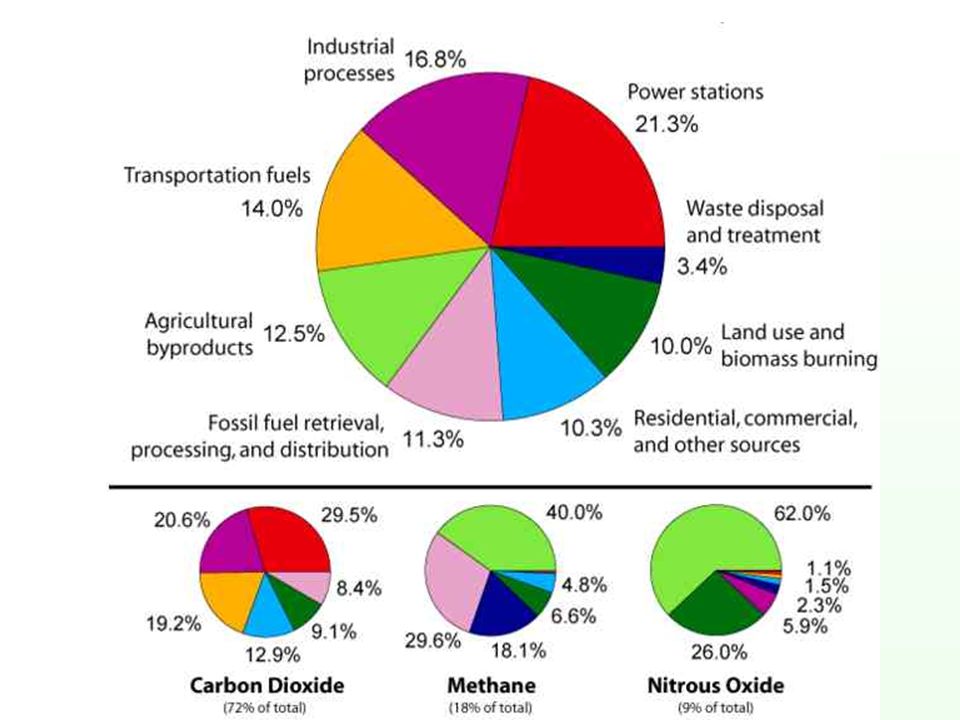
C. Sources of Greenhouse Gases 1. Carbon Dioxide Source Example % Fossil fuel combustion CH O2 73 Deforestation photosynthesis__, decomposition___ 25 Cement Production CaCO3 2 2 CO2 + 2 H2O CaO + CO2

40
without O2 2. Methane: Produced in anaerobic (__________) environments. Source % Natural Wetlands 20 Rice Paddies 19 Natural Gas Leakage 18 _________ 14 Landfills Biomass Burning 10 ____________ 4 Cows Termites

41
Fossil Fuel Consumption 31 ________________ 24
3. Nitrous Oxide Source % Agricultural Soils 44 Fossil Fuel Consumption 31 ________________ 24 Agricultural Waste Burning 1 Acid Production

42
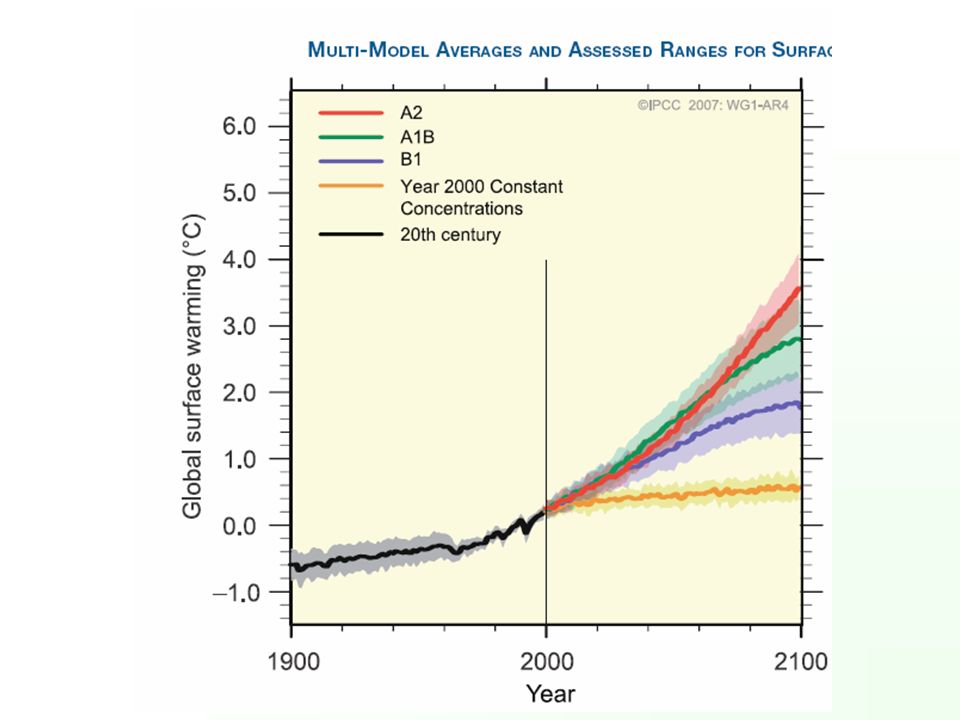
D. Changes in Temperature: The Future
1. For the next two decades, a warming of about _____ / decade is projected. 2. Depending on predicted emission scenarios, the predicted warming over the next century is ______ to ______, and the sea level rise is predicted to be ___ cm to ___cm. 3. The major uncertainty in the climate models are from changes in ___________, and the effects of _________ loops. 4. An example of a positive feedback loop: As the surface temperature warms, polar ice melts, reducing the amount of sunlight ________ back to space. More energy is _________ by the Earth, leading to more ________. 0.2 oC 1.8 oC 4.0 oC 18 59 cloud cover feedback reflected absorbed warming

44
E. Effects of Climate Change
1. The polar regions have warmed approximately _______________, which is significantly greater than other parts of the world. This warming has caused a decrease in sea ice area (predicted to decrease summer sea ice to ____ in the latter part of the century), and a warming of the permafrost. The tundra has a large store of _____________ in the soil. As the water table lowers, more of the carbon oxidizes to CO2. This is a positive feedback loop, which leads to more ________. 2. Warming tends to reduce land and ocean uptake of CO2, leaving more CO2 in the atmosphere (_________ feedback loop). As temperature increases, the solubility of a gas _________ (________ Law). 1.22 oC/decade zero organic carbon warming positive decrease Henry’s
, and a warming of the permafrost. The tundra has a large store of _____________ in the soil. As the water table lowers, more of the carbon oxidizes to CO2. This is a positive feedback loop, which leads to more ________. 2. Warming tends to reduce land and ocean uptake of CO2, leaving more CO2 in the atmosphere (_________ feedback loop). As temperature increases, the solubility of a gas _________ (________ Law) oC/decade. zero. organic carbon. warming. positive. decrease. Henry’s.")
45
3. Increasing atmospheric CO2 concentrations leads to an increase in ________ acid in the ocean. This causes the pH of the ocean to ________. Projections show the ocean pH to drop by 0.14 to 0.35 over the 21st century. 4. It is likely that future typhoons and __________ will become more intense. 5. It is very likely that there will be more ____________. 6. It is likely that there will be increased intensity of ___________(heavy rain and snow events). 7. Sea levels are predicted to rise 7 – 24 inches by 2100 due to thermal expansion alone (as water temperature increases, the density _________). carbonic decrease hurricanes hot extremes precipitation decreases
. 7. Sea levels are predicted to rise 7 – 24 inches by 2100 due to thermal expansion alone (as water temperature increases, the density _________). carbonic. decrease. hurricanes. hot extremes. precipitation. decreases.")
46
F. Ways to Reduce Greenhouse Gases
1. Change incandescent bulbs to ___________. Use: 4 hours per day Standard light bulb 63 kg CO2 / year Fluorescent light bulb 11 kg CO2 / year 2. Drive a car with greater fuel efficiency. 1 gallon of gas produces 8.8 kg of CO2. The average American drives 12,000 miles / year. Compare the kg of CO2 produced by an SUV that gets 18 miles per gallon to a hybrid car that gets 44 mpg. fluorescent 1 gal 8.8 kg CO2 12,000 mi x x = 5900 kg CO2 18 mi 1 gal 1 gal 8.8 kg CO2 12,000 mi x x = 2400 kg CO2 44 mi 1 gal

47
If there are 250,000,000 cars in the US, how many Tg of CO2 will be emitted from cars each year assuming 18 mpg versus 44 mpg? 5900 kg 103 g 1 Tg 2.5 x 10⁸ cars x x x = 1475 Tg 1 car 1 kg 1012 g = 1500 Tg 2400 kg 103 g 1 Tg 2.5 x 10⁸ cars x x x = 600Tg 1 car 1 kg 1012 g

48
In 2005 close to 1800 Tg CO2 emitted from transportation (all cars, trucks, etc.)
3. Use mass transit. 4. Ride your bike or walk. 5. Others????

49
One possible effect of the enhanced greenhouse effect is a rise in mean sea-level.

51
Rising sea levels.

53
8.5 Greenhouse effect 8.5.5 Identify the main greenhouse gases and their sources.

54
Many _______ and ____________ (anthropogenic) gases contribute to the greenhouse effect that warms the Earth's surface. Water vapor (H2O) is the _____ important, followed by carbon dioxide (CO2), _______ (CH4), ___________ (N2O), ozoneO3, and the chlorofluorocarbons (CFCs) used in air conditioners and many industrial processes. The increasing atmospheric CO2 concentration is likely the _____ significant cause of the current warming. natural human-made most methane nitrous oxide most
 is the _____ important, followed by carbon dioxide (CO2), _______ (CH4), ___________ (N2O), ozoneO3, and the chlorofluorocarbons (CFCs) used in air conditioners and many industrial processes. The increasing atmospheric CO2 concentration is likely the _____ significant cause of the current warming. natural. human-made. most. methane. nitrous oxide. most.")
55
Importance of Human-produced Greenhouse Gases
This diagram shows the relative importance of the major human-produced greenhouse gases to current warming. CO2 is the most important followed in descending order by methane, CFCs, ozone and nitrous oxide.

56
Greenhouse gases, which include water vapor, carbon dioxide, methane,ozone and dinitrogen monoxide warm the atmosphere by efficiently absorbing thermal infrared radiation emitted by the Earth’s surface, by the atmosphere itself, and by clouds. As a result of its warmth, the atmosphere also radiates thermal infrared in all directions, including downward to the Earth’s surface. Thus, greenhouse gases trap heat within the surface-troposphere system… the “Greenhouse Effect”. This mechanism is fundamentally different from the mechanism of an actual greenhouse, which instead isolates air inside the structure so that the heat is not lost by convection and conduction.

57
The Problem: The carbon dioxide problem can be stated relatively simply:
1. More than six and a half billion people burn fuel to keep warm, to provide electricity to light their homes and to run industry, and to move about using cars, buses, boats, trains, and airplanes. 2. The burning of fuel produces carbon dioxide, which is released to the atmosphere. 3. The burning of fuels adds about 6 gigatons of carbon to the atmosphere each year.

58
The Problem: The carbon dioxide problem can be stated relatively simply:
4. Carbon dioxide concentrations in the atmosphere have risen from about 270 parts per million (0.026%) before the industrial age to about 380 parts per million (0.038%) by 2006, a 41% increase over pre-industrial values, and a 31% increase since 1870. 5. Carbon dioxide is a greenhouse gas, and the increased concentration of carbon dioxide in the atmosphere must influence earth's radiation balance.
 before the industrial age to about 380 parts per million (0.038%) by 2006, a 41% increase over pre-industrial values, and a 31% increase since Carbon dioxide is a greenhouse gas, and the increased concentration of carbon dioxide in the atmosphere must influence earth s radiation balance.")
60
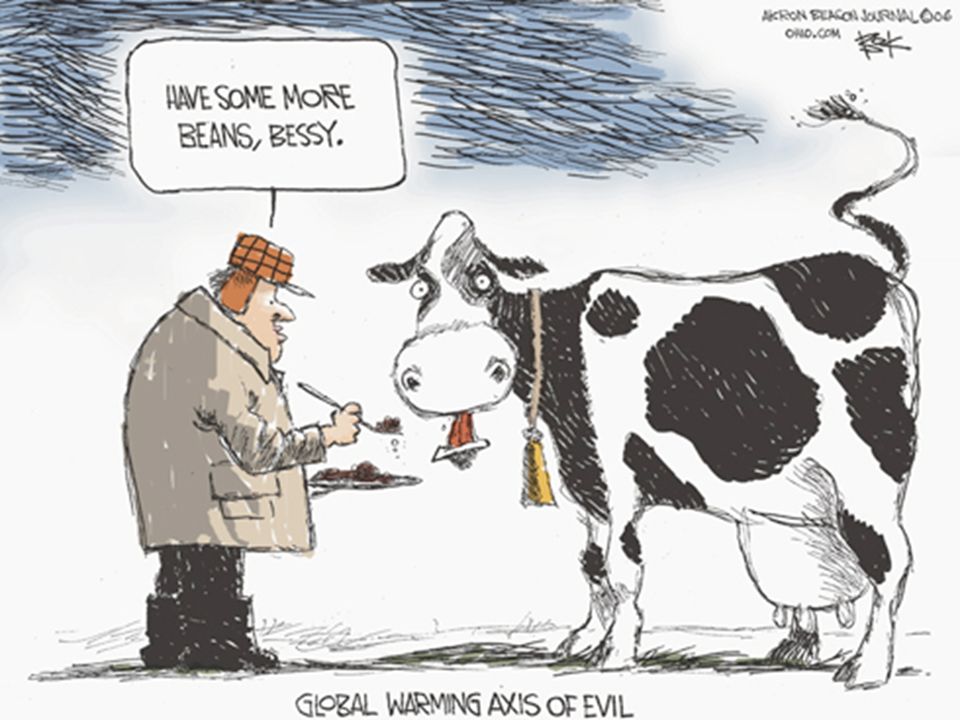
Bessy’s Stomachs:
Methane is the second most significant cause of greenhouse warming, behind carbon dioxide. Bessy, the science cow, and her many brothers and sisters are one of the greatest methane emitters. Bessy’s grassy diet and multiple stomachs cause her to produce methane, which she exhales with every breath. The sheer size of her herds makes a significant contribution to global.

61
Bessy the Science Cow: Bessy and her cow friends are one of the world's greatest methane emitters. Cows exhale methane, which is a byproduct of the digestion of their grassy diet.

62
A single cow is capable of producing from liters (25-35 cubic feet) of emissions every day, which adds up quickly when you consider the 55 million cattle that comprise Argentina’s massive livestock industry. Cows produce 30% of the global warming gases in Argentina!

65
I know how to stop global warming…

Similar presentations


>")


