Download presentation
Presentation is loading. Please wait.

1
Solution structures by NMR

2
} Structural Biology • Structure • Protein-protein • Mobility
• Protein-ligand } interactions NMR is a powerful method to address these problems year NMR structures per year • (first structure!) • • (first paramagnetic structure!) • •
 • • (first paramagnetic structure!) • •")
3
Structure determination through NMR
Resonance assignment NMR NOE intensities and J couplings (plus other structural constraints) Conversion of NMR data in distances and angles Structural constraints Structure calculations 3D structure Structure refinement: REM, RMD
 Conversion of NMR data in distances and angles. Structural constraints. Structure calculations. 3D structure. Structure refinement: REM, RMD.")
7
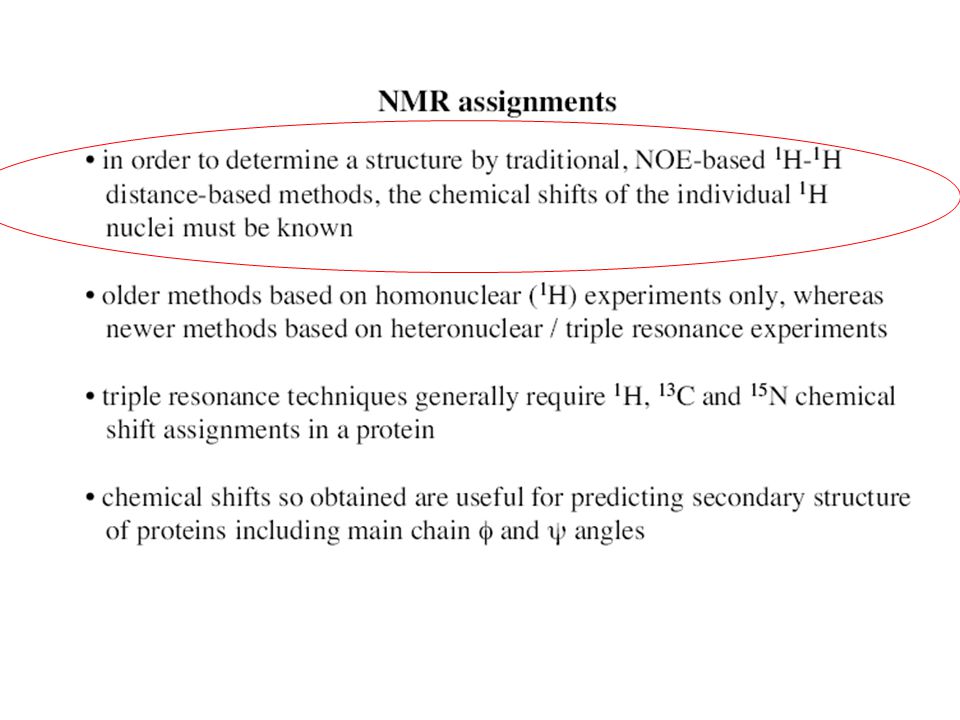
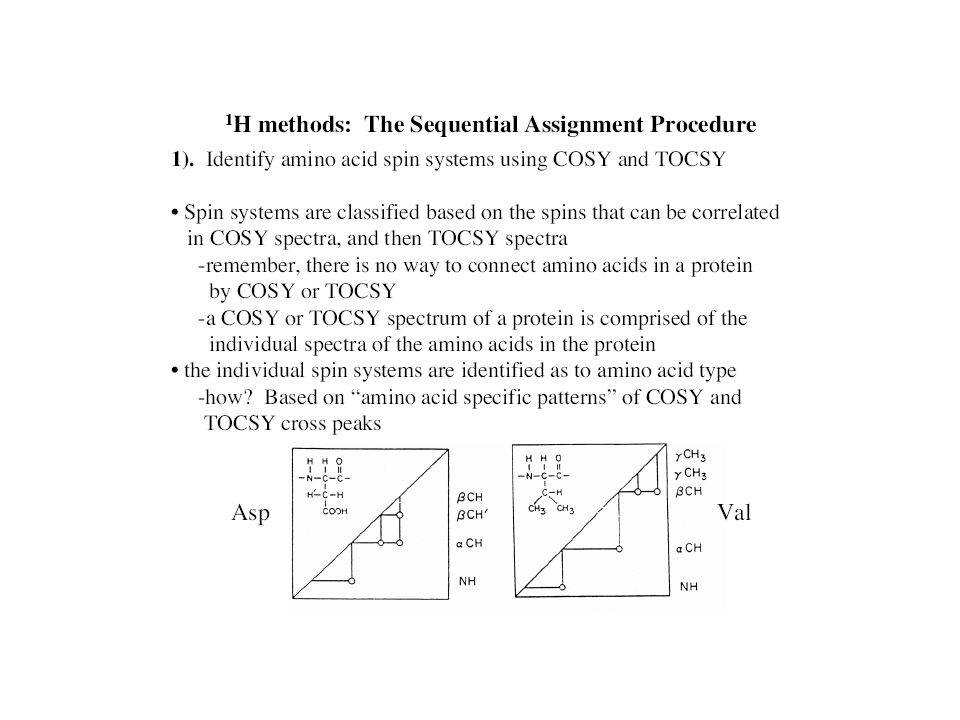
Assignment of homonuclear spectra

8
TOCSY Total Correlation Spectroscopy
Esperimento 2D analogo al COSY, utile per misurare gli accoppiamenti scalari “consecutivi”

13
NMR Tecniques and molecular weight

14
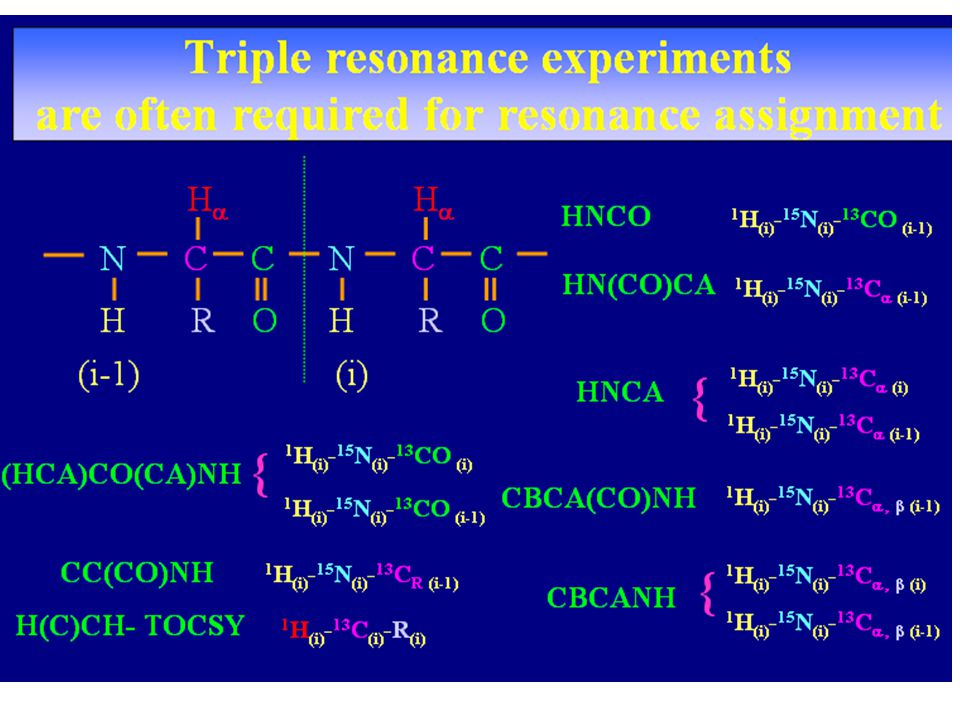
Multifrequency NMR experiments
To make full use of multidimensional NMR, isotope labeled samples are needed Multifrequency NMR experiments For each frequency dimension a different type of coupling can be detected

15
Triple Resonance J couplings Relaxation rates

16
HNCO H – N - CO Trasferisco da Hn ad N Osservo N prima dimensione
Trasferisco da N a CO Osservo CO Seconda dimensione Trasferisco da CO a N, da N ad Hn Osservo Hn Terza dimensione

17
Sequential asignment using the HNCA and HNCOCA experiments

18
Assignment procedure

19
Sequential assignment in triple resonance experiments. HNCA
Backbone assignment of 6 residues using 13Ca

20
Transfer without acquisition

21
Side chain Assignment

22
13C Chemical shift as a tool for Assignment

23
NMR structural characterization of the target protein
Approaches to the Structure Determination of Proteins For proteins of up to 30 kDa, use 13C/15N-labelling For proteins of higher molecular weight, use fractional deuteration and 13C/15N-labelling For proteins of 100 kDa and above, use selective protonation and 13C/15N-labelling

26
{ { { Distances ,, Vector orientation NOE H-bonds 3J couplings
Classical constraints for structure determination { NOE H-bonds Distances { ,, 3J couplings Chemical shifts Vector orientation { Residual dipolar couplings Cross Correlation effects

27
Protein structure and dihedral angles
Side chain Torsion angles.

28
NOE class distance [Å] upper bound [Å] very strong 2.3 2.5 strong 2.8
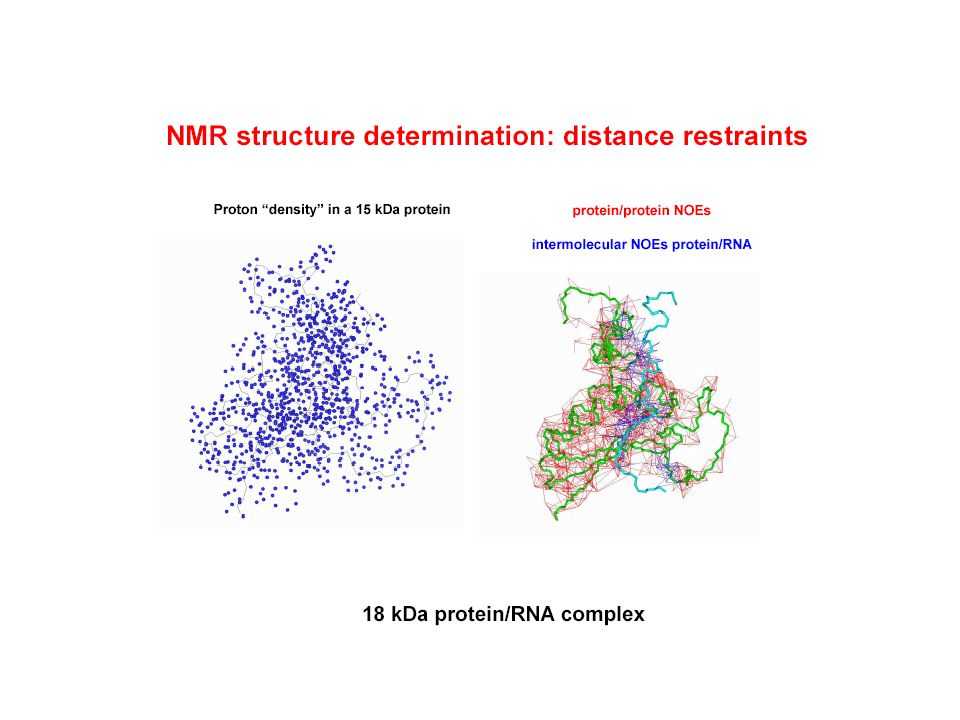
Contraints for Structure Calculation So far, the emphasis has been on identification of the observed signals in the spectra and their correlation with the amino acid protons giving rise to the signals. Afterwards, one has to extract the data which are relevant for the structure. Of special importance in this respect are proton-proton distances, which can be estimated from the signal intensities in the 2D NOESY, 3D 15N-NOESY-HSQC and 3D 13C-NOESY-HSQC spectra . Signal intensity depends on the distance r between two nuclei i and j, according to: NOEij ~ 1/rij6 Distances are derived from the spectra after calibration against NOE signals for known distances (such as distances in elements of secondary structure) and grouped into a few classes. An upper and a lower bound of distance is assigned to each class. The lower bound is often set to the sum of the van der Waals radii of the two protons. NOE class distance [Å] upper bound [Å] very strong 2.3 2.5 strong 2.8 3.1 medium 3.4 weak 3.5 3.9 very weak 4.2 5.0 In this procedure, all non-sequential signals which are visible in the NOESY spectra have to be assigned, the number of which easily exceeds 1000 in a medium-sized protein (ca. 120 amino acids). It is distinguished between cross peaks of protons no more than five amino acids apart in the protein sequence (medium range NOE's) and those which are more than five amino acids apart (long range NOE's). The former are mainly indicative of the protein backbone conformation and are used for secondary structure determination, whereas the latter are an expression of the global structure of the protein and therefore contain the main information used for tertiary structure calculation. In addition to interproton distances the phi-dihedral angles of the protein backbone can be determined from a COSY spectrum or a HNCA-J spectrum (a variant of the HNCA spectrum, from which the coupling constants of the N-Calpha bonds can be determined). Dihedral angles are connected with the coupling constants via the Karplus equation .
![NOE class distance [Å] upper bound [Å] very strong strong 2.8](http://slideplayer.com/slide/2449896/8/images/28/NOE+class+distance+%5B%C3%85%5D+upper+bound+%5B%C3%85%5D+very+strong+strong+2.8.jpg "Contraints for Structure Calculation. So far, the emphasis has been on identification of the observed signals in the spectra and their correlation with the amino acid protons giving rise to the signals. Afterwards, one has to extract the data which are relevant for the structure. Of special importance in this respect are proton-proton distances, which can be estimated from the signal intensities in the 2D NOESY, 3D 15N-NOESY-HSQC and 3D 13C-NOESY-HSQC spectra . Signal intensity depends on the distance r between two nuclei i and j, according to: NOEij ~ 1/rij6. Distances are derived from the spectra after calibration against NOE signals for known distances (such as distances in elements of secondary structure) and grouped into a few classes. An upper and a lower bound of distance is assigned to each class. The lower bound is often set to the sum of the van der Waals radii of the two protons. NOE class. distance [Å] upper bound [Å] very strong strong medium weak very weak In this procedure, all non-sequential signals which are visible in the NOESY spectra have to be assigned, the number of which easily exceeds 1000 in a medium-sized protein (ca. 120 amino acids). It is distinguished between cross peaks of protons no more than five amino acids apart in the protein sequence (medium range NOE s) and those which are more than five amino acids apart (long range NOE s). The former are mainly indicative of the protein backbone conformation and are used for secondary structure determination, whereas the latter are an expression of the global structure of the protein and therefore contain the main information used for tertiary structure calculation. In addition to interproton distances the phi-dihedral angles of the protein backbone can be determined from a COSY spectrum or a HNCA-J spectrum (a variant of the HNCA spectrum, from which the coupling constants of the N-Calpha bonds can be determined). Dihedral angles are connected with the coupling constants via the Karplus equation .")
29
Protein structure and dihedral angles
Side chain Torsion angles.

30
as pseudopotential to calculate the velocity
Calculation of 3D protein and nucleic acid structures The program DYANA Simulated annealing combined with molecular dynamics in torsion angle space Numerical solution of the classical mechanical Lagrange equations of motion with torsion angles as generalized internal coordinates The NMR constraints are used as pseudopotential to calculate the velocity A temperature bath to cross barriers between local minima is cooled down slowly from its initial high temperature The target function represents the potential energy of the system + other constraint contributions Güntert P., Mumenthaler C., Wüthrich K., J.Mol. Biol., 1997

31
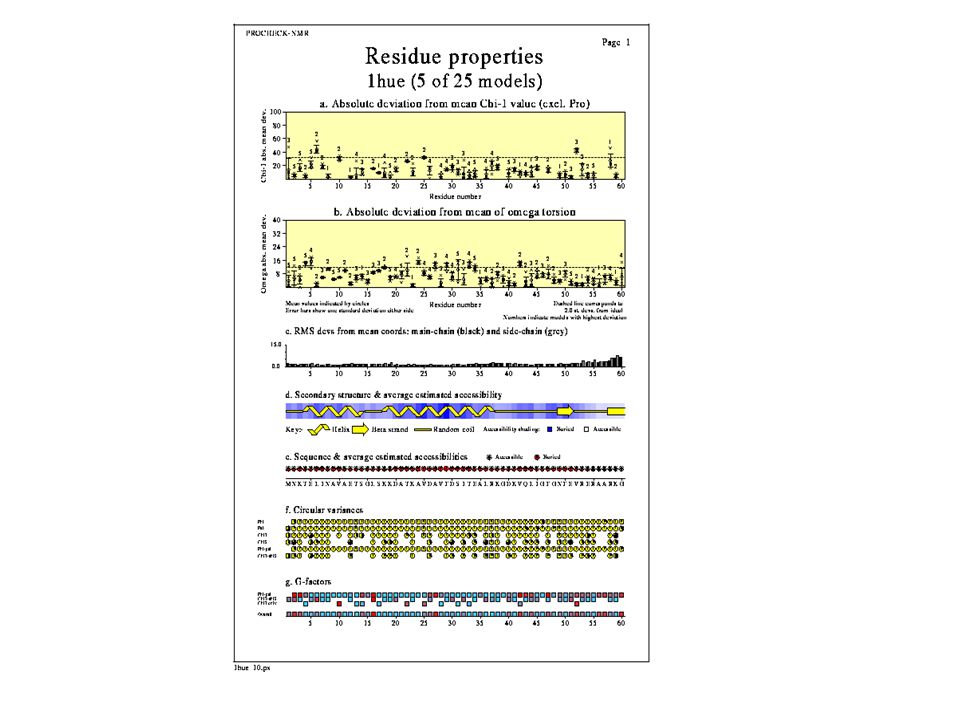
Structure quality through PROCHECK
Covalent geometry Torsion angles Chirality Planarity Precision Restraint violations Results are presented as plots suitable for publication Laskowski R A, MacArthur M W, Moss D S & Thornton J M (1993). J. Appl. Cryst., 26,
. J. Appl. Cryst., 26,")
32
{ { { Distances ,, Vector orientation NOE H-bonds 3J couplings
Classical constraints for structure determination { NOE H-bonds Distances { ,, 3J couplings Chemical shifts Vector orientation { Residual dipolar couplings Cross Correlation effects

33
Strategies for Sequential Assignment
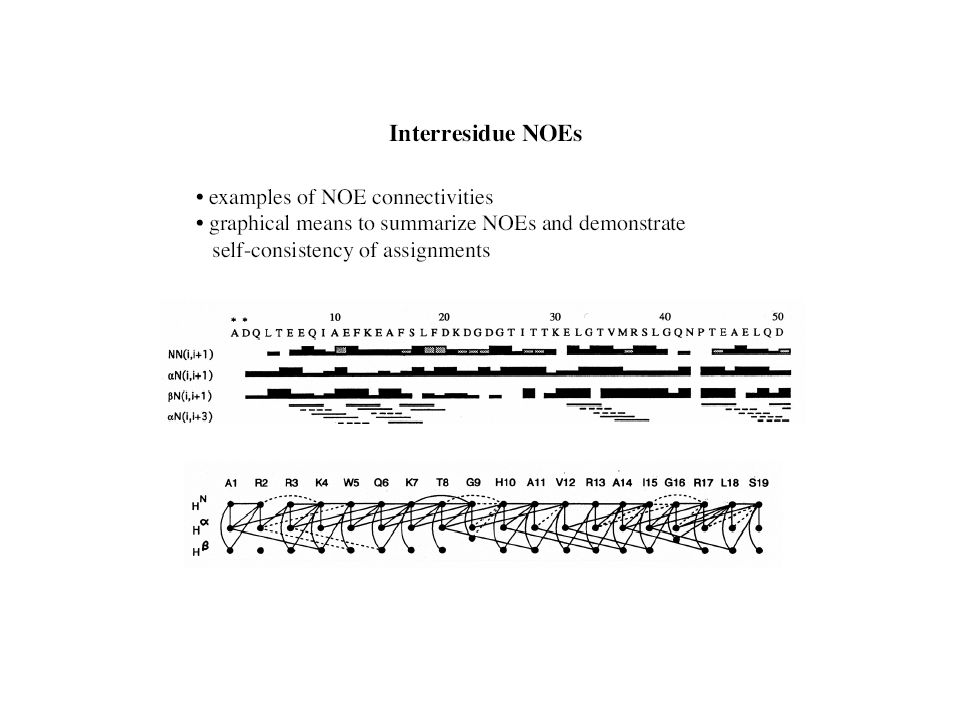
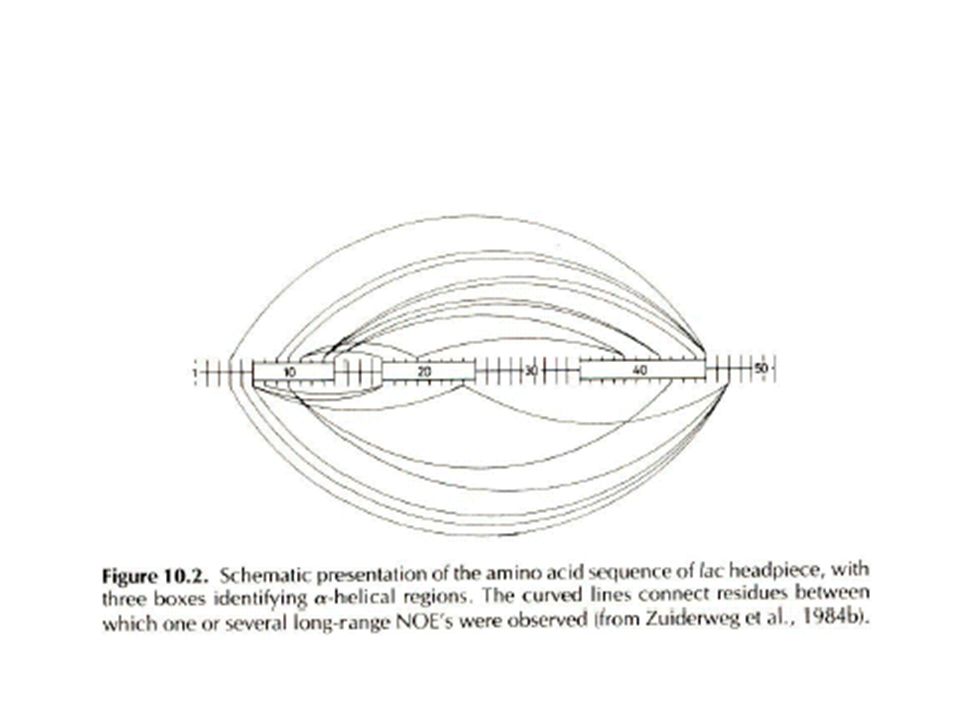
Using this cyclic procedure of alternatively connecting intraresidual TOCSY with interresidual NOESY cross peaks one can walk - ideally - along the entire length of the protein. Problem: there are a few proline residues in most proteins. Problem: there are a number of additional short proton proton distances which can occur as a result of certain elements of secondary structure. The general work of Wuthrich and co-workers identified a whole range of secondary specific short proton proton distances that are summarized here:

34
Strategies for Sequential Assignment
Here are a number of characteristic distances that connect the two strands of a b-sheet; short enough to appear as cross peaks in a NOESY spectrum. These are a- a, amide- a and amide-amide distances b-sheet specific NOEs in red and simple sequential NOEs in green. Other regular elements of secondary structure, e.g. different types of -turns, 3-10 helices and parallel b-strands, are characterized by similar patterns of short distances involving backbone protons.

35
Calculation of Tertiary Structure
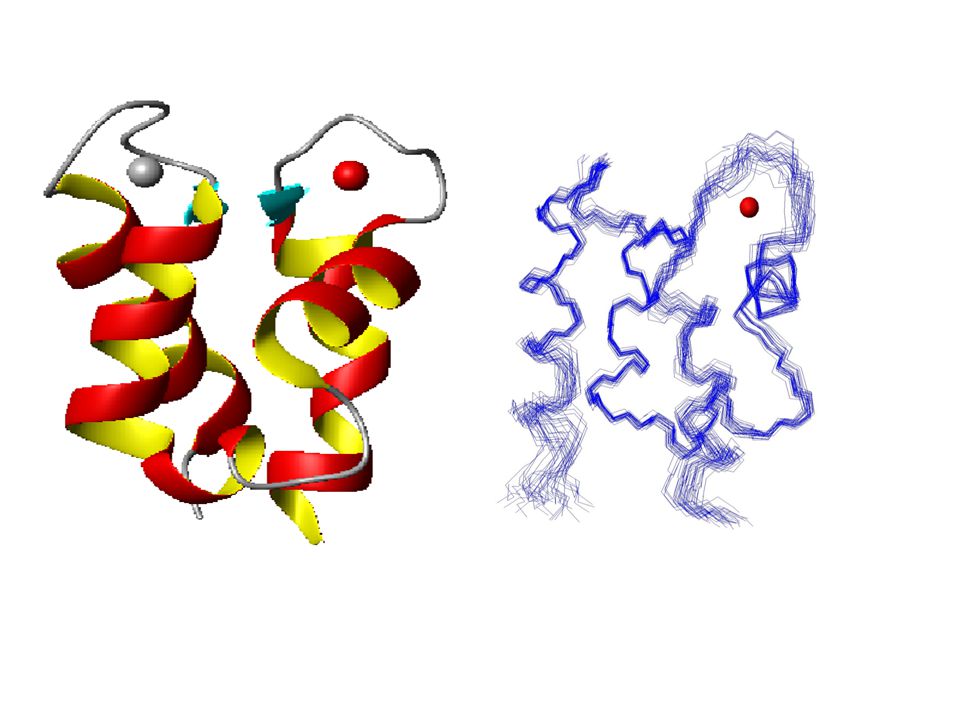
Results - The Structure Family After the structural calculations a family of structures is obtained instead of an exactly defined structure. This family spans out a relatively narrow conformational space. Therefore, the quality of a NMR structure can be defined by the mean deviation of each structure from this family (RMSD) from an energy minimized mean structure which has to be calculated previously. The smaller the deviation from this mean structure the narrower the conformational space. Another definition of RMSD is to compare pairwise the structures of a family and calculate the mean of these deviations. The RMSD is different for different parts of the protein structure: Regions with flexible structure or without secondary structure (loops) show a larger deviation than those with rigid and well defined secondary structure. This higher RMSD in loops results in first instance from the smaller number of distance constraints for these parts of the protein structure. Additionally it can originate from real flexibility, but this diagnosis can only be confirmed by measuring the relaxation times for the protein. A result of a structure calculation is shown here:
 from an energy minimized mean structure which has to be calculated previously. The smaller the deviation from this mean structure the narrower the conformational space. Another definition of RMSD is to compare pairwise the structures of a family and calculate the mean of these deviations. The RMSD is different for different parts of the protein structure: Regions with flexible structure or without secondary structure (loops) show a larger deviation than those with rigid and well defined secondary structure. This higher RMSD in loops results in first instance from the smaller number of distance constraints for these parts of the protein structure. Additionally it can originate from real flexibility, but this diagnosis can only be confirmed by measuring the relaxation times for the protein. A result of a structure calculation is shown here:")
36
Calculation of Tertiary Structure

37
Calculation of Tertiary Structure
The idea of computer-aided structure calculation is to convert distance- and torsion-angle-data (constraints) into a visible structure. However, the experimentally determined distances and torsion angles by themselves are not sufficient to fully characterize a protein structure, as they are based on a limited number of proton-proton distances. Only the knowledge of empirical input data, such as bond lengths of all covalently attached atoms and bond angles, enables a reasonably exact structure determination.
 into a visible structure. However, the experimentally determined distances and torsion angles by themselves are not sufficient to fully characterize a protein structure, as they are based on a limited number of proton-proton distances. Only the knowledge of empirical input data, such as bond lengths of all covalently attached atoms and bond angles, enables a reasonably exact structure determination.")
38
Calculation of Tertiary Structure
For this purpose, a randomly folded starting structure is calculated from the empirical data and the known amino acid sequence. The computer program then tries to fold the starting structure in such a way, that the experimentally determined interproton distances are satisfied by the calculated structures. In order to achieve this, each known parameter is assigned an energy potential, which will give minimal energy if the calculated distance or angle coincides with its input value. The computer program tries to calculate a structure with a possibly small overall energy.

39
Calculation of Tertiary Structure
Without the experimentally determined distance- and torsion angle-constraints from the NMR spectra, the protein molecule can adopt a huge number of conformations due to the free rotation around its chemical bonds (except for the peptide bond, of course). the N-Calpha bond and the Calpha-CO bond. All these possible conformations are summed up in the so-called conformational space. Therefore, it is important to identify as many constraints as possible from the NMR spectra to restrict the conformational space as much as possible, thus getting close to the true structure of the protein. In fact, the number of constraints employed is more important than the accuracy of proton-proton distances, so that the classification above is sufficiently precise.
. the N-Calpha bond and the Calpha-CO bond. All these possible conformations are summed up in the so-called conformational space. Therefore, it is important to identify as many constraints as possible from the NMR spectra to restrict the conformational space as much as possible, thus getting close to the true structure of the protein. In fact, the number of constraints employed is more important than the accuracy of proton-proton distances, so that the classification above is sufficiently precise.")
40
Calculation of Tertiary Structure
Energy Potentials A starting structure is needed for a molecular dynamics calculation, which is generated from all constraints for the molecular structure, such as bond-lengths and bond-angles. This starting structure may be any conformation such as an extended strand or an already folded protein. During the simulation, it develops in a potential field under the influence of various forces, in which all information about the protein is summarized. Two classes of energy terms are distinguished: Eempirical and Eeffective: V = Eempirical + Eeffective with: Eeffective = ENOE + Etorsion, and Eempirical = Ebond + Eangle + Edihedral + Evdw + Eelectr Eempirical contains all information about the primary structure of the protein and also data about topology and bonds in proteins in general. The contributions of covalent bonds, bond-angles and dihedral angles towards Eempirical are approximated by a harmonic function. In contrast, non-covalent van-der-Waals forces and electrostatic interactions are simulated by an inharmonic Lennard-Jones potential or Coulomb potential, respectively. Eeffective takes the experimentally determined constraints into account. Angle constraints are introduced by a harmonic function analogous to that for the dihedral angles. For distance constraints, the energy potential will be set to zero, if the corresponding distance is within the given limits. If it is outside these limits, a harmonic energy potential is used, which tries to push the value of the distance into the limits.

41
AGGFHRLIFTHWQDCSAAVHYLGGP………………..
Ogni aminoacido ha valori precisi di Distanze tra atomi. Libreria

45
Sequenza primaria Libreria di aminoacidi Legame peptidico 180° Distanze tra protoni intraresiduo Distanze tra protoni di residui consecutivi Distanze tra protoni di residui a breve distanza (i,i+4) Angoli diedri y j Distanze tra prootni a madio e lungo raggio
 Angoli diedri y j. Distanze tra prootni a madio e lungo raggio.")
47
Cosa Ottengo?

49
Target (penalty) Function
Ripeto il calcolo n volte Per Ogni struttura calcolo il valore della funzione penalità Seleziono le strutture che hanno il piu’ basso valore della funzione penalità

50
Target (penalty) Function
La somma delle violazioni dei vincoli sperimentali E’ di fatto, impossibile ottenere una struttura che sia in grado di rispettare perfettamente l’insieme di tutti i vincoli sperimentali che noi imponiamo Non ci sono solo I vincoli sperimentali, ma quelli derivanti dalla struttura di un polipeptide, (es: le violazioni di Van der Walls, gli angoli non permessi, etc..)
")
51
Target (penalty) Function
La somma delle violazioni dei vincoli sperimentali Considero “buone” tutte quelle strutture che hanno il più basso valore della funzione penalità

52
Famiglia di strutture Perché ne considero 20 e non una sola?
In principio, esistono infiniti modi (conformazioni) che permettono di ottenere una bassa funzione penalità. Non vi é nessun motivo per sceglierne una piuttosto che un altra In linea di principio, la conformazione a piu’ bassa funzione penalità é considerabile “la migliore”, ma tutte le altre che hanno valore molto simile sono ugualmente valide Quindi, preferisco prendere in considerazione un numero fisso di conformazioni (20, o 30) che hanno la piu’ bassa penalità e vedere quanto esse sono simili tra loro
 che permettono di ottenere una bassa funzione penalità. Non vi é nessun motivo per sceglierne una piuttosto che un altra. In linea di principio, la conformazione a piu’ bassa funzione penalità é considerabile la migliore , ma tutte le altre che hanno valore molto simile sono ugualmente valide. Quindi, preferisco prendere in considerazione un numero fisso di conformazioni (20, o 30) che hanno la piu’ bassa penalità e vedere quanto esse sono simili tra loro.")
53
Famiglia di strutture RMSD
Se le strutture sono molto simili tra loro significa che tutte le conformazioni che ho considerato sono molto simili. Avro’ una struttura accurata

54
Famiglia di strutture RMSD
Se le strutture sono molto diverse tra loro significa che devo considerare come ugualmente “buone” conformazioni molto diverse. Avro’ una struttura molto poco accurata

58
Solution structure of oxidized and reduced Cytochrome c
Cyt c oxidized Cyt c reduced Banci, Bertini, Bren, Gray, Sompornpisut, Turano, Biochemistry, 1997 Baistrocchi, Banci, Bertini, Turano, Bren, Gray, Biochemistry, 1996

59
Active site channel of Reduced Monomeric Q133 Copper Zinc Superoxide dismutase
Reduced Q133M2SOD Oxidized human SOD

60
Structure of Ce3+ substituted Calbindin D9k
20 40 60 80 0.0 0.2 0.4 0.6 0.8 1.0 1.2 1.4 1.6 1.8 2.0 2.2 2.4 2.6 Paramagnetic structure Diamagnetic structure RMSD backbone Residue Number risultato Bertini, Donaire, Jiménez, Luchinat, Parigi, Piccioli, Poggi, J.Biomol. NMR, 2001,21,85-98

62
Stucture Calculation Structure Validation Structure Visualisation

63
Structure validation

64
RMSD How to overlay structures -entire -fragments - bb & all heavy atoms

65
RMSD

66
RMSD

67
Stereoviews

68
Average pairwise rmsd values calculated for backbone heavy atoms N, Ca, and C' ("Backbone"), all heavy atoms ("All heavy"), and backbone heavy atoms N, Ca, and C' together with heavy atoms of the best defined side-chains. The values for the DYANA structures are represented by red bars, and values for molecular dynamics refined (MDR) and energy-minimization refined (EMR) structures are displayed in green and gray, respectively. Standard deviations are indicated by vertical error bars.
 and energy-minimization refined (EMR) structures are displayed in green and gray, respectively. Standard deviations are indicated by vertical error bars..")
69
Target function analysis
Violations < threshold Energy terms

70
70

71
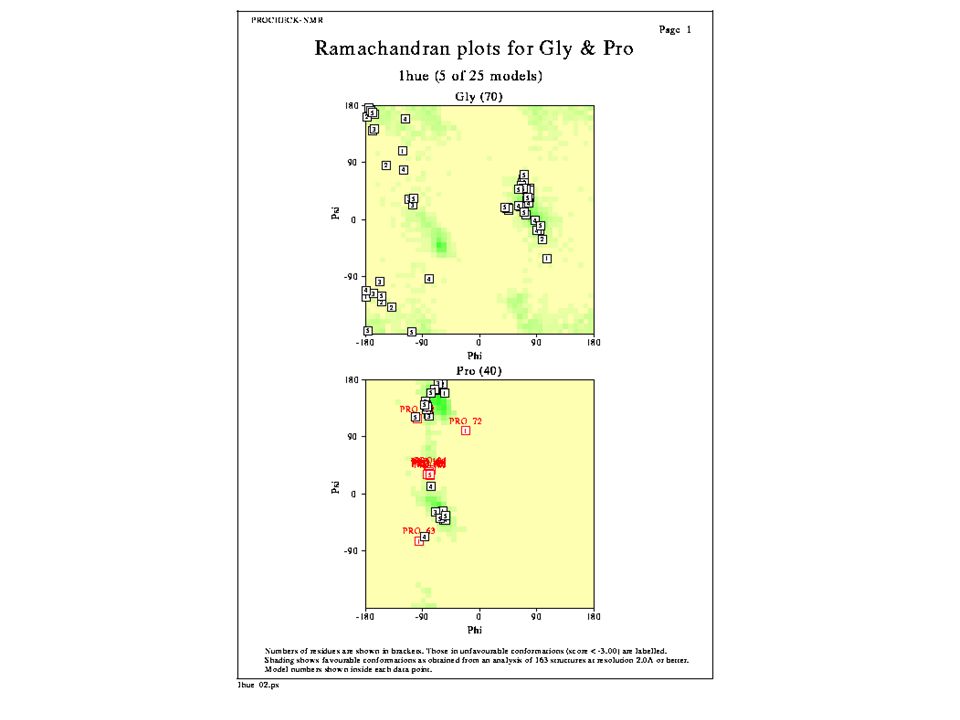
PROCHECK The PROCHECK suite of programs provides a detailed check on the stereochemistry of a protein structure. Its outputs comprise a number of plots in PostScript format and a comprehensive residue-by-residue listing. These give an assessment of both the overall quality of the structure, as compared with well-refined structures of the same resolution, and also highlight regions that may need further investigation. The PROCHECK programs are useful for assessing the quality not only of protein structures in the process of being solved, but also of existing structures and those being modelled on known structures.

72
PROCHECK & PROCHECK-NMR
The only input required for PROCHECK is the PDB file holding the coordinates of the structure of interest. For NMR structures, each model in the ensemble should be separated by the correct MODEL and ENDMDL records

81
Model-by-model secondary structures

83
Plots of PROCHECK G-factor (all dihedrals) vs
Plots of PROCHECK G-factor (all dihedrals) vs. MOLPROBITY Z-scores (1) calculated for x-ray crystal structures (circles) deposited in the PDB during colored according to resolution [green: high-resolution (£ 1.8 Å); gray: medium-resolution (1.8 – 2.5 Å); red: low-resolution (2.5– 3.5 Å)] and NMR structures (yellow triangles) deposited in the PDB during by other leading NMR groups.
 vs. MOLPROBITY Z-scores (1) calculated for x-ray crystal structures (circles) deposited in the PDB during colored according to resolution [green: high-resolution (£ 1.8 Å); gray: medium-resolution (1.8 – 2.5 Å); red: low-resolution (2.5– 3.5 Å)] and NMR structures (yellow triangles) deposited in the PDB during by other leading NMR groups.")
Similar presentations


 structures look like the NMR ensemble inclusion of hydrogen coordinates.>")
 first edition: p. 493-502.>")


![. Protein Structure Prediction [Based on Structural Bioinformatics, section VII]](/16/5116302/big_thumb.jpg ". Protein Structure Prediction [Based on Structural Bioinformatics, section VII]>")


>")