Download presentation
Presentation is loading. Please wait.

1
The critical concept of scale
“…the problem of relating phenomena across scales is the central problem in biology and in all of science”. Simon Levin, 1992. Increasing technological sophistication now allows observations to be made across microscopic to global scales. Consequently, as there is a need to integrate our observations, there is also a need to develop and use a set of common terms related to scale. This lecture presents several of ways scale is conceptualized and applied in biogeographic research. Scales over which humans observe the world

2
Why be concerned about scale?
Characterization of biogeographic pattern involves: Scale of the phenomena Scale of its detection through observation Scale at which a pattern is statistically analyzed and communicated. Tuna example Birds – temperature or calendar dates? Flesh out examples more

3
Cartographic scale From Lewis Carroll’s Alice in Wonderland

4
Cartographic scale

5
Representative fractions
1:250,000 1:50,000 1:2500

6
Cartographic scale Assuming that you have two maps of the same paper size, which of the two representative fractions shows the most detail and the smaller surface area? 1:50,000 1:10,000

7
Large versus small cartographic scale
Large cartographic scale Small cartographic scale

8
Absolute and relative scaling
Absolute scale Distance is physical, measureable Relative scale Distance is not a physical distance but a more intangible construct, often similarity

12
Operational scale Refers to the spatial and temporal dimensions of an object or a process

13
Operational scale Operational scale may not be independent of our observations, and in fact may be very dependent upon them. Operational scale can be constrained by our technology and our senses. How did we define the world before our understanding of astronomy, or biology?

15
And so these men of Indostan
Disputed loud and long, Each in his own opinion Exceeding stiff and strong, Though each was partly in the right, And all were in the wrong! John Godfrey Saxe 1878

16
Decreasing (finer) grain, extent is constant
Ecological scaling Extent: spatial (or temporal) dimension of an object or process observed or analyzed Grain: level of spatial (or temporal) resolution at which an object or process has been measured or observed. Increasing extent, grain is held constant
 dimension of an object or process observed or analyzed. Grain: level of spatial (or temporal) resolution at which an object or process has been measured or observed. Increasing extent, grain is held constant.")
17
Which map shows more grain?
17

18
How much grain is shown can be a subjective decision
How much grain is shown can be a subjective decision. Cartographic scale and ecological scale are often intertwined.

19
Haggett’s scale coverage problem
Nature has an immense extent and a fine grain

20
Haggett’s scale coverage problem
To make even small descriptions of it, we have to sample Sampling requires sacrificing grain for extent or extent for grain.

21
Fallacies of scale Individualistic fallacy: extrapolating to the broad scale based on observations conducted at small, local scales Ecological fallacy: making local-scale characterizations based on broad-scale observations. To an extent, humans have to commit the individualistic fallacy and the ecological fallacy to certain extents in order to navigate the world

22
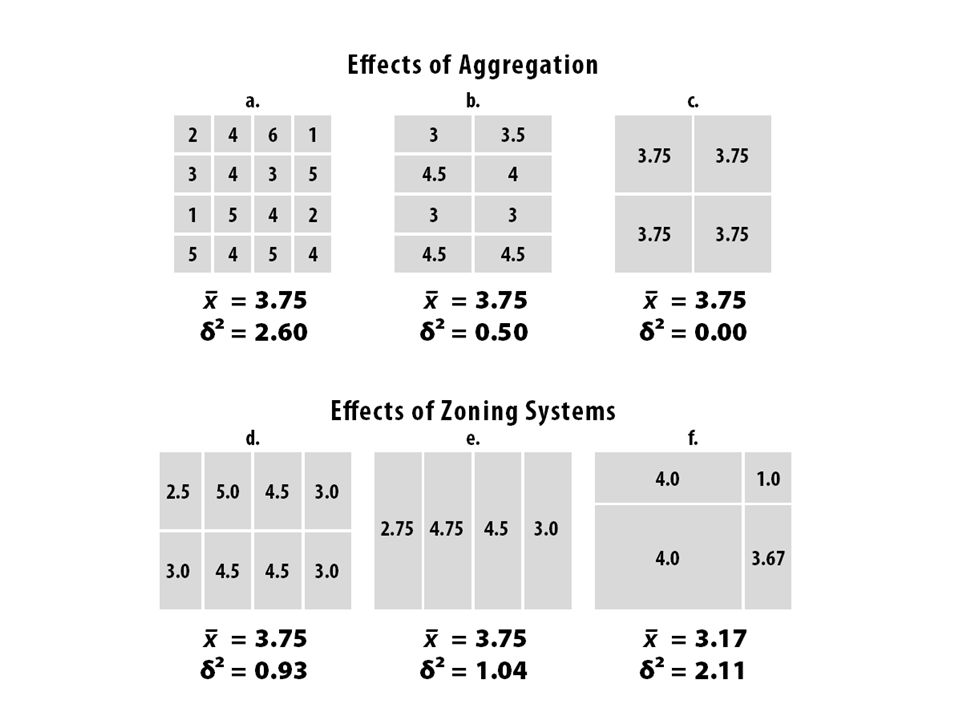
Modifiable areal unit problem
Two components Aggregation problem Zoning problem

24
Hierarchy theory Landscapes organized into spatial and temporal domains of shaping processes Scale hierarchy is a system of vertical interconnections Higher levels constrain the lower levels Slow large at top; fast, local at bottom Highest level variable: constant Lowest level variable: noise

25
Hierarchy theory

26
Non-hierarchical controls also relevant
Examples: Tilt, insolation, climate, photosynthesis: hierarchical Invasive species, dispersal, natural selection: non- hierarchical Sunlight, climate, herbivory, photosynthesis: hierarchical Invasive species, dispersal, natural selection: non: hierarchical

27
Cartesian scale Hierarchy theory exemplifies a Cartesian scaling of the world Scales are imposed Not necessarily “true” scales Often tied to XYZ coordinate system Space as a container

28
Constructivist scale Scale emerges out the interactions of entities
Scales are produced or constructed There is no fixed and unchanging hierarchy of scales.

29
Constructivist scale Boundaries in space and frequencies of environmental exposures shaped by organisms not just our observation of them.

30
Evolutionary scaling Scaling is a practice related to adaptation

31
Scale and scaling are practiced by all forms of life
Are our observational scales relevant to the organism of interest? How do other organisms scale the world and how does it influence what they (and we) can know and act upon? Tuna example Birds – temperature or calendar dates? Flesh out examples more
 can know and act upon Tuna example. Birds – temperature or calendar dates Flesh out examples more.")
32
Rules for ecological scale for humans
Patterns are dependent upon the scale of observation The important explanatory variables change with scale. Statistical relationships may change as scale changes. Patterns are generated by processes acting over various temporal and spatial scales.

36
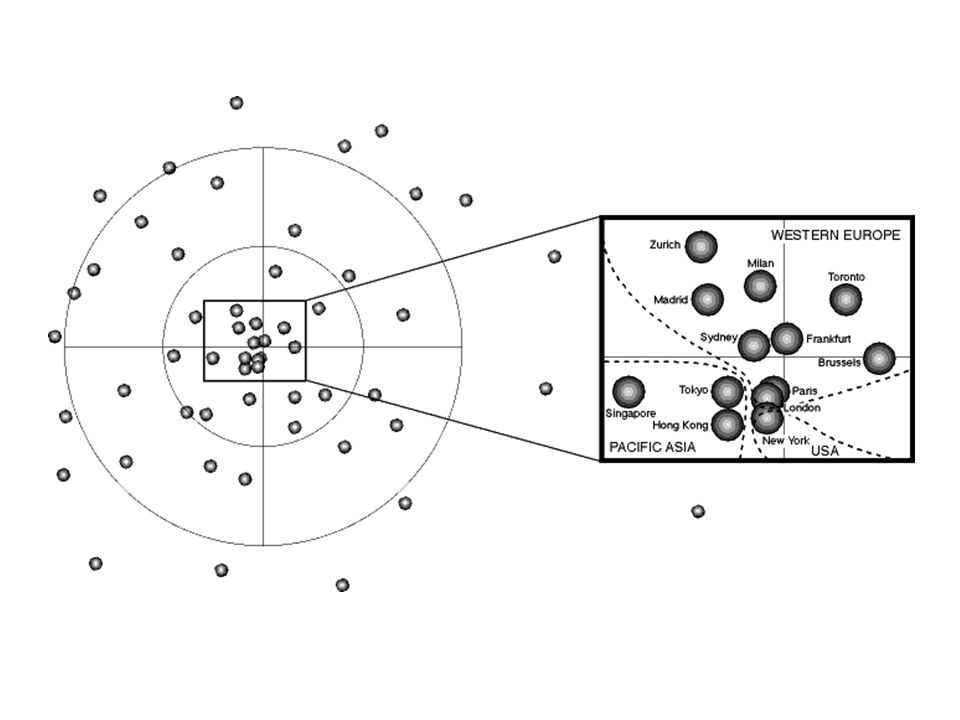
Scale dependence of the correlation between human population presence and vertebrate and plant species richness ECOLOGY LETTERS, 10 (1): 16-24; JAN 2007 Human presence is generally negatively related to species richness locally, but the relationship is positive at coarse scales. An increase in the strength of the latter correlation with increasing study resolution has been documented within studies, but it is not known whether such a scale dependence is present across different studies. We test this with data on the spatial co-occurrence of human beings and the species richness of plants and vertebrates from a continuum of scales. The correlation coefficient between human presence and species richness is positively related to study grain and extent. The correlation turns from positive to negative below a study grain of c. 1 km and below a study extent of c km(2). The broad-scale positive correlation between human presence and species richness suggests that people have preferentially settled and generally flourished in areas of high biodiversity and/or have contributed to it with species introductions and habitat dive! rsification. The scale dependency of the correlation between people and biodiversity's presence emphasizes the importance of the preservation of green areas in densely populated regions.
: 16-24; JAN Human presence is generally negatively related to species richness locally, but the relationship is positive at coarse scales. An increase in the strength of the latter correlation with increasing study resolution has been documented within studies, but it is not known whether such a scale dependence is present across different studies. We test this with data on the spatial co-occurrence of human beings and the species richness of plants and vertebrates from a continuum of scales. The correlation coefficient between human presence and species richness is positively related to study grain and extent. The correlation turns from positive to negative below a study grain of c. 1 km and below a study extent of c km(2). The broad-scale positive correlation between human presence and species richness suggests that people have preferentially settled and generally flourished in areas of high biodiversity and/or have contributed to it with species introductions and habitat dive! rsification. The scale dependency of the correlation between people and biodiversity s presence emphasizes the importance of the preservation of green areas in densely populated regions.")
37
Rules for ecological scale
5. Scale can be used to justify or refute certain management practices and ideas about nature

38
Example: Successional response to clearcut logging
Grain and extent of post-logging sampling determine criteria for judging response Large extent, fine grain: criteria for recovery not likely to be met Small extent, coarse grain: criteria for recovery easier to meet

39
Rules for ecological scale
6. The scales experienced by an organism define what it sees and responds to. For example, what might constitute a patchy resource to an insect, could be perceived by a larger vertebrate as homogeneous.

40
How to work with scale There is no single correct scale or level at which to describe a system. This does not mean that all scales serve equally well or that there are not rules or guidelines.

41
How to work with scale Be aware of the different types of scaling and their relatedness Don’t be too anthropocentric Employ sampling designs and methods that are sensitive to multiple scales Nested observations Power laws Fractals Networks

42
Power laws Summarize how relationships change with changes in scale
Often expressed on a log-log plot. Y = constant (X)n Similar slopes are thought to have similar structuring processes (n = slope) Examples Species-area relationships (left) Animal metabolic rates and body mass (next slide) However, a valid criticism of power laws is that they often lack an explanatory process S=cAz Metabolic rate = constant (mass).75
n. Similar slopes are thought to have similar structuring processes (n = slope) Examples. Species-area relationships (left) Animal metabolic rates and body mass (next slide) However, a valid criticism of power laws is that they often lack an explanatory process. S=cAz. Metabolic rate = constant (mass).75.")
43
Metabolic rate and body mass

45
Fractals A fractal pattern appears the same across all scales. It is scale invariant. The relationship between size of box and pattern in it is constant. Fractals follow their own power law relating how number of boxes needed to cover a shape change in relation to their size. A fractal is a pattern that can be split into parts, each of which is a reduced-size copy of the whole, a property called self-similarity.

46
High school dating network

47
Networks Can represent relationships at a variety of scales at once.
Structural properties of networks provide means of understanding how they work. Nodes and links Degree centrality and betweenness Weak versus strong links Directional versus non-directional graphs

48
Random and scale free networks
A few nodes highly connected, most are not. If this pattern holds for all observations, the distribution is said to “scale” as a power law and be “scale-free”.

49
Coral dispersal on GBR is scale-free network

50
Spatial autocorrelation
A method to summarize how patterns change with scale

Similar presentations


 – Hierarchy: perspectives for ecological complexity –Delcourt et al. (1983) – Quaternary.>")


 Sim February 7 th, 2005.>")


