Download presentation
Presentation is loading. Please wait.

1
The Future of Agriculture: Economic Outlook
Robert L. Thompson Professor Emeritus, University of Illinois and Visiting Scholar, Johns Hopkins University School of Advanced International Studies Februarty12, 2013

2
Outline Current situation and near-term outlook
The farm bill and the fiscal cliffs Longer-term prospects

3
Economic Growth The world economy grew 2.3% in 2012, with more than half coming from developing countries (5.1% vs. 1.3% in developed countries). Developed countries may do well to achieve 1.3% growth in 2013 (3.3% annual growth by 2015), while developing countries likely to grow at least 5.1% in 2012 (5.8% annually by 2015). The developing countries will continue to be engine pulling the global economy out of its slump. *Source: World Bank. Global Economic Prospects, Jan
, while developing countries likely to grow at least 5.1% in 2012 (5.8% annually by 2015). The developing countries will continue to be engine pulling the global economy out of its slump. *Source: World Bank. Global Economic Prospects, Jan")
5
Snapshot of U.S. Agriculture
Worst drought in Midwest since 1930s gave record high corn, soybean and animal feed prices; poultry & livestock sectors severely stressed by feed costs. Some cut back in ethanol production (and therefore DDGs) due to high price of corn Second highest real net farm income ever (thanks not least to crop insurance). Excellent year for ag exports in general (but not for corn)
 due to high price of corn. Second highest real net farm income ever (thanks not least to crop insurance). Excellent year for ag exports in general (but not for corn)")
6
Snapshot (continued) Modest increase in food prices.
Lower meat prices as herds/flocks reduced; higher necessary to rebuild. Record low debt-equity and debt-assets ratios for the sector Record low interest rates Farm land market bubble? (mostly bought with cash)
")
7
Towards the 2013 Farm Bill

8
USDA Expenditures, $ billions
Program 2005 2011 Farm Commodity Programs 39.6 22.9 Foreign Programs 5.3 2.0 Rural Development 14.3 4.2 Food and Nutrition 51.0 105.3 Food Safety 0.9 1.0 Natural Resources & Environ. 8.7 11.8 Marketing & Regulation 1.8 2.7 Research, Education & Econ. 3.3 USDA administrative & other 0.5 0.7 Total 124.9 153.8

9
USDA Spending by Category
Other – 15% Commodities – 23% Other – 12% Commodities – 11% Conservation – 8% Nutrition – 62% Nutrition – 68% Source: Congressional Budget Office

10
Contents of 2012 Farm Bill Eliminate direct payments
Revenue insurance approach Replaced old dairy support program with new dairy margin protection (net revenue) and market stabilization programs. A new cotton crop insurance program (due to Brazil’s WTO cotton case) Increased crop insurance options
 and market stabilization programs. A new cotton crop insurance program (due to Brazil’s WTO cotton case) Increased crop insurance options.")
11
More Contents of 2012 Farm Bill
Disaster assistance for livestock, tree and fruit producers for drought damage. Consolidated and streamlined some conservation programs House reduced food stamp (SNAP) cost Reauthorized 37 mainly energy, rural development, and horticulture programs whose funding expired 9/30/12.
 cost. Reauthorized 37 mainly energy, rural development, and horticulture programs whose funding expired 9/30/12.")
12
2013 Farm Bill Environment Current law expires Sept. 30, 2013.
Nothing in Senate and House 2012 farm bills carries over, so have to start again. Thad Cochrane’s replacing Pat Roberts as ranking Republican on Senate Ag Committee will change emphasis of Title I. CBO baseline in March likely to show less money available for farm policy. Senate & House farm bills contained $24-35 billion in cuts for deficit reduction. Now?

13
Redundancies in Farm Policy
There are overlaps and redundancies among the five components of present U.S. farm policy: Direct payments Counter-cyclical payments (with price or revenue trigger) Loan deficiency payments (“marketing loan”) Subsidy to crop insurance Disaster payments Could all programs be rolled into one?
 Loan deficiency payments ( marketing loan ) Subsidy to crop insurance. Disaster payments. Could all programs be rolled into one")
14
Why Government Involvement in Ag?
U.S. agriculture is a highly capital- intensive sector*, principally debt financed, whose revenue is the product of two random variables, price times yield, over which the farmer has no control. The “real” problem of agriculture is the risk that a catastrophic drop in revenue due to a drop in commodity prices, yield or some combination of the two, makes it impossible to service the farm’s debt. *Investment in machinery, equipment and buildings per person employed is more than twice that of the U.S. manufacturing sector.

15
Two Fundamental Philosophical Questions Re Future Farm Policy
Of the public investments allocated to agriculture and rural areas, how much should go to farmers as individuals & how much should be invested for the greater good of agriculture and the rural areas? Of the fraction that goes to farmers as individuals, how much should be linked to the production of specific commodities & how much should be decoupled from what the farmer produces?

16
The Fiscal Cliffs

17
Federal Budget Deficit, FY12

18
Deficit Reduction Multiple bipartisan task forces, which proposed various combinations of budget reductions and tax increases, all called for lower farm program expenditures. Senate & House ag committee leaders offered the Joint Select Committee on Deficit Reduction proposed changes in farm policy to reduce cost by $23 billion. Sequestration was scheduled to go into effect 1/1/13 (the first “fiscal cliff”).
.")
19
American Taxpayer Relief Act of 2012 (Jan. 2, 2013)
Permanently extended lower tax rates except for high income taxpayers. Permanently revised Alternative Minimum Tax (AMT) and indexed it to inflation. Extended biodiesel blenders tax credit through FY 2013 and made it retroactive for FY 2012. Made estate tax exemption of $5 ($10) million permanent for individual (family) estates with top rate of 40%.
 and indexed it to inflation. Extended biodiesel blenders tax credit through FY 2013 and made it retroactive for FY Made estate tax exemption of $5 ($10) million permanent for individual (family) estates with top rate of 40%.")
20
American Taxpayer Relief Act of 2012 (Jan. 2, 2013)
Section 179 deduction of capital inputs up to $500K and extended bonus depreciation through 2013. Extended 2008 Farm Bill through FY2013. Delayed sequestration from Jan. 2 to March 1.

21
Debt Limit Avoided for Now
On Feb 4th President signed the “No Budget, No Pay Act of 2013:” On May 19th the debt limit will be raised by an amount “necessary to fund commitment incurred by the Federal Government that required payment.” (perhaps $450 billion). That kicks the can down the road until August, when we’ll likely hit that debt limit. If Congress doesn’t pass a Federal budget by Apr. 15th, they won’t get paid until they do. Continuing Resolution expires March 27th.
. That kicks the can down the road until August, when we’ll likely hit that debt limit. If Congress doesn’t pass a Federal budget by Apr. 15th, they won’t get paid until they do. Continuing Resolution expires March 27th.")
22
Sequestration Automatic across-the-board* spending cuts authorized in Budget Control Act in August 2011 after Congress failed to agree on a deficit reduction plan. $1.2 trillion reduction over 10 years $85.3 spending will be cut in remainder of FY 2013, starting March 1st. Such a big sudden drop in spending likely put U.S. economy back into recession. *Exemptions: Social Security, Medicaid, food stamps (SNAP) (but not WIC), payments on existing CRP contracts; military personnel.
 (but not WIC), payments on existing CRP contracts; military personnel.")
23
CBO Budget Baseline, 2013-2022 (February 2013)
Reduction in deficit to $845 billion next year assumes that sequestration occurs March 1st.

24
Questions How much budget savings must come from 2013 farm bill?
How to be split between nutrition programs & farm programs?

25
Longer-Term Prospects for U.S. Role in Global Agriculture

26
Projected Population Growth
Region 2012 2050 Change Percent World 7,058 9,624 +2,566 + 36 High Income 1,243 1,338 + 8 Low Income 5,814 8,286 +2,472 + 43 East & S.E. Asia 2,193 2,317 + 6 South Central Asia 1,823 2,565 + 41 Sub-Saharan Africa 902 2,092 +1,190 +132 Latin America/Carib 599 749 + 25 N. Africa & W. Asia 457 748 + 64 Source: Population Reference Bureau World Population Data Sheet.

27
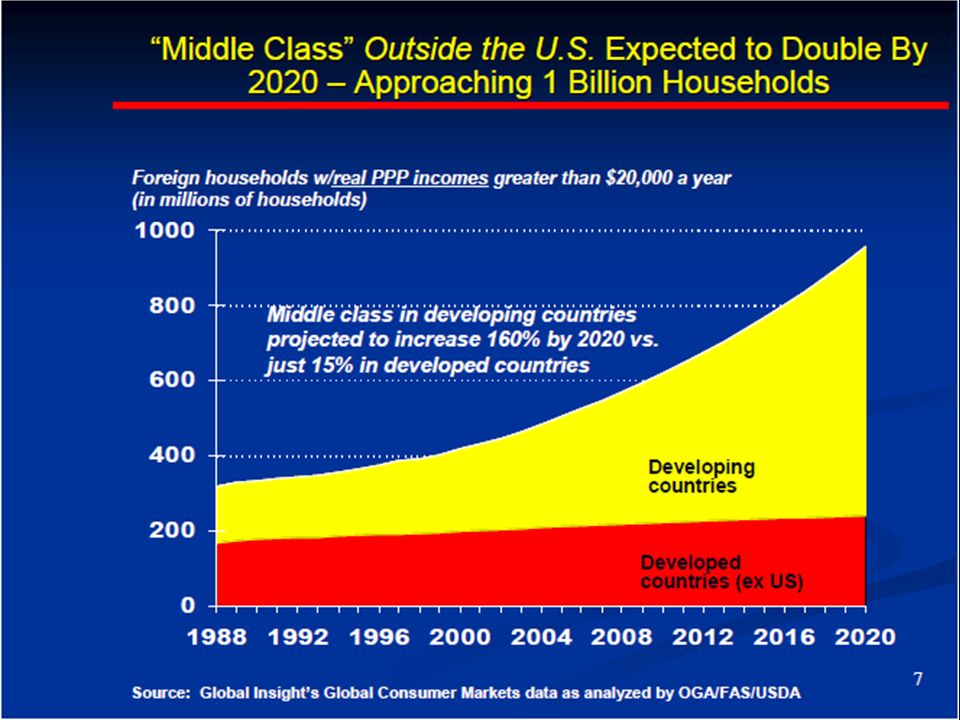
Dynamics of Food Demand Growth
1.4 billion people live on less that $1.25/day 1 billion cannot afford 1,800 calories per day. 2.6 billion people live on less than $2.00/day At $2.00 per day most hunger (calorie) problems solved, but 1 billion still suffer nutritional deficiencies. As their incomes rise from about $2 to $10 per day, people eat more meat, dairy products, eggs, edible oils, fruits & vegetables causing rapid growth in raw ag commodity demand. After about $10 per day, people buy more processing, services, packaging, variety, and luxury forms, but not more raw ag commodities.
 problems solved, but 1 billion still suffer nutritional deficiencies. As their incomes rise from about $2 to $10 per day, people eat more meat, dairy products, eggs, edible oils, fruits & vegetables causing rapid growth in raw ag commodity demand. After about $10 per day, people buy more processing, services, packaging, variety, and luxury forms, but not more raw ag commodities.")
29
Projected World Food Demand
World food demand to grow 70-80% by 2050 40% increase from world population growth – from 7.0 to 9.6 billion – almost all in developing countries 30-40% increase from broad-based economic growth and urbanization in low income countries How many presently low income consumers escape from poverty is the most important uncertainty re future global demand for food. Policies that accelerate broad-based economic growth in LDCs reduce hunger, but unleash rapid growth in demand for agricultural products.

30
Larger Fraction of Ag Production to Move Through Trade
Distribution of Arable Land Distribution of World Population With population growth, urbanization and broad-based economic development, many low-income countries’ food consumption will outstrip their production capacity, and they will become larger net importers.

31
The Land Constraint There is at most 12% more arable land available worldwide that isn’t presently forested or subject to erosion or desertification, and… Loss and degradation of many soils continues: Urbanization & infrastructure construction Nutrient mining Erosion Desertification Natural reserves Reforestation

32
The Land Constraint (cont’d.)
The area of land in farm production could be doubled… But only by massive destruction of forests and loss of wildlife habitat, biodiversity and carbon sequestration capacity The only environmentally sustainable alternative is to double productivity on the fertile, non-erodible soils already in crop production. Most available cropland is in remote areas of South America and Sub-Saharan Africa where infrastructure is minimal and soils are inferior in quality to many already in production.

33
Croplands of the Earth Interpretation: The darker the shading, the larger the percent of the land under that pixel that is in crops. Source: Center for Sustainability and the Global Environment (SAGE), University of Wisconsin.
![]()
34
Inherent Land Quality

35
Climate Constraints Source: International Institute for Applied Systems Analysis

36
Agriculturally Important Effects of Climate Change
Warming greater over land than over water and greatest at higher latitudes. Increases variability of precipitation Largest reduction in subtropics Largest increases in higher latitudes Increase under monsoons Increased frequency of extreme events, such as droughts and flooding.

37
Adaptations Will be Required Due to Global Climate Change
As all agro-ecosystems shift with climate change, need larger public and private investments in adaptive plant and animal breeding just to sustain present productivity levels. e.g. introduce more drought or heat tolerance. Change the mix of what crops are produced in a some geographic locations. Rely more on international trade.

38
Water--A Growing Constraint
Farmers account for 70% of the world’s fresh water use. With the rapid urbanization underway, cities will outbid agriculture for available fresh water. The world’s farmers, who are being called on to double food production, will have to do it using less fresh water than they are using today. i.e., they will have to more than double the “crop per drop,” the average productivity of the water they use. This will require investments in research to develop water saving technologies and to increase the drought tolerance and water use efficiency of the crop varieties being grown.

39
Need to Almost Double the Global Food System Productivity by 2050
Make presently unusable soils productive Increase genetic potential (of individual crops and/or farming system) (ditto for farm animals) Achieve as much of that potential as possible by: Improving nutrition of that crop Increasing water availability and control Reducing competition from weeds for water, nutrients and sunlight Reducing losses from disease and insects Reduce post-harvest losses
 (ditto for farm animals) Achieve as much of that potential as possible by: Improving nutrition of that crop. Increasing water availability and control. Reducing competition from weeds for water, nutrients and sunlight. Reducing losses from disease and insects. Reduce post-harvest losses.")
40
Long-Run Price Prospects
Since Malthus, prophets of doom have argued population growth will increase food demand faster than agricultural production can grow. Public and private sector investments in agricultural research have increased productivity faster than demand growth, with resulting 150- year downward trend in real price of grains. Need big increase in world food production by 2050 using less water and little more land than today and also produce biofuels feedstocks. Future world market price trends will depend on whether land and water productivity rise faster or slower than world demand grows.

41
U.S. Food Consumer Trends
Healthy eating Both aging & younger populations Want more fiber, whole grains; probiotics and less salt, sugar (esp. HFCS) , trans fats, saturated fats; cholesterol. Great recession led to frugality, but allow themselves small indulgences. Less eating out in restaurants; more food preparation at home.
 , trans fats, saturated fats; cholesterol. Great recession led to frugality, but allow themselves small indulgences. Less eating out in restaurants; more food preparation at home.")
42
More Consumer Trends Favor green, natural, pure, organic, sustainable, local, etc., but willingness to pay was challenged during recession. Want to know where their food comes from Rely on internet & social media for info Prone to accept misinformation Want convenience Want more info on labels and on restaurant menus.

43
Hot Food & Agricultural Issues
Enhance health & nutrition of Americans; reduce childhood obesity; alleviate hunger in U.S. & abroad; increase food stamps. Modernize food safety system; consolidate into one federal food safety agency? Climate change & other environmental priorities; reward farmers for carbon sequestration & reduction in green house gas (GHG) emissions.
 emissions.")
44
Hot Food & Agricultural Issues
Limit commodity support program payments per farmer Increase “energy security” via renewable energy, esp. 2nd generation biofuels. Enhance small scale, local and especially organic agriculture. Put agricultural development back into U.S. foreign aid

45
Other Hot Policy Issues
Increasing environmental regulations (EPA) Renewable energy, especially future of biofuels subsidies Animal welfare regulations Transport Policy (adequacy of infrastructure) Trade Policy Trans-Pacific Partnership (TPP)?
 Renewable energy, especially future of biofuels subsidies. Animal welfare regulations. Transport Policy (adequacy of infrastructure) Trade Policy. Trans-Pacific Partnership (TPP)")
46
Long-Term Environment
Climate change Energy prices—U.S to be self sufficient Weakening dollar Commodity price trend—up, down or on higher plateau.

47
Ag Trade-Weighted U.S. Dollar Exchange Rate, 1970-2012
Source: USDA/ERS.

48
U.S. GDP: Composition & Growth (Q4 2012)
Amount (trillions) % of GDP Growth Rate (Q4 2012) GDP 15.8 100.0 -0.14 Consumption 11.2 71.1 +1.52 Investment 2.1 13.2 -0.08 Government 3.1 19.3 -1.33 Net exports -0.6 -3.5 +0.25 Source: BEA
 % of GDP. Growth Rate. (Q4 2012) GDP Consumption Investment Government Net exports Source: BEA.")
Similar presentations


 13 th Annual Farmer Cooperatives Convention December 6-7, 2010 Economic.>")


