Download presentation
Presentation is loading. Please wait.

1
Chemistry 2100 Lecture 12

3
Purine/Pyrimidine Bases

4
adenosine monophosphate
9 adenine 5' 4' 1' 3' 2' b-N-glycoside ribose adenosine [a nucleoside] adenosine monophosphate [a nucleotide]

5
(- H2O)
")
6
(- H2O)
")
7
(- H2O)
")
8
(- H2O)
")
9
(- H2O)
")
10
(-H2O)
")
11
(-H2O)
")
12
(-H2O)
")
13
(-H2O)
")
14
(-H2O)
")
15
Hydrogen Bonding! FIGURE 8-11 Hydrogen-bonding patterns in the base pairs defined by Watson and Crick. Here as elsewhere, hydrogen bonds are represented by three blue lines.

16
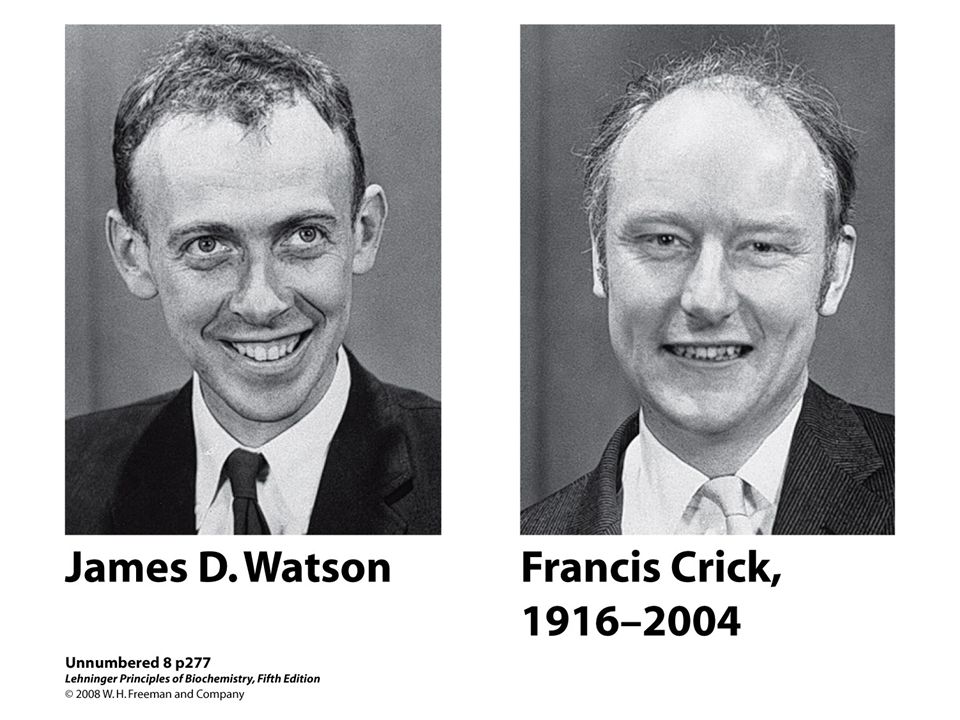
Discovery of DNA Structure
One of the most important discoveries in biology Why is this important "This structure has novel features which are of considerable biological interest“ --- Watson and Crick, Nature, 1953 Good illustration of science in action: Missteps in the path to a discovery Value of knowledge Value of collaboration Cost of sharing your data too early

17
Covalent Structure of DNA (1868-1935)
Friedrich Miescher isolates “nuclein” from cell nuclei Hydrolysis of nuclein: phosphate pentose and a nucleobase Chemical analysis: phosphodiester linkages pentose is ribofuranoside Structure of DNA: 1929 (Levene and London) Structure of DNA: 1935 (Levene and Tipson)
 Structure of DNA: (Levene and Tipson)")
18
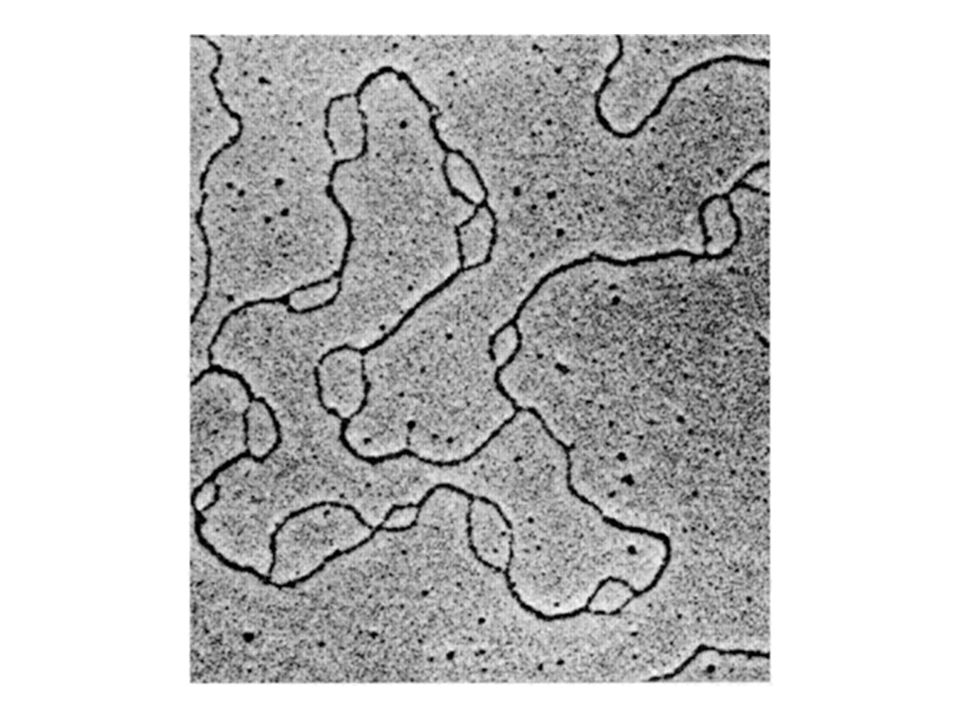
FIGURE 8-12 X-ray diffraction pattern of DNA
FIGURE 8-12 X-ray diffraction pattern of DNA. The spots forming a cross in the center denote a helical structure. The heavy bands at the left and right arise from the recurring bases.

19
Road to the Double Helix
Franklin and Wilkins: “Cross” means helix “Diamonds” mean that the phosphate- sugar backbone is outside Calculated helical parameters Watson and Crick: Missing layer means alternating pattern (major & minor groove) Hydrogen bonding: A pairs with T G pairs with C Double helix fits the data! Watson, Crick, and Wilkins shared 1962 Nobel Prize Franklin died in 1958
 Hydrogen bonding: A pairs with T. G pairs with C. Double helix fits the data! Watson, Crick, and Wilkins shared Nobel Prize. Franklin died in")
22
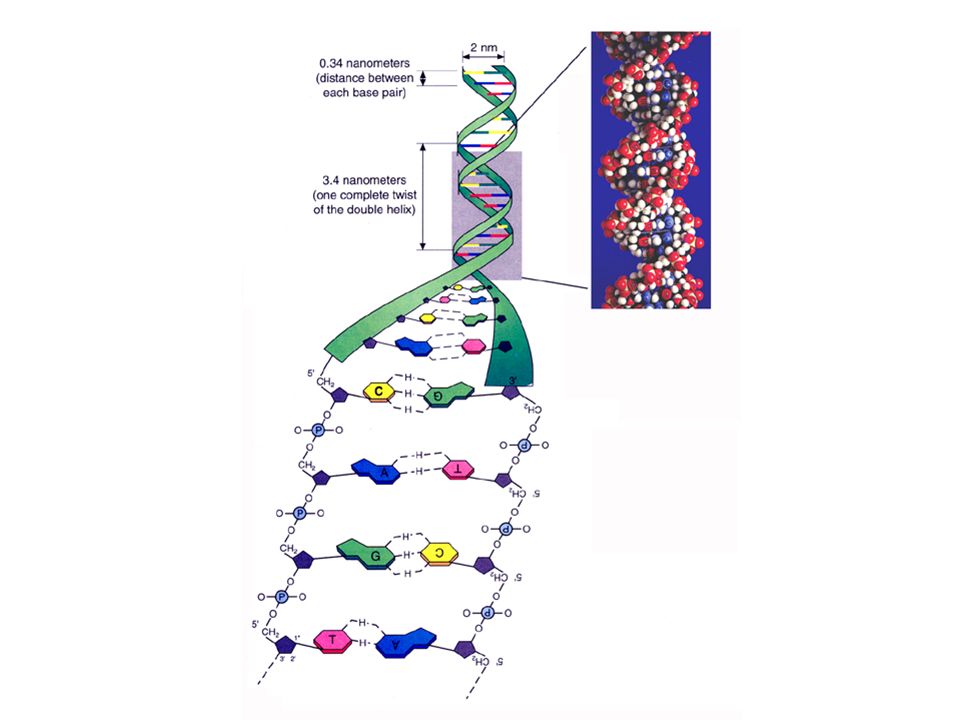
FIGURE 8-13 Watson-Crick model for the structure of DNA
FIGURE 8-13 Watson-Crick model for the structure of DNA. The original model proposed by Watson and Crick had 10 base pairs, or 34 Å (3.4 nm), per turn of the helix; subsequent measurements revealed 10.5 base pairs, or 36 Å (3.6 nm), per turn. (a) Schematic representation, showing dimensions of the helix. (b) Stick representation showing the backbone and stacking of the bases. (c) Space-filling model.
, per turn of the helix; subsequent measurements revealed 10.5 base pairs, or 36 Å (3.6 nm), per turn. (a) Schematic representation, showing dimensions of the helix. (b) Stick representation showing the backbone and stacking of the bases. (c) Space-filling model.")
23
Other forms of DNA FIGURE 8-17 (part 2) Comparison of A, B, and Z forms of DNA. Each structure shown here has 36 base pairs. The bases are shown in gray, the phosphate atoms in yellow, and the riboses and phosphate oxygens in blue. Blue is the color used to represent DNA strands in later chapters. The table summarizes some properties of the three forms of DNA.
 Comparison of A, B, and Z forms of DNA. Each structure shown here has 36 base pairs. The bases are shown in gray, the phosphate atoms in yellow, and the riboses and phosphate oxygens in blue. Blue is the color used to represent DNA strands in later chapters. The table summarizes some properties of the three forms of DNA.")
26
DNA Replication FIGURE 8-15 Replication of DNA as suggested by Watson and Crick. The preexisting or "parent" strands become separated, and each is the template for biosynthesis of a complementary "daughter" strand (in pink). “It has not escaped our notice that the specific pairing we have postulated immediately suggests a possible copying mechanism for the genetic material” Watson and Crick, in their Nature paper,1953
. It has not escaped our notice that the specific pairing we have postulated immediately suggests a possible. copying mechanism for the genetic material Watson and Crick, in their Nature paper,1953.")
28
Step 1: helicase Step 2: DNA polymerase Step 3: DNA ligase

31
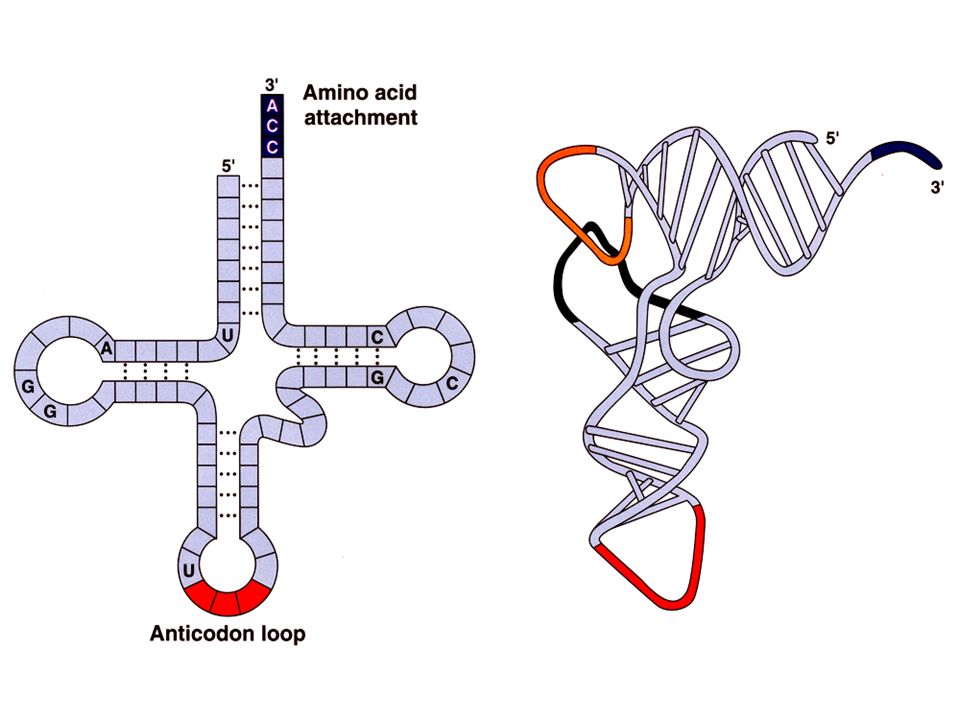
FIGURE 8-25 Three-dimensional structure in RNA
FIGURE 8-25 Three-dimensional structure in RNA. (a) Three-dimensional structure of phenylalanine tRNA of yeast (PDB ID 1TRA). Some unusual base-pairing patterns found in this tRNA are shown. Note also the involvement of the oxygen of a ribose phosphodiester bond in one hydrogen-bonding arrangement, and a ribose 2′-hydroxyl group in another (both in red). (b) A hammerhead ribozyme (so named because the secondary structure at the active site looks like the head of a hammer), derived from certain plant viruses (derived from PDB ID 1MME). Ribozymes, or RNA enzymes, catalyze a variety of reactions, primarily in RNA metabolism and protein synthesis. The complex three-dimensional structures of these RNAs reflect the complexity inherent in catalysis, as described for protein enzymes in Chapter 6. (c) A segment of mRNA known as an intron, from the ciliated protozoan Tetrahymena thermophila (derived from PDB ID 1GRZ). This intron (a ribozyme) catalyzes its own excision from between exons in an mRNA strand (discussed in Chapter 26
 Three-dimensional structure of phenylalanine tRNA of yeast (PDB ID 1TRA). Some unusual base-pairing patterns found in this tRNA are shown. Note also the involvement of the oxygen of a ribose phosphodiester bond in one hydrogen-bonding arrangement, and a ribose 2′-hydroxyl group in another (both in red). (b) A hammerhead ribozyme (so named because the secondary structure at the active site looks like the head of a hammer), derived from certain plant viruses (derived from PDB ID 1MME). Ribozymes, or RNA enzymes, catalyze a variety of reactions, primarily in RNA metabolism and protein synthesis. The complex three-dimensional structures of these RNAs reflect the complexity inherent in catalysis, as described for protein enzymes in Chapter 6. (c) A segment of mRNA known as an intron, from the ciliated protozoan Tetrahymena thermophila (derived from PDB ID 1GRZ). This intron (a ribozyme) catalyzes its own excision from between exons in an mRNA strand (discussed in Chapter 26.")
33
FIGURE 8-19a Hairpins and cruciforms
FIGURE 8-19a Hairpins and cruciforms. Palindromic DNA (or RNA) sequences can form alternative structures with intrastrand base pairing. (a) When only a single DNA (or RNA) strand is involved, the structure is called a hairpin.
 sequences can form alternative structures with intrastrand base pairing. (a) When only a single DNA (or RNA) strand is involved, the structure is called a hairpin.")
34
Why detect Transcription Factor targets?
Transcription factors are medically relevant ~10% of human genes Crucial roles in development and cell life cycle Misregulation and mutation cause disease Critically, most cancers involve TF overactivity Darnell, Nature Reviews Cancer 2, 740 (2002)
")
35
Traditional methods for Transcription Factor detection
Expression Microarrays Western Blots Gel Shift Assays The challenge: Most of these methods are indirect, slow (hours), or can’t differentiate active and inactive protein.
, or can’t differentiate active and inactive protein.")
36
Bio-mimicry is a powerful motivation
Velcro: inspired by burrs Conformation Switching Probes Marvin J S et al. PNAS 1997;94: Randomize peptides, express, replicate successful

37
Optical Conformation Switching TF Switch Sensors

38
Rationally Tuning TF Sensors
KS = 10 [ ] [ ] [ ] From different lecture from Biochemistry papers, we found that the most popular model to describe the structure-switching sensors is the population-shift model. Give an example (like with my hand and a tennis ball): switch typically exist into two states Although many results gathered by the Scientific community suggest the validity of this model, no studies had ever try to to test this model experimentally. That’s what we decided to do… KS = KD = KS = 1 [ ] [ ] % switches open KS = 0.01 KS = 0.001 KS = 0.1 KS [target] KD (1+ KS) + KS [target] % switches open = Target [M] 38
: switch typically exist into two states. Although many results gathered by the Scientific community suggest the validity of this model, no studies had ever try to to test this model experimentally. That’s what we decided to do… KS = KD = KS = 1. [ ] [ ] % switches open. KS = KS = KS = 0.1. KS [target] KD (1+ KS) + KS [target] % switches open = Target [M] 38.")
39
TF Beacon Actual Performance
![]()
40
Quantitative Detection in 4 easy steps
HeLa nuclear extract has substantial optical background Addition of exogenous TBP gives well-behaved signal But surprisingly, apparent sensitivity is increased Addition of a DNA that sequesters TBP reduces initial signal Endogenous TBP is present, and directly detected by sensor Detects 5.7 ± 1.6 nM TBP in 250μg/ml extract

41
transcription

42
transcription

43
transcription

44
initiation

45
initiation

46
initiation

47
elongation

48
elongation

49
elongation

50
elongation

51
elongation

52
elongation

53
elongation

54
mRNA tRNA (5') A – U – G – U – U – U – G – U – C – A – G – U . . . . .
U – A – C – A – A – A – C – A – G – U – C – A peptide Met –––– Phe –––– Val –––– Ser

55
C U U A

56
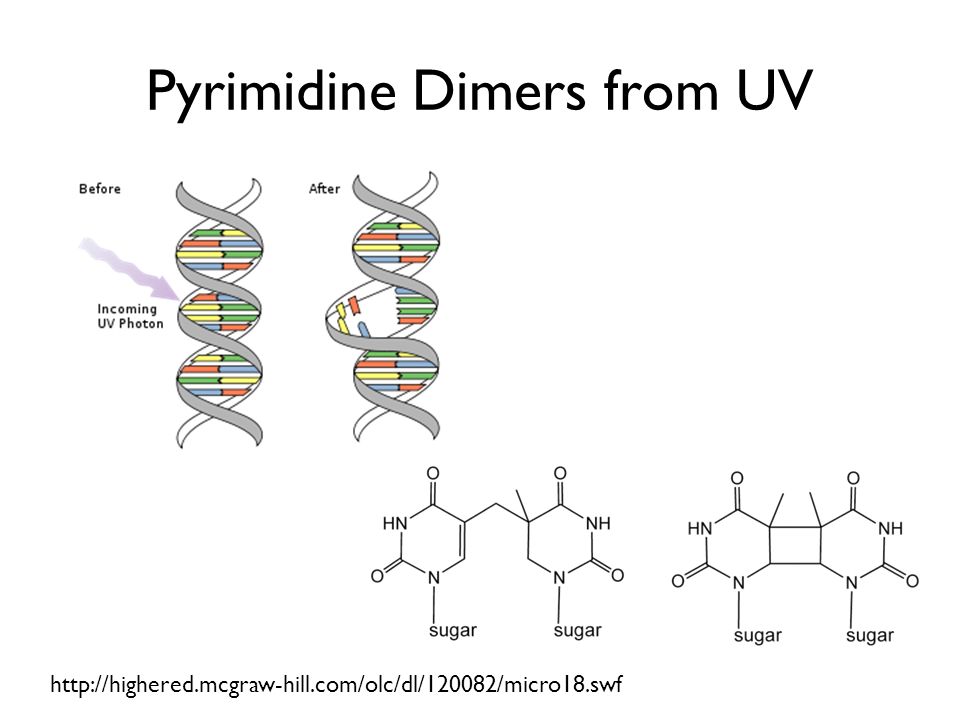
Pyrimidine Dimers from UV
67
DNA mRNA (5') A – T – G – T – T – T – G – T – C – A – G – T . . . . .
(3') T – A – C – A – A – A – C – A – G – T – C – A mRNA (5') A – U – G – U – U – U – G – U – C – A – G – U peptide Met –––– Phe –––– Val –––– Ser
 T – A – C – A – A – A – C – A – G – T – C – A mRNA. (5 ) A – U – G – U – U – U – G – U – C – A – G – U peptide. Met –––– Phe –––– Val –––– Ser")
68
DNA mRNA (5') A – T – G – T – T – T – G – T – C – A – G – T . . . . .
(3') T – A – C – A – A – A – C – A – G – T – C – A mRNA (5') A – U – G – U – U – U – G – U – C – A – G – U peptide Met –––– Phe –––– Val –––– Ser
 T – A – C – A – A – A – C – A – G – T – C – A mRNA. (5 ) A – U – G – U – U – U – G – U – C – A – G – U peptide. Met –––– Phe –––– Val –––– Ser")
69
DNA mRNA (5') A – T – G – T – T – T – G – T – C – A – G – T . . . . .
(3') T – A – C – A – A – A – C – A – G – T – C – A mRNA (5') A – U – G – U – U – U – G – U – C – A – G – U peptide Met –––– Phe –––– Val –––– Ser
 T – A – C – A – A – A – C – A – G – T – C – A mRNA. (5 ) A – U – G – U – U – U – G – U – C – A – G – U peptide. Met –––– Phe –––– Val –––– Ser")
70
DNA mRNA (5') A – T – G – T – T – T – G – T – C – A – G – T . . . . .
(3') T – A – C – A – A – A – C – A – G – T – C – A mRNA (5') A – U – G – U – U – U – G – U – C – A – G – U peptide Met –––– Phe –––– Val –––– Ser
 T – A – C – A – A – A – C – A – G – T – C – A mRNA. (5 ) A – U – G – U – U – U – G – U – C – A – G – U peptide. Met –––– Phe –––– Val –––– Ser")
71
Mutations mRNA (5') A – U – G – U – U – U – G – U – C – A – G – U peptide Met –––– Phe –––– Val –––– Ser A – U – G – U – U – U – G – A – C – A – G – U mRNA (5') peptide Met –––– Phe –––– Asp –––– Ser
 peptide. Met –––– Phe –––– Asp –––– Ser")
72
mRNA mRNA point substitution mutation (5')
A – U – G – U – U – U – G – U – C – A – G – U – A peptide Met –––– Phe –––– Val –––– Ser A – U – G – U – U – U – G – A – C – A – G – U mRNA (5') peptide Met –––– Phe –––– Asp –––– Ser
 peptide. Met –––– Phe –––– Asp –––– Ser")
73
mRNA mRNA point substitution mutation (5')
A – U – G – U – U – U – G – U – C – A – G – U – A peptide Met –––– Phe –––– Val –––– Ser A – U – G – U – U – U – G –A– C – A – G – U – A mRNA (5') peptide Met –––– Phe –––– Asp –––– Ser
 peptide. Met –––– Phe –––– Asp –––– Ser")
74
mRNA mRNA point substitution mutation (5')
A – U – G – U – U – U – G – U – C – A – G – U – A peptide Met –––– Phe –––– Val –––– Ser A – U – G – U – U – U – G –A– C – A – G – U – A mRNA (5') Met –––– Phe ––– Asp ––– Ser peptide
 Met –––– Phe ––– Asp ––– Ser peptide.")
75
mRNA mRNA frameshift mutation (5')
A – U – G – U – U – U – G – U – C – A – G – U – A peptide Met –––– Phe –––– Val –––– Ser mRNA (5') A – U – G – U – U – U – G – U – C – A – G – U – A Met –––– Phe –––– Val –––– Val peptide
 A – U – G – U – U – U – G – U – C – A – G – U – A Met –––– Phe –––– Val –––– Val peptide.")
76
mRNA mRNA frameshift mutation (5')
A – U – G – U – U – U – G – U – C – A – G – U – A peptide Met –––– Phe –––– Val –––– Ser mRNA (5') A – U – G – U – U – U – G – U – C – A – G – U – A Met –––– Phe –––– Val –––– Val peptide
 A – U – G – U – U – U – G – U – C – A – G – U – A Met –––– Phe –––– Val –––– Val peptide.")
77
mRNA mRNA frameshift mutation (5')
A – U – G – U – U – U – G – U – C – A – G – U – A peptide Met –––– Phe –––– Val –––– Ser mRNA (5') A – U – G – U – U – U – G – U – C – A – G – U – A Met –––– Phe –––– Val –––– Val peptide
 A – U – G – U – U – U – G – U – C – A – G – U – A Met –––– Phe –––– Val –––– Val peptide.")
78
PCR Polymerase Chain Reaction
FIGURE 9-16a (part 1) Amplification of a DNA segment by the polymerase chain reaction. (a) The PCR procedure has three steps. DNA strands are 1 separated by heating, then 2 annealed to an excess of short synthetic DNA primers (blue) that flank the region to be amplified; 3 new DNA is synthesized by polymerization. The three steps are repeated for 25 or 30 cycles. The thermostable DNA polymerase TaqI (from Thermus aquaticus, a bacterial species that grows in hot springs) is not denatured by the heating steps.
 Amplification of a DNA segment by the polymerase chain reaction. (a) The PCR procedure has three steps. DNA strands are 1 separated by heating, then 2 annealed to an excess of short synthetic DNA primers (blue) that flank the region to be amplified; 3 new DNA is synthesized by polymerization. The three steps are repeated for 25 or 30 cycles. The thermostable DNA polymerase TaqI (from Thermus aquaticus, a bacterial species that grows in hot springs) is not denatured by the heating steps.")
80
DNA Fingerprinting BOX 9-1 FIGURE 1 The Southern blot procedure, as applied to RFLP DNA fingerprinting. Southern blotting (used for many purposes in molecular biology) was named after Jeremy Southern, who developed the technique. In this example of a forensic application, the DNA from a semen sample obtained from a rape and murder victim was compared with DNA samples from the victim and two suspects. Each sample was cleaved into fragments and separated by gel electrophoresis. Radioactive DNA probes were used to identify a small subset of fragments that contained sequences complementary to the probe. The sizes of the identified fragments varied from one individual to the next, as seen here in the different patterns for the three individuals (victim and two suspects) tested. One suspect's DNA exhibits a banding pattern identical to that of the semen sample taken from the victim.
 was named after Jeremy Southern, who developed the technique. In this example of a forensic application, the DNA from a semen sample obtained from a rape and murder victim was compared with DNA samples from the victim and two suspects. Each sample was cleaved into fragments and separated by gel electrophoresis. Radioactive DNA probes were used to identify a small subset of fragments that contained sequences complementary to the probe. The sizes of the identified fragments varied from one individual to the next, as seen here in the different patterns for the three individuals (victim and two suspects) tested. One suspect s DNA exhibits a banding pattern identical to that of the semen sample taken from the victim.")
81
DNA Sequencing

82
DNA Sequencing

83
Shotgun Sequencing FIGURE 9-17 The Human Genome Project strategy. Clones isolated from a genomic library were ordered into a detailed physical map, then individual clones were sequenced by shotgun sequencing protocols. The strategy used by the commercial sequencing effort eliminated the step of creating the physical map and sequenced the entire genome by shotgun cloning.

84
Electrochemical Sequencing

85
FIGURE 9-18 Genomic sequencing timeline
FIGURE 9-18 Genomic sequencing timeline. Discussions in the mid-1980s led to initiation of the Human Genome Project in Preparatory work, including extensive mapping to provide genome landmarks, occupied much of the 1990s. Separate projects were launched to sequence the genomes of other organisms important to research. The sequencing efforts completed to date include many bacterial species (such as Haemophilus influenzae), yeast (S. cerevisiae), nematode worms (e.g., C. elegans), insects (D. melanogaster and Apis mellifera), plants (A. thaliana and Oryza sativa L.), rodents (Mus musculus and Rattus norvegicus), primates (Homo sapiens and Pan troglodytes), and some nasty human pathogens (e.g., Trichomonas vaginalis). Each genome project has a website that serves as a central repository for the latest data.
, yeast (S. cerevisiae), nematode worms (e.g., C. elegans), insects (D. melanogaster and Apis mellifera), plants (A. thaliana and Oryza sativa L.), rodents (Mus musculus and Rattus norvegicus), primates (Homo sapiens and Pan troglodytes), and some nasty human pathogens (e.g., Trichomonas vaginalis). Each genome project has a website that serves as a central repository for the latest data.")
86
FIGURE 9-19 Snapshot of the human genome
FIGURE 9-19 Snapshot of the human genome. The chart shows the proportions of our genome made up of various types of sequences.

Similar presentations


>")


 –Enzyme cofactors (NAD + ) –Signal.>")

 Chemical links in response of cells to hormones (cAMP) Involved in cofactors (NAD, FAD, CoA)>")
 –Enzyme cofactors (NAD + ) –Signal.>")


