Download presentation
Presentation is loading. Please wait.

1
Prepare and monitor anaesthesia in animals
MONITORING See

2
Best Practice in Anaesthesia
Photo from - Griet Haitjema, Senior Registrar - Veterinary Anaesthesia and Critical care Murdoch University Veterinary Hospital

3
General GA monitoring rules
Monitoring continuous Recording every 5 mins The anaesthetist’s overall judgement is more important than any one parameter reading

4
Vital Signs for Anaesthesia
CNS vitals Consciousness Reflexes Responses Muscle tone Other vitals Cardiovascular Respiratory Urinary Depth of anaesthesia See Stages of Anaesthesia

5
Another classification
Signs continually present Signs evoked by a stimulus Responses Reflexes

6
Resting Signs Pupils & Eye position Jaw tone Heart rate & rhythm
Respiratory rate Pulse quality MM & CRT Temperature Haemoglobin O2 saturation (Pulse oximetry) Blood pressure ECG End-expiratory CO2 (Capnography) Tongue curl (under light GA when as mouth opened) Salivation (possible inadequate anaesthesia) Urine output (1-2mL/kg/hr an indication of renal perfusion)
 Blood pressure. ECG. End-expiratory CO2 (Capnography) Tongue curl (under light GA when as mouth opened) Salivation (possible inadequate anaesthesia) Urine output (1-2mL/kg/hr an indication of renal perfusion)")
7
Other Signs tested for Palpebral reflex
Ear twitch (not a good guide to depth in cats) Reaction to painful stimulus Skin pricking Corneal reflex Pedal reflex Anal pinching PLR Response to visceral stimulus Cutaneous reflex Righting reflex Pharyngeal reflex Laryngeal reflex
 Reaction to painful stimulus. Skin pricking. Corneal reflex. Pedal reflex. Anal pinching. PLR. Response to visceral stimulus. Cutaneous reflex. Righting reflex. Pharyngeal reflex. Laryngeal reflex.")
8
Surgical ‘stress map’ (timeline)
")
9
5 mins How often to monitor?
Ideally check & record vitals every 5 minutes 5 mins

10
Monitoring form e.g. ‘AAS’ FORM

12
Class activity 1 List 8 signs that can be monitored when a patient is under GA?

13
Answers 1 Heart rate and rhythm Pulse rate MM colour
RR, depth and character CRT Temperature Oxygen saturation Pupil size and position

14
Monitoring depth See anaesthesia stages

15
Anaesthetised Dog & Cat
HR 80-140 RR 10-30 20-40 C 38 CRT < 2 sec SpO2 > 95% BP (diast) mmHg BP (syst) mmHg
 mmHg. BP (syst) mmHg.")
16
Class Activity 2 List reflexes that can be monitored when a patient is under G/A

17
Answers 2 Pedal reflex Jaw tone Skin pricking Anal pinching
Palpebral reflex Corneal reflex PLR Response to visceral stimulus Ear twitch Cutaneous reflex Reaction to painful stimulus Righting reflex Pharyngeal reflex Laryngeal reflex

18
Class activity 3 What are some types of monitoring devices?

19
Answers 3 Person ECG Pulse oximeter End tidal volume CO2 monitor
Oesophageal stethoscope & stethoscope Respiratory monitors such as an Apalert Doppler ultrasound & Dinamap Thermometer

20
Heart Rate Normal Dog Report HR <80 to vet Cat

21
Oesophageal Stethoscope

22
Pulse rate & quality Pulse strength & rate more useful information than HR Measure Lingual (under tongue, midline) Femoral Carotid Pedal (dorsal)
")
23
Easy & Useful - 2 fingers on ventral midline of tongue
Lingual pulse Easy & Useful - 2 fingers on ventral midline of tongue

24
Pulse rate & quality Pulse beat should be felt just after each heart beat Measure both HR & PR at same time If not synchronised you have a ‘pulse deficit’ Strength of pulse gives a rough estimate of blood pressure

25
Oesophageal Stethoscope
Tube attached to a regular stethoscope Permits auscultation of heart & lungs of draped patient Intubate patient Lubricate tubing (e.g. K-Y® gel) Advance until heartbeat detected
 Advance until heartbeat detected.")
26
MM & CRT Best to assess gingival MM colour CRT Pallor
Pain, haemorrhage, hypothermia, shock Bluish-purple = cyanosis Indicates hypoxia / hypoxaemia Usually caused respiratory failure / airway obstruction CRT Useful but not reliable Can have a good CRT in a euthanased animal!

27
Pulse oximetry

28
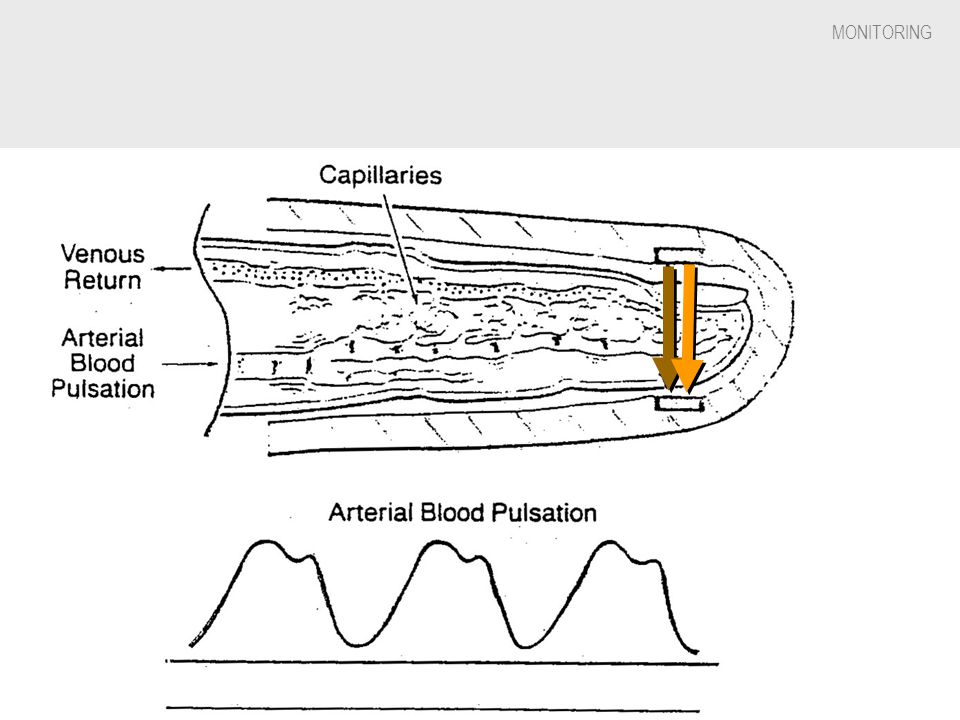
Pulse Oximeters How they work
Measure the absorption of infrared light by haemoglobin in a peripheral tissue bed. The light absorption characteristics of haemoglobin vary with SpO2 Measure the difference in 2 wavelengths (red & blue) of arterial pulsating blood and the fixed signals from skin, tissue and venous blood
 of arterial pulsating blood and the fixed signals from skin, tissue and venous blood.")
32
Application sites Clip type sensors – tongue, lip, ear if non pigmented, paw, toes, thin skin folds on extremities (e.g. above hock) Reflector sensors – light source & receiving sensor are on the same side of the skin surface, taped to a hairless skin surface Rectal sensors – unreliable as faecal matter interferes with light transmission and probe movement cause vasoconstriction

33
Placement of sensor Handle area (e.g. tongue) gently as rough handling causes vasoconstriction Clipping hair at application site helps

34
Pulse oximetry Measures the relative absorption (saturation) of the haemoglobin molecule with oxygen in an artery An arterial vessel is distinguished by detecting its pulsation Abbreviation = SpO2 (SpulseO2) The pulse Hb O2 saturation (SpO2) is an estimation of arterial Hb saturation, SaO2 (SarterialO2) [cf arterial oxygen pressure = PaO2 requires sampling blood and promptly measuring oxygen content] Reprinted from RESPIRATORY CARE (Respir Care 1991;36: ) AARC Clinical Practice Guideline Pulse Oximetry PO 1.0 PROCEDURE: Pulse Oximetry (SpO2) PO 2.0 DESCRIPTION/DEFINITION: Pulse oximetry provides estimates of arterial oxyhemoglobin saturation (SaO2) by utilizing selected wavelengths of light to noninvasively determine the saturation of oxyhemoglobin (SpO2).(1-6) PO 3.0 SETTING: Pulse oximetry may be performed by trained personnel in a variety of settings including (but not limited to) hospitals, clinics, and the home.(7,8) PO 4.0 INDICATIONS: 4.1 The need to monitor the adequacy of arterial oxyhemoglobin saturation(1,4,6,9) 4.2 The need to quantitate the response of arterial oxyhemoglobin saturation to therapeutic intervention(4,9,10) or to a diagnostic procedure (eg, bronchoscopy) 4.3 The need to comply with mandated regulations(11,12) or recommendations by authoritative groups(13,14) PO 5.0 CONTRAINDICATIONS: The presence of an ongoing need for measurement of pH, PaCO2, total hemoglobin, and abnormal hemoglobins may be a relative contraindication to pulse oximetry. PO 6.0 HAZARDS/COMPLICATIONS: Pulse oximetry is considered a safe procedure, but because of device limitations, false-negative results for hypoxemia(4) and/or false-positive results for normoxemia(15,16) or hyperoxemia(17,18) may lead to inappropriate treatment of the patient. In addition, tissue injury may occur at the measuring site as a result of probe misuse (eg, pressure sores from prolonged application or electrical shock and burns from the substitution of incompatible probes be-tween instruments).(19) PO 7.0 DEVICE LIMITATIONS/VALIDATION OF RESULTS: 7.1 Factors, agents, or situations that may affect readings, limit precision, or limit the performance or application of a pulse oximeter include 7.1.1 motion artifact(2,5,8,9,20) 7.1.2 abnormal hemoglobins (primarily carboxyhemoglobin [COHb] and met-hemoglobin [metHb])(1,3,5,8,9,21) 7.1.3 intravascular dyes(1,3,8,9) 7.1.4 exposure of measuring probe to ambient light during measurement(2,3,8,9) 7.1.5 low perfusion states(1,3,4,8,9,21) 7.1.6 skin pigmentation(5,9,10,21) 7.1.7 nail polish or nail coverings with finger probe(9) 7.1.8 inability to detect saturations below 83%(22) with the same degree of accuracy and precision seen at higher saturations(9,10,21,23,24) 7.1.9 inability to quantitate the degree of hyperoxemia present(17) Hyperbilirubinemia has been shown not to affect the accuracy of SpO2 readings.(25,26) 7.2 To validate pulse oximeter readings, incorporate or assess agreement between SpO2 and arterial oxyhemoglobin saturation (SaO2) obtained by direct measurement(1,4,5,21)--these measurements should be initially performed simultaneously(4,21) and then periodically re-evaluated in relation to the patient's clinical state.(6,27,28) 7.3 To help assure consistency of care (between institutions and within the same institution) based on SpO2 readings, assess 7.3.1 selection of proper probe and appropriate placement (the probe is at-tached to its intended site); 7.3.2 for continuous, prolonged monitoring, the Hi/Low alarms are approprately set; 7.3.3 specific manufacturer's recom-mendations are complied with, the device is applied and adjusted correctly to monitor response time(5,29) and electrocardio-graphic coupling;(20) 7.3.4 strength of plethysmograph waveform or pulse amplitude strength; assure that device is detecting an adequate pulse. 7.4 SpO2 results should be documented in the patient's medical record and should detail the conditions under which the readings were obtained: 7.4.1 date, time of measurement, and pulse oximeter reading; patient's position, activity level, and location;(4) during monitoring, assure that patient's activity is according to physician's order; 7.4.2 inspired oxygen concentration or supplemental oxygen flow, specifying the type of oxygen delivery device; 7.4.3 probe placement site(4) and probe type; 7.4.4 model of device (if more than one device is available for use); 7.4.5 results of simultaneously obtained arterial pH, PaO2, and PaCO2, and directly measured saturations of COHb, MetHb, and O2Hb4 (if direct measurement was not simultaneously performed, an additional, one time statement must be made explaining that the SpO2 reading has not been validated by comparison to directly measured values); 7.4.6 stability of readings (length of observation time and range of fluctuation, for continuous or prolonged studies, review of recording may be necessary); 7.4.7 clinical appearance of patient--subjective assessment of perfusion at measuring site (eg, cyanosis, skin temperature); (9) 7.4.8 agreement between patient's heart rate as determined by pulse oximeter and by palpation and oscilloscope.(2,17,28,30) 7.5 When disparity exists between SpO2, SaO2 readings, and the clinical presentation of the patient, possible causes should be explored before results are reported. Discrepancies may be reduced by monitoring at alternate sites or appropriate substitution of instruments or probes.If such steps do not remedy the disparity, results of pulse oximetry should not be reported; instead, a statement describing the corrective action should be included in the patient's medical record, and direct measurement of arterial blood gas values should be requested. The absolute limits that constitute unacceptable disparity vary with patient condition and specific device. Clinical judgment must be exercised. PO 8.0 ASSESSMENT OF NEED: 8.1 When direct measurement of SaO2 is not available or accessible in a timely fashion, a SpO2 measurement may temporarily suffice if the limitations of the data are appreciated.(9,10) 8.2 SpO2 is appropriate for continuous and prolonged monitoring (eg, during sleep, exercise, bronchoscopy).(1,6,7,9,10,14,31) 8.3 SpO2 may be adequate when assessment of acid-base status and/or PaO2 is not requir-ed.(1,4,9,10) PO 9.0 ASSESSMENT OF OUTCOME: The following should be utilized to evaluate the benefit of pulse oximetry: 9.1 SpO2 results should reflect the patient's clinical condition (ie, validate the basis for ordering the test). 9.2 Documentation of results, therapeutic in-tervention (or lack of), and/or clinical decisions based on the SpO2 measurement should be noted in the medical record. PO 10.0 RESOURCES: 10.1 Equipment: pulse oximeter and related accessories (probe of appropriate size)--the oximeter should have been validated by the manufacturer by a comparison of its values (and consequently its calibration curve) with directly measured oxyhemoglobin saturation.(17,32) 10.2 Personnel: Pulse oximetry is a relatively easy procedure to perform. However, if the procedure is not properly performed or if it is performed by persons who are not cognizant of device limitations or applications, spurious results can lead to inappropriate intervention. Level I--personnel trained in the technical operation of pulse oximeters, oxygen delivery devices and related equipment, measurement of vital signs, and record keeping--may perform and record results of pulse oximetry but should be supervised by Level II personnel. Level II--health care profes-sionals trained in patient assessment, disorders of acid-base, oxygenation and ventilation, and diagnostic and therapeutic alternatives--evaluate patients and recommend and/or make changes in therapy based on assessment. PO 11.0 MONITORING: The clinician is referred to Section 7.0 Validation of Results. The monitoring schedule of patient and equipment during continuous oximetry should be tied to bedside assessment and vital signs determinations. PO 12.0 FREQUENCY: After agreement has been initially established between SaO2 and SpO2, the frequency of SpO2 monitoring (ie, continuous vs 'spot check') depends on the clinical status of the patient, the indications for performing the procedure and recommended guidelines.(14,31) For example, continuous SpO2 monitoring may be indicated throughout a bronchoscopy for detecting episodes of desaturation,(3,31) whereas a spot check may suffice for evaluating the efficacy of continued oxygen therapy in a stable postoperative patient. However, it must be emphasized that direct measurement of SaO2 is necessary whenever the SpO2 does not confirm or verify suspicions concerning the patient's clinical state. PO 13.0 INFECTION CONTROL: No special precautions are necessary, but Universal Precautions (as described by the Centers for Disease Control(33,34)) are recommended. 13.1 If the device probe is intended for multiple patient use, the probe should be cleaned between patient applications according to manufacturer recommendations. 13.2 The external portion of the monitor should be cleaned according to manufacturer's recommendations whenever the device remains in a patient's room for prolonged periods, when soiled, or when it has come in contact with potentially transmissible organisms. Cardiopulmonary Diagnostics Guidelines Committee: Kevin Shrake MA RRT, Chairman, Springfield IL Susan Blonshine RPFT RRT, Lansing MI Robert Brown BS RPFT RRT, Madison WI Robert Crapo MD, Salt Lake City UT Rick Martineau BS RPFT RRT, Reno NV Gregg Ruppell MA RPFT RRT, St Louis MO Jack Wanger MBA RPFT RRT, Denver CO REFERENCES Moran RF, Clausen JL, Ehrmeyer SS, Feil M, Van Kessel Al, Eichhorn JH. Oxygen content, hemoglobin oxygen, "saturation," and related quantities in blood: terminology, measurement, and reporting. National Committee for Clinical Laboratory Standards 1990; C25-P:10:1-49. Huch A, Huch R, Konig V, Neuman MR, Parker D, Yount J, Lubbers D. Limitations of pulse oximetry. Lancet 1988;1: Schnapp LM, Cohen NH. Pulse oximetry-uses and abuses. Chest 1990;98: Hansen JE, Casaburi R. Validity of ear oximetry in clinical exercise testing. Chest 1987;91: Ries AL, Prewitt LM, Johnson JJ. Skin color and ear oximetry. Chest 1989;96: Shapiro BA, Cane RD. Blood gas monitoring: yesterday, today, and tomorrow. Crit Care Med 1989; 17: Fulmer JD, Snider GL. ACCP-NHLBI National Conference on Oxygen Therapy. Chest 1984;86: Concurrent publication in Respir Care 1984;29: Brown M, Vender JS. Noninvasive oxygen monitoring. Crit Care Clin 1988;4: Welch JP, DeCesare MS, Hess D. Pulse oximetry: instrumentation and clinical applications. Respir Care 1990;35: Jubran, A Tobin MJ. Reliability of pulse oximetry in titrating supplemental oxygen therapy in ventilator-dependent patients. Chest 1990;97: American Society of Anesthesiologists. Standards for basic intraoperative monitoring. ASA Newsletter 1986; 50:12. Joint Commission on Accreditation of Hospitals. Accreditation manual for hospitals. Chicago: JCAH, 1988: Task Force on Guidelines, Society of Critical Care Medicine. Recommendations for services and personnel for delivery of care in a critical care setting. Crit Care Med 1988;16: Task Force on Guidelines, Society of Critical Care Medicine. Guidelines for standards of care for patients with acute respiratory failure on mechanical ventilatory support. Crit Care Med 1991;19: Misiano DR, Meyerhoff ME, Collision ME. Current and future directions in the technology relating to bedside testing of critically ill patients. Chest 1990;97:204S-214S. Hannhart B, Michalski H, Delorme N, Chapparo G, Polu J-M. Reliability of six pulse oximeters in chronic obstructive pulmonary disease. Chest 1991;99: Tremper KK, Barker SJ. Pulse oximetry. Anesthesiology 1989;70: Praud JP, Carofilis A, Bridey F, Lacaille F, Dehan M, Gaultier CL. Accuracy of two wavelength pulse oximetry in neonates and infants. Pediatr Pulmonol 1989;6: ECRI Health Devices Alert, 1990-A-26. Plymouth Meeting PA: ECRI, June 29, 1990. Barrington KJ, Finer NN, Ryan CA. Evaluation of pulse oximetry as a continuous monitoring technique in the neonatal intensive care unit. Crit Care Med 1988;16: Cahan C, Decker MJ, Hoekle PL, Strohl KP. Agreement between noninvasive oximetric values for oxygen saturation. Chest 1990;97: Hannhart B, Habberer J-P, Saunier C, Laxenaire MC. Accuracy and precision of fourteen pulse oximeters. Eur Respir J 1991;4: Severinghaus JW, Naifeh KH. Accuracy of response of six pulse oximeters to profound hypoxia. Anesthesiology 1987;67: Severinghaus JW, Naifeh KH, Koh SO. Errors in 14 pulse oximeters during profound hypoxia. J Clin Monit 1989;5:72-81. Veyckemans F, Baele.P, Guillaume JE, Willems E, Robert A, Clerbaux T. Hyperbilirubinemia does not interfere with hemoglobin saturation measured by pulse oximetry. Anesthesiology 1989;70: Chelluri L, Snyder JV, Bird JR. Accuracy of pulse oximetry in patients with hyperbilirubinemia. Respir Care 1991;36: Goldenheim PD, Kazemi H. Cardiopulmonary monitoring of critically ill patients. N Engl J Med 1984; 311: King T, Simon RH. Pulse oximetry for tapering supplemental oxygen in hospitalized patients: evaluation of a protocol. Chest 1987;92: Chapman KR, Liu FL, Watson RM, Rebuck AS. Range of accuracy of two wavelength oximetry. Chest 1986;89: Cheng EY, Hopwood MB, Kay J. Forehead pulse oximetry compared with finger pulse oximetry and arterial blood gas measurement. J Clin Monit 1988;4: Ries AL. Position paper of the American Association of Cardiovascular and Pulmonary Rehabilitation. J Cardiopul Rehab 1990;10: Zaloga GP. Evaluation of bedside testing options for the critical care unit. Chest 1990;97(5, Suppl):175S-190S. Centers for Disease Control. Update: universal precautions for prevention of transmission of human immunodeficiency virus, hepatitis B virus, and other bloodborne pathogens in health care settings. MMWR 1988;37: Boyce JM, White RL, Spruill EY, Wall M. Cost-effective application of the Centers for Disease Control guidelines for prevention of nosocomial pneumonia. Am J Infect Control 1985;3: Interested persons may copy these Guidelines for noncommercial purposes of scientific or educational advancement. Please credit AARC and Respiratory Care Journal.
 The pulse Hb O2 saturation (SpO2) is an estimation of arterial Hb saturation, SaO2 (SarterialO2) [cf arterial oxygen pressure = PaO2 requires sampling blood and promptly measuring oxygen content] Reprinted from RESPIRATORY CARE (Respir Care 1991;36: ) AARC Clinical Practice Guideline. Pulse Oximetry. PO 1.0 PROCEDURE: Pulse Oximetry (SpO2) PO 2.0 DESCRIPTION/DEFINITION: Pulse oximetry provides estimates of arterial oxyhemoglobin saturation (SaO2) by utilizing selected wavelengths of light to noninvasively determine the saturation of oxyhemoglobin (SpO2).(1-6) PO 3.0 SETTING: Pulse oximetry may be performed by trained personnel in a variety of settings including (but not limited to) hospitals, clinics, and the home.(7,8) PO 4.0 INDICATIONS: 4.1 The need to monitor the adequacy of arterial oxyhemoglobin saturation(1,4,6,9) 4.2 The need to quantitate the response of arterial oxyhemoglobin saturation to therapeutic intervention(4,9,10) or to a diagnostic procedure (eg, bronchoscopy) 4.3 The need to comply with mandated regulations(11,12) or recommendations by authoritative groups(13,14) PO 5.0 CONTRAINDICATIONS: The presence of an ongoing need for measurement of pH, PaCO2, total hemoglobin, and abnormal hemoglobins may be a relative contraindication to pulse oximetry. PO 6.0 HAZARDS/COMPLICATIONS: Pulse oximetry is considered a safe procedure, but because of device limitations, false-negative results for hypoxemia(4) and/or false-positive results for normoxemia(15,16) or hyperoxemia(17,18) may lead to inappropriate treatment of the patient. In addition, tissue injury may occur at the measuring site as a result of probe misuse (eg, pressure sores from prolonged application or electrical shock and burns from the substitution of incompatible probes be-tween instruments).(19) PO 7.0 DEVICE LIMITATIONS/VALIDATION OF RESULTS: 7.1 Factors, agents, or situations that may affect readings, limit precision, or limit the performance or application of a pulse oximeter include motion artifact(2,5,8,9,20) abnormal hemoglobins (primarily carboxyhemoglobin [COHb] and met-hemoglobin [metHb])(1,3,5,8,9,21) intravascular dyes(1,3,8,9) exposure of measuring probe to ambient light during measurement(2,3,8,9) low perfusion states(1,3,4,8,9,21) skin pigmentation(5,9,10,21) nail polish or nail coverings with finger probe(9) inability to detect saturations below 83%(22) with the same degree of accuracy and precision seen at higher saturations(9,10,21,23,24) inability to quantitate the degree of hyperoxemia present(17) Hyperbilirubinemia has been shown not to affect the accuracy of SpO2 readings.(25,26) 7.2 To validate pulse oximeter readings, incorporate or assess agreement between SpO2 and arterial oxyhemoglobin saturation (SaO2) obtained by direct measurement(1,4,5,21)--these measurements should be initially performed simultaneously(4,21) and then periodically re-evaluated in relation to the patient s clinical state.(6,27,28) 7.3 To help assure consistency of care (between institutions and within the same institution) based on SpO2 readings, assess selection of proper probe and appropriate placement (the probe is at-tached to its intended site); for continuous, prolonged monitoring, the Hi/Low alarms are approprately set; specific manufacturer s recom-mendations are complied with, the device is applied and adjusted correctly to monitor response time(5,29) and electrocardio-graphic coupling;(20) strength of plethysmograph waveform or pulse amplitude strength; assure that device is detecting an adequate pulse. 7.4 SpO2 results should be documented in the patient s medical record and should detail the conditions under which the readings were obtained: date, time of measurement, and pulse oximeter reading; patient s position, activity level, and location;(4) during monitoring, assure that patient s activity is according to physician s order; inspired oxygen concentration or supplemental oxygen flow, specifying the type of oxygen delivery device; probe placement site(4) and probe type; model of device (if more than one device is available for use); results of simultaneously obtained arterial pH, PaO2, and PaCO2, and directly measured saturations of COHb, MetHb, and O2Hb4 (if direct measurement was not simultaneously performed, an additional, one time statement must be made explaining that the SpO2 reading has not been validated by comparison to directly measured values); stability of readings (length of observation time and range of fluctuation, for continuous or prolonged studies, review of recording may be necessary); clinical appearance of patient--subjective assessment of perfusion at measuring site (eg, cyanosis, skin temperature); (9) agreement between patient s heart rate as determined by pulse oximeter and by palpation and oscilloscope.(2,17,28,30) 7.5 When disparity exists between SpO2, SaO2 readings, and the clinical presentation of the patient, possible causes should be explored before results are reported. Discrepancies may be reduced by monitoring at alternate sites or appropriate substitution of instruments or probes.If such steps do not remedy the disparity, results of pulse oximetry should not be reported; instead, a statement describing the corrective action should be included in the patient s medical record, and direct measurement of arterial blood gas values should be requested. The absolute limits that constitute unacceptable disparity vary with patient condition and specific device. Clinical judgment must be exercised. PO 8.0 ASSESSMENT OF NEED: 8.1 When direct measurement of SaO2 is not available or accessible in a timely fashion, a SpO2 measurement may temporarily suffice if the limitations of the data are appreciated.(9,10) 8.2 SpO2 is appropriate for continuous and prolonged monitoring (eg, during sleep, exercise, bronchoscopy).(1,6,7,9,10,14,31) 8.3 SpO2 may be adequate when assessment of acid-base status and/or PaO2 is not requir-ed.(1,4,9,10) PO 9.0 ASSESSMENT OF OUTCOME: The following should be utilized to evaluate the benefit of pulse oximetry: 9.1 SpO2 results should reflect the patient s clinical condition (ie, validate the basis for ordering the test). 9.2 Documentation of results, therapeutic in-tervention (or lack of), and/or clinical decisions based on the SpO2 measurement should be noted in the medical record. PO 10.0 RESOURCES: 10.1 Equipment: pulse oximeter and related accessories (probe of appropriate size)--the oximeter should have been validated by the manufacturer by a comparison of its values (and consequently its calibration curve) with directly measured oxyhemoglobin saturation.(17,32) 10.2 Personnel: Pulse oximetry is a relatively easy procedure to perform. However, if the procedure is not properly performed or if it is performed by persons who are not cognizant of device limitations or applications, spurious results can lead to inappropriate intervention Level I--personnel trained in the technical operation of pulse oximeters, oxygen delivery devices and related equipment, measurement of vital signs, and record keeping--may perform and record results of pulse oximetry but should be supervised by Level II personnel Level II--health care profes-sionals trained in patient assessment, disorders of acid-base, oxygenation and ventilation, and diagnostic and therapeutic alternatives--evaluate patients and recommend and/or make changes in therapy based on assessment. PO 11.0 MONITORING: The clinician is referred to Section 7.0 Validation of Results. The monitoring schedule of patient and equipment during continuous oximetry should be tied to bedside assessment and vital signs determinations. PO 12.0 FREQUENCY: After agreement has been initially established between SaO2 and SpO2, the frequency of SpO2 monitoring (ie, continuous vs spot check ) depends on the clinical status of the patient, the indications for performing the procedure and recommended guidelines.(14,31) For example, continuous SpO2 monitoring may be indicated throughout a bronchoscopy for detecting episodes of desaturation,(3,31) whereas a spot check may suffice for evaluating the efficacy of continued oxygen therapy in a stable postoperative patient. However, it must be emphasized that direct measurement of SaO2 is necessary whenever the SpO2 does not confirm or verify suspicions concerning the patient s clinical state. PO 13.0 INFECTION CONTROL: No special precautions are necessary, but Universal Precautions (as described by the Centers for Disease Control(33,34)) are recommended If the device probe is intended for multiple patient use, the probe should be cleaned between patient applications according to manufacturer recommendations The external portion of the monitor should be cleaned according to manufacturer s recommendations whenever the device remains in a patient s room for prolonged periods, when soiled, or when it has come in contact with potentially transmissible organisms. Cardiopulmonary Diagnostics Guidelines Committee: Kevin Shrake MA RRT, Chairman, Springfield IL Susan Blonshine RPFT RRT, Lansing MI Robert Brown BS RPFT RRT, Madison WI Robert Crapo MD, Salt Lake City UT Rick Martineau BS RPFT RRT, Reno NV Gregg Ruppell MA RPFT RRT, St Louis MO Jack Wanger MBA RPFT RRT, Denver CO. REFERENCES. Moran RF, Clausen JL, Ehrmeyer SS, Feil M, Van Kessel Al, Eichhorn JH. Oxygen content, hemoglobin oxygen, saturation, and related quantities in blood: terminology, measurement, and reporting. National Committee for Clinical Laboratory Standards 1990; C25-P:10:1-49. Huch A, Huch R, Konig V, Neuman MR, Parker D, Yount J, Lubbers D. Limitations of pulse oximetry. Lancet 1988;1: Schnapp LM, Cohen NH. Pulse oximetry-uses and abuses. Chest 1990;98: Hansen JE, Casaburi R. Validity of ear oximetry in clinical exercise testing. Chest 1987;91: Ries AL, Prewitt LM, Johnson JJ. Skin color and ear oximetry. Chest 1989;96: Shapiro BA, Cane RD. Blood gas monitoring: yesterday, today, and tomorrow. Crit Care Med 1989; 17: Fulmer JD, Snider GL. ACCP-NHLBI National Conference on Oxygen Therapy. Chest 1984;86: Concurrent publication in Respir Care 1984;29: Brown M, Vender JS. Noninvasive oxygen monitoring. Crit Care Clin 1988;4: Welch JP, DeCesare MS, Hess D. Pulse oximetry: instrumentation and clinical applications. Respir Care 1990;35: Jubran, A Tobin MJ. Reliability of pulse oximetry in titrating supplemental oxygen therapy in ventilator-dependent patients. Chest 1990;97: American Society of Anesthesiologists. Standards for basic intraoperative monitoring. ASA Newsletter 1986; 50:12. Joint Commission on Accreditation of Hospitals. Accreditation manual for hospitals. Chicago: JCAH, 1988: Task Force on Guidelines, Society of Critical Care Medicine. Recommendations for services and personnel for delivery of care in a critical care setting. Crit Care Med 1988;16: Task Force on Guidelines, Society of Critical Care Medicine. Guidelines for standards of care for patients with acute respiratory failure on mechanical ventilatory support. Crit Care Med 1991;19: Misiano DR, Meyerhoff ME, Collision ME. Current and future directions in the technology relating to bedside testing of critically ill patients. Chest 1990;97:204S-214S. Hannhart B, Michalski H, Delorme N, Chapparo G, Polu J-M. Reliability of six pulse oximeters in chronic obstructive pulmonary disease. Chest 1991;99: Tremper KK, Barker SJ. Pulse oximetry. Anesthesiology 1989;70: Praud JP, Carofilis A, Bridey F, Lacaille F, Dehan M, Gaultier CL. Accuracy of two wavelength pulse oximetry in neonates and infants. Pediatr Pulmonol 1989;6: ECRI Health Devices Alert, 1990-A-26. Plymouth Meeting PA: ECRI, June 29, Barrington KJ, Finer NN, Ryan CA. Evaluation of pulse oximetry as a continuous monitoring technique in the neonatal intensive care unit. Crit Care Med 1988;16: Cahan C, Decker MJ, Hoekle PL, Strohl KP. Agreement between noninvasive oximetric values for oxygen saturation. Chest 1990;97: Hannhart B, Habberer J-P, Saunier C, Laxenaire MC. Accuracy and precision of fourteen pulse oximeters. Eur Respir J 1991;4: Severinghaus JW, Naifeh KH. Accuracy of response of six pulse oximeters to profound hypoxia. Anesthesiology 1987;67: Severinghaus JW, Naifeh KH, Koh SO. Errors in 14 pulse oximeters during profound hypoxia. J Clin Monit 1989;5: Veyckemans F, Baele.P, Guillaume JE, Willems E, Robert A, Clerbaux T. Hyperbilirubinemia does not interfere with hemoglobin saturation measured by pulse oximetry. Anesthesiology 1989;70: Chelluri L, Snyder JV, Bird JR. Accuracy of pulse oximetry in patients with hyperbilirubinemia. Respir Care 1991;36: Goldenheim PD, Kazemi H. Cardiopulmonary monitoring of critically ill patients. N Engl J Med 1984; 311: King T, Simon RH. Pulse oximetry for tapering supplemental oxygen in hospitalized patients: evaluation of a protocol. Chest 1987;92: Chapman KR, Liu FL, Watson RM, Rebuck AS. Range of accuracy of two wavelength oximetry. Chest 1986;89: Cheng EY, Hopwood MB, Kay J. Forehead pulse oximetry compared with finger pulse oximetry and arterial blood gas measurement. J Clin Monit 1988;4: Ries AL. Position paper of the American Association of Cardiovascular and Pulmonary Rehabilitation. J Cardiopul Rehab 1990;10: Zaloga GP. Evaluation of bedside testing options for the critical care unit. Chest 1990;97(5, Suppl):175S-190S. Centers for Disease Control. Update: universal precautions for prevention of transmission of human immunodeficiency virus, hepatitis B virus, and other bloodborne pathogens in health care settings. MMWR 1988;37: Boyce JM, White RL, Spruill EY, Wall M. Cost-effective application of the Centers for Disease Control guidelines for prevention of nosocomial pneumonia. Am J Infect Control 1985;3: Interested persons may copy these Guidelines for noncommercial purposes of scientific or educational advancement. Please credit AARC and Respiratory Care Journal.")
35
Haemoglobin Mammalian hemoglobins have molecular weights of about 64,500. Composed of four peptide chains called globins each of which is bound to a heme. Normal human hemoglobin is composed of a pair of two identical chains. Iron is coordinated to four pyrrole nitrogens of protoporphyrin IX, and to an imidazole nitrogen of a histidine residue from the globin side of the porphyrin. The sixth coordination position is available for binding with oxygen and other small molecules. Called oxyhemoglobin, HbO2 in the oxygenated form and carboxyhemoglobin, HbCO, when the oxygen is displaced by carbon monoxide. Binds reversibly with oxygen while the heme iron remains in the ferrous state. Autoxidation is prevented by the cover of hydrophobic groups of the globin. When the iron in hemoglobin is oxidized from the ferrous to the ferric state the compound is called methemoglobin and is accompained by loss of oxygen-binding capacity.

36
Haemoglobin with 4 O2 Fe O2 heme Fe O2 Fe O2 heme heme Fe O2 heme

37
Haemoglobin with 3 O2 Fe O2 heme Fe Fe O2 heme heme Fe O2 heme globin

40
Acidosis > Hb unable to hold as much O2 > more O2 lost to tissues

41
Acidosis > Hb unable to hold as much O2 > more O2 lost to tissues

42
Clip-type Probe

43
Clip-type Probe Probe

44
Low SpO2 … Decrease in arterial SO2 Poor circulation
Oxygen deficiency O2 delivered from tank? ET tube – intubated, connected and sealed properly Poor circulation Vasoconstriction Pain stimulus Cardiac depression Deep anaesthesia, bradycardia, arrhythmia Low blood volume Probe interference (see later)
")
45
Interpreting SpO2 % Normally good if > 95%
Should remain at least > 90-92% If <92% look for a problem Ok at 92% if otherwise stable and nothing else can be done to improve oxygenation Cyanosis not apparent until at least <85% Risk of some hypoxic organ injury if < 90% Severe organ injury if < 60%

46
Probe interference Tight clips Patient movement Hair Tissue pigment
Tissue compressed by clips (>no blood) May need to move periodically, especially in small animals like cats Patient movement Hair Tissue pigment Dry tongue Add moisture
 May need to move periodically, especially in small animals like cats. Patient movement. Hair. Tissue pigment. Dry tongue. Add moisture.")
47
Pain! Pain, (tugging on ovaries, clamping uterus etc), causes:
Sympathetic response Vasoconstriction Pulse pressure may disappear Pulse oximeter may not read a pulse! Alarm goes off

48
Normal SpO2 … Does not mean that blood CO2 is also normal
Animals regulate their breathing rate mainly according to CO2, not O2 Why is this so?

49
SpO2 & Anaemia If very low PCV (say <15%), one can have normal Hb saturation (>90%) but there may not be enough total oxygenated Hb to prevent hypoxaemia and hence tissue hypoxia
, one can have normal Hb saturation (>90%) but there may not be enough total oxygenated Hb to prevent hypoxaemia and hence tissue hypoxia.")
50
Hypoxaemia defined… True arterial oxygen saturation (SaO2) < 90% or PCV < 15 %
 < 90% or PCV < 15 %")
51
When is SpO2 too low? SpO2 Interpretation 95 % Normal 92 %
Start looking for a reason 90 % Hypoxaemia present Try to improve oxygenation 85 % Moderate to severe hypoxaemia Lowest acceptable 85(dogs),87(cats) 80 % Life-threatening hypoxaemia
,87(cats) 80 % Life-threatening hypoxaemia.")
52
Blood gases Oxygen Carbon dioxide
Blood sample measuring total O2 in blood plasma (Normal 85 – 105 mm Hg ) Arterial Oxygen Pressure = PaO2 Is different from measuring O2 in haemoglobin Needs rapid processing Equipment expensive Carbon dioxide
 Arterial Oxygen Pressure = PaO2. Is different from measuring O2 in haemoglobin. Needs rapid processing. Equipment expensive. Carbon dioxide.")
53
Blood Pressure Arterial blood pressure Venous blood pressure Systolic
Heart contraction phase Diastolic Heart relaxation phase Mean arterial A calculated value = 1/3 systolic pressure + 2/3 diastolic pressure Venous blood pressure Central (Right atrial ~ Deep jugular pressure) Peripheral
 Peripheral.")
54
Blood Pressure Units Measured by weight of column of fluid
High pressure use heavy liquids like mercury (Hg) Low pressure use lighter liquids like water (H2O)
 Low pressure use lighter liquids like water (H2O)")
55
Normal Blood Pressures
Systolic (dog & cat) 100mm Hg Diastolic 80mm Hg Problems with organ function if <90/60 for any length of time i.e. 100/80
 100mm Hg. Diastolic. 80mm Hg. Problems with organ function if <90/60 for any length of time. i.e. 100/80.")
56
Blood Pressure Devices
Using an occlusive pneumatic cuff Generally around any accessible artery e.g. distal to elbow/hock or on base of tail Cuff width should be 40% of circumference Types Doppler ultrasonic device such as the Parks Doppler Detects arterial blood flow Pulse rate Systolic arterial pressure Oscillometric devices –such as the Dinamap Estimates HR, systolic, diastolic & mean pressures Very accurate if used in large/medium dogs Pressure detected by the cuff bladder

57
Doppler Blood Pressure

59
Parks Doppler directions
Apply cuff so that the portion containing the occlusive bladder is over the artery to be occluded Apply the Doppler transducer crystal over the artery but distal to the cuff & tape it snugly to the appendage

60
Parks Doppler directions
Orientate the crystals so that they are perpendicular to the artery ( the artery must cross both the transmitting and receiving crystals) Turn on the unit and listen for pulsatile blood flow If the sound is not audible reposition the crystal
 Turn on the unit and listen for pulsatile blood flow. If the sound is not audible reposition the crystal.")
61
Parks Doppler directions
Connect the sphygmomanometer to the cuff (scale 0-300mm Hg) Inflate cuff until the blood flow can no longer be heard Slowly open the valve so that the cuff gradually deflates, until blood flow can again be heard with each heart beat The pressure on the manometer at this time is the systolic blood pressure
 Inflate cuff until the blood flow can no longer be heard. Slowly open the valve so that the cuff gradually deflates, until blood flow can again be heard with each heart beat. The pressure on the manometer at this time is the systolic blood pressure.")
62
Parks Doppler Be sure to deflate the cuff so that no pressure remains in it between readings If the cuff remains pressurised it will restrict blood flow to the limb causing catecholamine release and cardiovascular stimulation In cats the Doppler tends to underestimate the systolic blood pressure therefore add 15 mm Hg to the reading

63
Minute Respiratory Volume
Ventilation Monitors Respiratory Rate Apalert© Expired CO2 Capnograph Minute Respiratory Volume Wrights Respirometer

64
Monitoring Ventilation
Movement of thorax Movement of rebreathing bag Auscultation (e.g. oesoph. stethoscope) Condensation within ET tube Movement hair/fluff at open end of ET tube Respiration/apnoea monitors
 Condensation within ET tube. Movement hair/fluff at open end of ET tube. Respiration/apnoea monitors.")
65
Respiration/Apnoea Monitor
Apalert® Alerts if apnoea Connects to the ET tube and detects changes in gas temperature from inspiration to expiration Gives an audible signal

66
Apnoea monitor Detects temperature change of exhaled air
Thermistor wont work if exhaled air is cool

67
Respiratory Rates To measure RR Normal: 10-20 breaths/min Chest rises
Rebreathing bag movements Apnoea monitor Normal: breaths/min If <8 breaths/min look for a problem Inform vet May need to bag patient to maintain at least 8-12 breaths/min

68
Normal respiration cycle
Inspiration 1-1½ sec Expiration 2-3 sec

69
Hyperventilation under GA
Stimulated by either Pain of Surgery Usually only temporary Usually self-limiting because patient draws in more anaesthetic gas High CO2, possibly caused by Poor ventilation Exhausted soda lime Lightening anaesthesia

70
Apneustic respiration
Prolonged pauses after inspiration, followed by expiration Seen with dissociative anaesthetics (like Ketamine)
")
71
Other respiration problems
Increased effort in inspiration Upper airway obstruction Increased effort in expiration Lung problem Abnormal noises Whistles Squeaks Crackles

72
Respiratory sighs With increasing GA some air sacs may not receive enough air to remain inflated collapse of air sacs (alveoli) = atelectasis Can reinflate these air sacs by gently bagging patient every 5 mins or so Close pop-off Squeeze bag gently so chest wall rises slightly Re-open pop-off valve

73
Capnography Monitoring pulmonary ventilation
Pulmonary ventilation (minute ventilation) = Respiratory Rate (f) x Tidal Volume (VT) Normal respiratory rate (f) 10 – 20 breaths / min Normal tidal volume (VT) 10 – 20 mL / kg Normal minute ventilation 200 mL / kg / min Capnometry measuring CO2 concentration in a gas mixture Capnography graphical display of changes in CO2 concentration over time
 = Respiratory Rate (f) x Tidal Volume (VT) Normal respiratory rate (f) 10 – 20 breaths / min. Normal tidal volume (VT) 10 – 20 mL / kg. Normal minute ventilation. 200 mL / kg / min. Capnometry. measuring CO2 concentration in a gas mixture. Capnography. graphical display of changes in CO2 concentration over time.")
74
Principles CO2 moves easily across the alveolar membranes and rapidly equilibrates between the blood and alveolar compartment In the absence of ventilation-perfusion impairment, CO2 concentration in alveoli is almost the same as concentration in arterial blood (Arterial CO2 is about 5 mmHg higher than alveolar CO2) During general anaesthesia, the difference is larger (~10 mmHg) Highest concentration of CO2 should occur at the sampling site at the end of expiration (end tidal = ET) Samples of gas are continuously aspirated by capnograph Infrared analyser determines the CO2 concentration Sampling port placed between breathing circuit and ET tube adaptor (150 – 300 ml / min) Sampling site should be as close as possible to the patient in order to minimize dead space as much as possible
 During general anaesthesia, the difference is larger (~10 mmHg) Highest concentration of CO2 should occur at the sampling site. at the end of expiration (end tidal = ET) Samples of gas are continuously aspirated by capnograph. Infrared analyser determines the CO2 concentration. Sampling port placed between breathing circuit and ET tube adaptor (150 – 300 ml / min) Sampling site should be as close as possible to the patient in order to minimize dead space as much as possible.")
75
Capnography (Expired CO2)
Corresponds with alveolar and therefore arterial CO2 Also measures RR Conscious animals = 40mm Hg Anaesthetised dogs = 40-50mm Hg Hypoventilation > 55 mm Hg Used in anaesthesia and critical care, these monitors sample gas from the endotracheal tube adapter and track the inspired/expired CO2 wave form. From this the monitor can determine the respiratory rate, the inspired CO2 (normally zero) and the C02 concentration at the end of expiration ("End-Tidal or ET CO2); normally equivalent to the arterial CO2. In conscious animals this is usually around 40 mm Hg. During anaesthesia, ET CO2 increases in a linear fashion with increasing anaesthetic depth to 50 or 60 mm Hg in dogs and horses respectively. ET CO2 monitors should display the CO2 wave form in order to know that the sample is accurate. ET CO2 monitors do require calibration and maintenance.
 and the C02 concentration at the end of expiration ( End-Tidal or ET CO2); normally equivalent to the arterial CO2. In conscious animals this is usually around 40 mm Hg. During anaesthesia, ET CO2 increases in a linear fashion with increasing anaesthetic depth to 50 or 60 mm Hg in dogs and horses respectively. ET CO2 monitors should display the CO2 wave form in order to know that the sample is accurate. ET CO2 monitors do require calibration and maintenance.")
76
Capnography

77
Using capnography Sampling Maintenance
Should be done from a site as close as possible to minimize dead space Sample adaptor is most commonly placed between the ET tube adapter and breathing circuit Non-rebreathing circuit with high fresh gas flow Dilutes ETCO2 Sampling via a hypodermic needle inserted through and into the lumen of ET tube will provide more reliable readings Maintenance After use Allow to run for a while so that the tubing can dry out Clean and dry water traps Sampling gases is continuous and also contains anaesthetic gases Gases can be routed back into the breathing circuit in order to minimize environmental pollution and loss of gases from breathing circuit

78
Capnogram (‘CO2-ogram’)
Expiration Inspiration II I III a b O Normal patient

79
Capnogram I = Inspiratory baseline II = Expiratory upstroke
Expiration Inspiration III II O I I = Inspiratory baseline Fresh gas containing no CO2 passing through analyse II = Expiratory upstroke Begin of exhalation Dead space elimination from respiratory tract CO2 concentration is increasing as alveolar air is reaching analyse III = Expiratory plateau Exhalation of pure alveolar gas O = Inspiratory downstroke Start of inhalation Fresh gas “washing away” CO2 of gases from previous exhalation

80
High CO2 (hypr-capnia) Most common cause- Less common cause Rare
Inadequate removal, in relation to CO2 production, of alveolar CO2 due to hypoventilation Less common cause Inadequate removal of CO2 from breathing circuit, e.g. Exhausted soda lime Inadequate fresh gas flows in non-rebreathing circuits Rare Abnormally high CO2 production, e.g. Fever Malignant hyperthermia

81
Sudden drop in ET-CO2 Sudden decrease in ETCO2 Apnoea
Patient extubation Obstruction of ET tube / breathing system Abnormalities in pulmonary blood flow Cardiac arrest Decrease in cardiac output Obstruction of pulmonary artery / branches Pulmonary embolism Surgical manipulation Air embolism Water / secretions accumulating within and obstructing sampling tubing

82
Low CO2 (hypo-capnia) Ventilation of alveoli is increased (hyperventilation) removing CO2 at an abnormally high rate and exceeding rate of production False low CO2 readings occur in Tachypnoea Alveolar gases are incompletely exhaled and/ or diluted by dead space gases and the response time of the analyser may be too slow Use of non-rebreathing circuits using high fresh gas flows High fresh gas flows may wash out the end tidal gases and dilute them

83
Interpreting the curve
Elevated baseline = Rebreathing of CO2 Partial exhaustion of soda lime Incompetent expiratory one-way valve Slanted upstroke Slow expiration Uneven emptying of alveoli Partially obstructed ET tube / expiratory tube of breathing circuit Airway narrowing COPD Asthma Bronchospasm Abnormal plateau Normal height = 35 – 44 mmHg Elevation Hypoventilation Hyperthermia Abnormally low Hyperventilation Ventilation perfusion (P/Q) mismatch + elevated arterial CO2
 mismatch + elevated arterial CO2.")
84
Interpreting the curve
Irregular plateau Surgical manipulation of chest / abdomen small volumes of air moving in and out of lungs Cardiac oscillation movement of pulmonary vasculature during cyclic filling and emptying pushes gas in and out of the lungs Artificial ventilation Patient is trying to fight ventilation a cleft may appear in the expiratory plateau Slanted inspiratory downstroke Airway obstruction Obstruction caused by surgeon leaning on chest Prolonged inspiratory downstroke Faulty inspiratory one-way valve

85
Capnography Summary Normal ETCO2 High ETCO2 (>55mmHg) Low ETCO2
Hypoventilation Low ETCO2 Low, abnormally high / normal PaCO2 Normal capnogram is a “square wave” Sudden changes in ETCO2 and in the waveform may be due to problems with Patient Endotracheal tube Breathing circuit Sampling system

86
ECG Electrical activity of the heart
Cardiac rhythm disturbances Ventricular premature contractions (VPCs) Atrial fibrillation Ventricular tachycardia Ventricular fibrillation Asystole But cannot rely on this - can have a normal ECG and not have an effective heart muscle contraction! (EMD=electro-myographic dissociation) Electrical interference may be a problem Expensive?
 Atrial fibrillation. Ventricular tachycardia. Ventricular fibrillation. Asystole. But cannot rely on this - can have a normal ECG and not have an effective heart muscle contraction! (EMD=electro-myographic dissociation) Electrical interference may be a problem. Expensive")
87
Electrocardiogram ECG (or EKG)
With each heartbeat atria & ventricles cell membranes depolarise and repolarise – the electrical waves produced are measured on the surface of the body

88
Electrocardiogram The wave is recorded as a voltage difference between 2 electrodes in various positions: Lead I = Left arm to Right arm Lead II = Right arm to Left leg (MOST USEFUL) Lead III = Left arm to Left leg
 Lead III = Left arm to Left leg.")
89
ECG Leads All ‘Leads’ are applied at the start
A switch on the machine selects which are being used to measure voltage Various clips used to attach to skin Alligator Human Various contacts +/- clip hair To improve conduction ECG gel, or K-Y gel, or Methylated spirit

90
Alligator clips (not too tight!)
")
91
ECG Hold (R side down)
")
92
4 Cables but 6 ‘Lead’ Combinations

93
Typical Lead II ‘trace’

94
Usefulness of ECG in GA ECG only gives electrical performance of heart, not the muscular performance and so is not to be relied upon A heart can have a normal ECG but not be contracting properly e.g. in ‘electro-myocardial dissociation (EMD)’
’")
95
Temperature Place a probe oesophageal or rectally for continuous monitoring Hypothermia Causes prolonged recovery from GA Most heat loss in 1st 20 mins Small animals most susceptible Heat injury Heating mats Hot water bottles not wrapped in towel Note that a hot wet towel can scald skin

96
Warmth post op Heat mats Heat lamps Heat blanket Hot H2O bottles
Hot oat bags

97
Overheating Problems Prevention of overheating Burns Overheating
‘Shock’ – due to vasodilation Prevention of overheating Monitor body temperature frequently Do not leave patient unattended Take away thermal support equipment once the body temperature reaches 38.5oC

98
Many reasons to get cold
Loss of brain thermoregulation Vasodilating tranquillisers & anaesthetics Cold tables Skin prep solutions (alcohol) Open body cavities Reduced metabolic rate
 Open body cavities. Reduced metabolic rate.")
99
‘Tissue Hypoxia’ The major concern in anaesthesia Causes include
O2 supply (poor respiration) blood O2 blood supply (poor perfusion) cardiac output
 blood O2. blood supply (poor perfusion) cardiac output.")
100
Note Use as many methods and signs to assess the patient do not rely on one!!!

101
The VN More valuable to the vet than all the monitoring equipment combined Helen Keates # I * 5 *

102
The End

Similar presentations


 Pulse (P) Respiration (R) Blood pressure (BP) Pain (often called the fifth vital sign) Oxygen Saturation.>")
