Download presentation
Presentation is loading. Please wait.

1
Introduction to the quadratic function

2
1.1 Characteristics of a Function
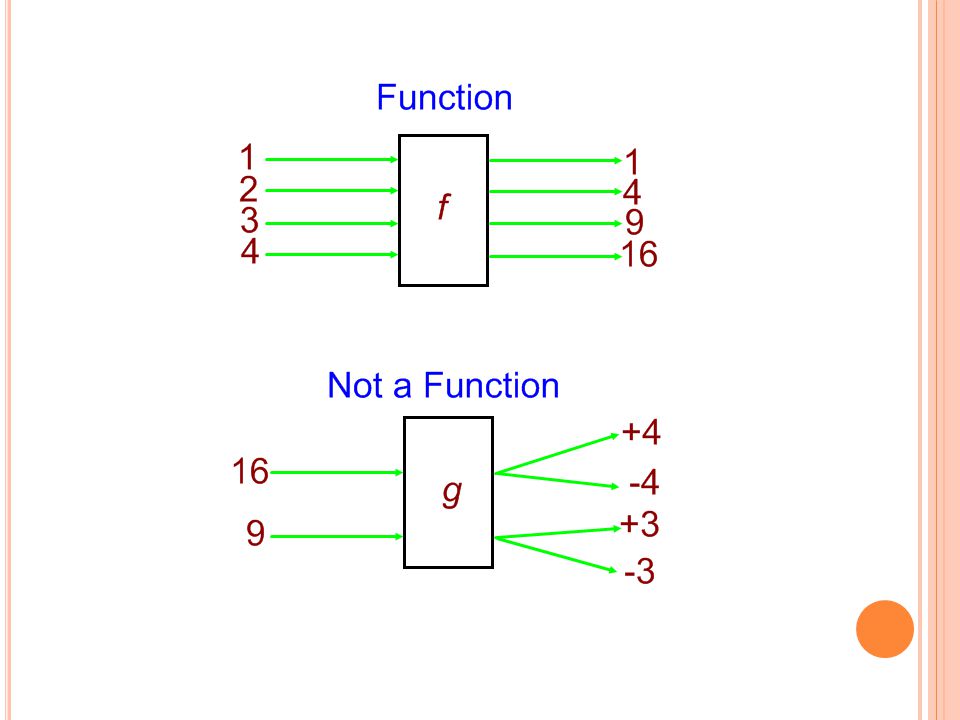
A relation is a rule describing the relationship between two variables, an independent and a dependent variable. A function is a relation is which each value of the independent value has one unique value for the corresponding dependent variable's value.

4
All of the elements that are input into the function make up the Domain of that function. (This is the set of x's, or the independent variables.) All of the elements that are output by the function make up the Range of that function. (This is the set of y's, or the dependent variables.)
")
5
We use set notation to state the domain and range of a function.
eg. For function f above: Domain = {1, 2, 3, 4} Range = {1, 4, 9, 16}

6
Ways of Representing functions
There are many ways to represent a function! 1. A Table of Values Domain = {1, 2, 3, 7} Range = {5, 6, 8} (it is not necessary to write 8 twice!) x y 1 5 3 8 7 6 2
 x. y")
7
Be careful though... not all tables represent functions
This is not a function because when 1 is input you don't know whether a -2 or a 5 will be output! x y 1 -2 3 4 5 2 7

8
2. A Set of ordered points f = {(1,-4), (2,5), (8, 9), (0, 6)} Domain = {0, 1, 2, 8} Range = {-4, 5, 6, 9} Is the set of ordered points represented by g = {(1, -3), (2, -3), (3, 0), (2, 0)} a function?
, (2,5), (8, 9), (0, 6)} Domain = {0, 1, 2, 8} Range = {-4, 5, 6, 9} Is the set of ordered points represented by g = {(1, -3), (2, -3), (3, 0), (2, 0)} a function.")
9
g = {(1, -3), (2, -3), (3, 0), (2, 0)} No it is not a function because when 2 is input you don't know whether a -3 or a 0 will be output!
, (2, -3), (3, 0), (2, 0)} No it is not a function because when 2 is input you don t know whether a -3 or a 0 will be output!")
10
3. A Mapping Diagram Domain = {0, 2, 4, 6, 8} Range = {-2, -1, 1, 3, 4} What would a mapping diagram look like for a relation that is not a function?

11
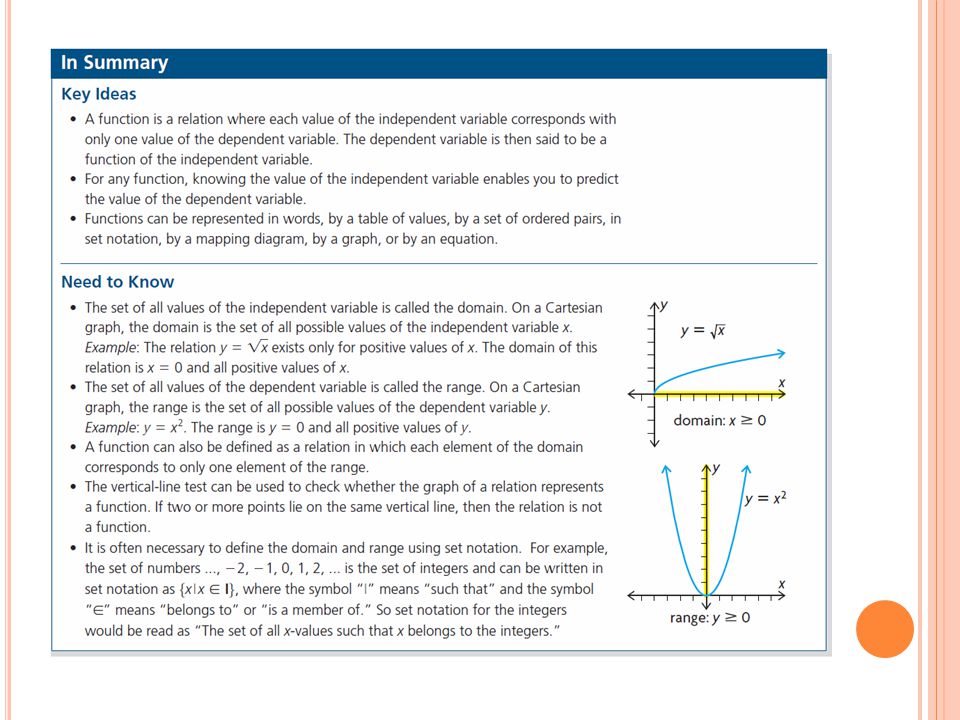
4. Graphs How can you tell if a graph represents a function
4. Graphs How can you tell if a graph represents a function? By definition of a function every x- value has only one y-value associated with it. Vertical Line Test If a vertical line placed anywhere on top of the graph crosses the graph more than once, the graph is not a function. (Because there is more than one y-value associated with that x- value.)
")
12
Which of the following graphs represent functions?

13
5. Equations How can you tell if an equation represents a function? All lines that can be written in the form y=mx+b are functions. All parabolas that can be written in the form y=ax2 + bx + c are functions. If you aren't sure you can graph it and use the vertical line test!

14
If the equation is a function it will often have a function name. i. e
If the equation is a function it will often have a function name... i.e. it will be written in "function notation" eg. y = 2x - 1 would be “renamed” f(x) = 2x -1 We read this as “f of x” which means that this function named f depends on the value of the variable x.
 = 2x -1. We read this as f of x which. means that this function named f depends on the value of the variable x.")
15
Homework: Page 13 #1 – 7, 10, 11, 12

Similar presentations

 = ax2 + bx + c and f(x) = a(x – h)2 + k. c. Investigate and explain characteristics.>")


 Functions, Rules, Tables and Graphs>")


,(-2,8),(-3,8),(0,-6) } The.>")


