Download presentation
Presentation is loading. Please wait.

1
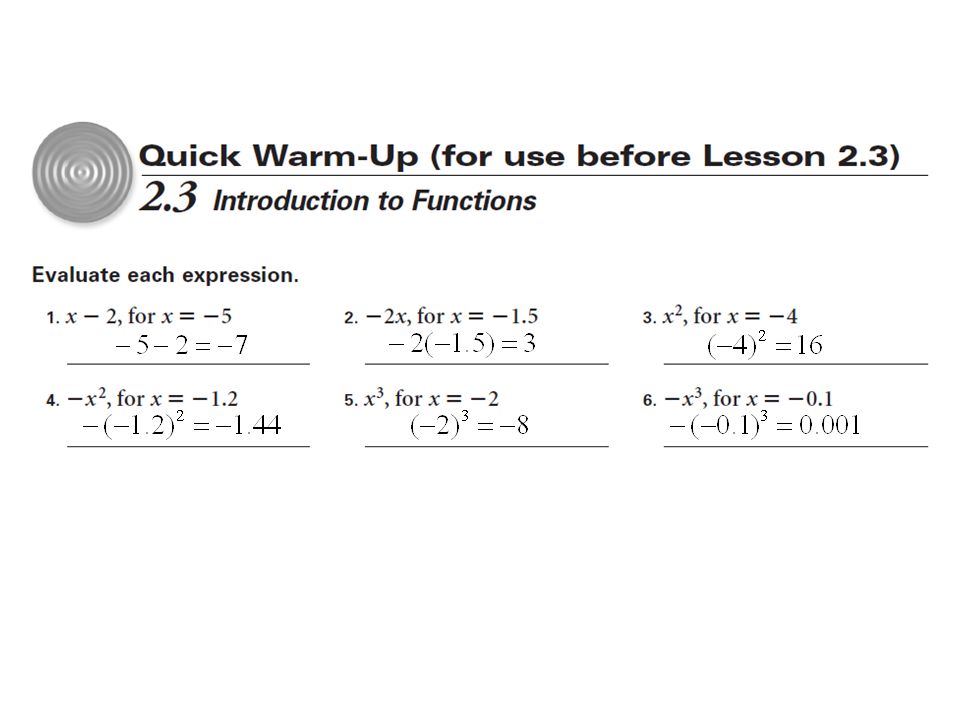
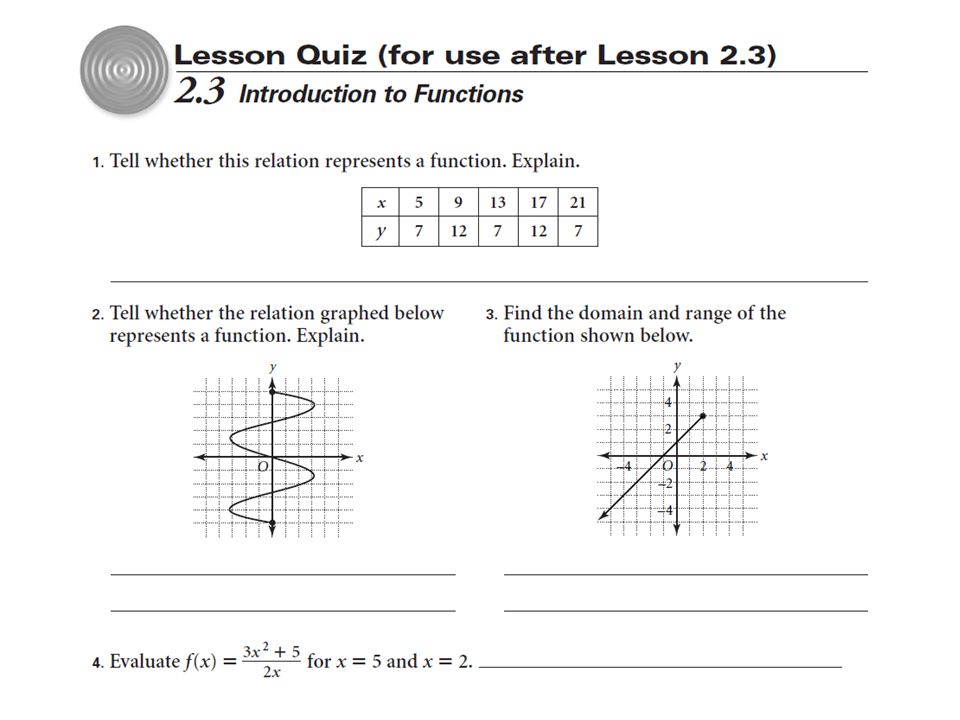
Introduction to Functions
Objective: State the domain and range of a relation and tell whether it is a function.

4
Functions A function is a relationship between two variables such that each value of the first variable is paired with exactly one value of the second variable.

5
Functions A function is a relationship between two variables such that each value of the first variable is paired with exactly one value of the second variable. The first variable (usually x) is called the domain of the function. The second variable (usually y) is called the range of the function.
 is called the domain of the function. The second variable (usually y) is called the range of the function.")
6
Functions A function is a relationship between two variables such that each value of the first variable is paired with exactly one value of the second variable. The first variable (usually x) is called the domain of the function. The second variable (usually y) is called the range of the function. For every value of x, there is one and only one value for y.
 is called the domain of the function. The second variable (usually y) is called the range of the function. For every value of x, there is one and only one value for y.")
7
Example 1

8
Example 1

9
Example 1

10
Try This State whether the data in each table represents a function.

11
Try This State whether the data in each table represents a function.
yes

12
Try This State whether the data in each table represents a function.
yes yes

13
Try This State whether the data in each table represents a function.
yes yes no

14
Vertical Line Test Remember that a vertical line is a line with the equation x = c, where c is an arbitrary constant. All points on the line have the same x-coordinate. If a vertical line crosses a graph more than once, that means for that one value of x there will be more than one value for y.

15
Vertical Line Test Remember that a vertical line is a line with the equation x = c, where c is an arbitrary constant. All points on the line have the same x-coordinate. If a vertical line crosses a graph more than once, that means for that one value of x there will be more than one value for y. If every vertical line intersects a graph at no more than one point, then the graph represents a function.

16
Example 2

17
Definition of a Relation
A relationship between two variables such that each value of the first variable is paired with one or more values of the second variable is called a relation. The domain is the set of all possible values of the first variable. The range is the set of all possible values of the second variable.

18
Example 4

19
Example 4

20
Try This

21
Try This

22
Function Notation

23
Function Notation

24
Example 5

25
Example 5

26
Example 6

27
Example 6

29
Homework Pages 17-49 odd

Similar presentations


 Functions, Rules, Tables and Graphs>")
, (-4,5), (0,2) }>")


, #61-85 (EOO)>")


 where each domain (input) has exactly one range.>")


