Download presentation
Presentation is loading. Please wait.

1
THE GLOBAL CAFE ~ The global patterns of the coffee industry

2
What are global patterns?
A pattern is how a feature or activity is distributed across an area (space). Define in your own words what you think a global pattern is. A global pattern is a pattern that occurs across different hemispheres and or regions i.e. it is not localised to only one or a few small places in the world.
. Define in your own words what you think a global pattern is. A global pattern is a pattern that occurs across different hemispheres and or regions i.e. it is not localised to only one or a few small places in the world.")
3
What are global patterns?
In this standard you will have to describe: The global pattern The factors that have caused it The ways in which the pattern impacts people

4
Which of the following are not global patterns?
Tropical Cyclones Polar Bear habitats NATO Members Mc Donalds restaurants

5
Describing global patterns
Describe what the pattern looks like: Pattern Concentrated Dispersed/ scattered Grouped/ clustered Linear Random Regular

6
Describing global patterns
Describe where the pattern occurs and/or where it does not. Use specific details: Describing where Hemispheres Named Continents Using Latitudes Physical Geography Links to other Patterns/ Features: Natural & Human

7
Describing global patterns
Worked example: Global Internet usage From The Atlas of Inequality, University of California Internet usage varies across the globe. The highest use is concentrated mostly in more economically developed regions such as North America, Europe, Japan, Australia and NZ. Much of Africa and Asia have very low internet usage. These regions tend to be less developed.

8
Describing global patterns
Your turn: Global pattern of facebook users Remember to describe what the pattern looks like and where it is. Also think about where it is not and what other things it could be related to, to help describe the pattern.

9
Describe the factors that cause the pattern
Think about the factors that have helped to cause the pattern or which may have limited or prevented it from going somewhere. Factors may be Natural or Cultural (Human) Factors Natural Climate Landforms Relief/ Soils/ Geology Vegetation Factors Cultural & Resources Economic Social/ Political
 Factors. Natural. Climate. Landforms. Relief/ Soils/ Geology. Vegetation. Factors. Cultural. & Resources. Economic. Social/ Political.")
10
Describe the factors that cause the pattern
Worked example: Global Internet usage Natural factors Cultural factors Areas that are flat or don’t have harsh climates, terrain are easier to build infrastructure needed. Eg. Coastal USA, Plains of Europe Landscapes that are difficult to build or access such as deserts or jungles. E.g. Sahara desert, Amazon Rainforest etc Countries that are highly urbanised as cities make it easier to connect people. Eg UK 90%,NZ 87%, USA 82% urban. Wealthy or developed countries can afford to build infrastructure to support the internet but poorer countries can not Eg.Japan’s GDP per person is$US but Kenya $US 809 pp.

11
Describe the factors that cause the pattern
Your turn: Global pattern of Facebook users Remember to elaborate on your factors and to support them with specific information. Information should be global in nature not just for one location/region.

12
The significance for people
Describe how the pattern impacts on people (their economic and social activities) in positive or negative ways. Sort out the possible list of impacts on the following slide into positive and negative impacts. Then colour code the impacts as either social or economic.
 in positive or negative ways. Sort out the possible list of impacts on the following slide into positive and negative impacts. Then colour code the impacts as either social or economic.")
13
The significance for people
Understanding of our world Managing resources Increased poverty Greater opportunities to trade pollution Economic growth Managing natural hazards Employment opportunities Development inequalities urbanisation globalisation Improved education Increasing energy consumption Poor health conditions Environmental degradation Spread of new ideas Pandemics Crime Exploitation Global cooperation

14
The significance for people
Your turn: Global pattern of Facebook users Brainstorm some ideas as to the significance this pattern to people. Remember to elaborate on your factors and to support them with specific information. Information should be global in nature not just for one location/region.

15
The Global Cafe Largest producers of Coffee 30+ 5 - 15 1 – 5 <1
Millions of 60kg sacks 30+ 5 - 15 1 – 5 <1 Remember to describe what the pattern looks like and where it is. Also think about where it is not and what other things it could be related to, to help describe the pattern. Information must be across hemispheres and/or regions

16
The Global Café - Patterns
Top 10 World Coffee Producers 2008/09 Brazil (Bags – Million) Vietnam 18.5 Colombia 9.5 Indonesia 9.4 Mexico 4.7 India 4.4 Ethiopia Peru 3.9 Guatemala 3.4 Honduras 3.0 On a copy of the Coffee producers map, label the Top 10 producers listed her using an atlas to help you. What Pattern(s) can you identify from your completed map? Remember to describe what the pattern looks like and where it is. Also think about where it is not and what other things it could be related to, to help describe the pattern.
 Vietnam Colombia Indonesia Mexico India Ethiopia. Peru Guatemala Honduras On a copy of the Coffee producers map, label the Top 10 producers listed her using an atlas to help you. What Pattern(s) can you identify from your completed map Remember to describe what the pattern looks like and where it is. Also think about where it is not and what other things it could be related to, to help describe the pattern.")
17
Where is Coffee produced?
Add the following data to your choropleth map. What does it tell you about the pattern of global coffee production? World Coffee Production Country % Brazil 32 Vietnam 16 India 8 Columbia

18
Where is Coffee produced?
Coffee is grown in areas between the latitudes of 25º north and 25º south of the equator. i.e. it is a tropical plant. Like many natural products, coffee is grown between these latitudes due to both Natural and Cultural factors.

20
Natural Factors - Copy Coffee requires very specific environmental conditions for large scale growing. Temperature, rainfall, sunlight, wind and soils are all important natural factors enabling successful growing of coffee Using the resource page provided, add some specific details to support the above statement.

21
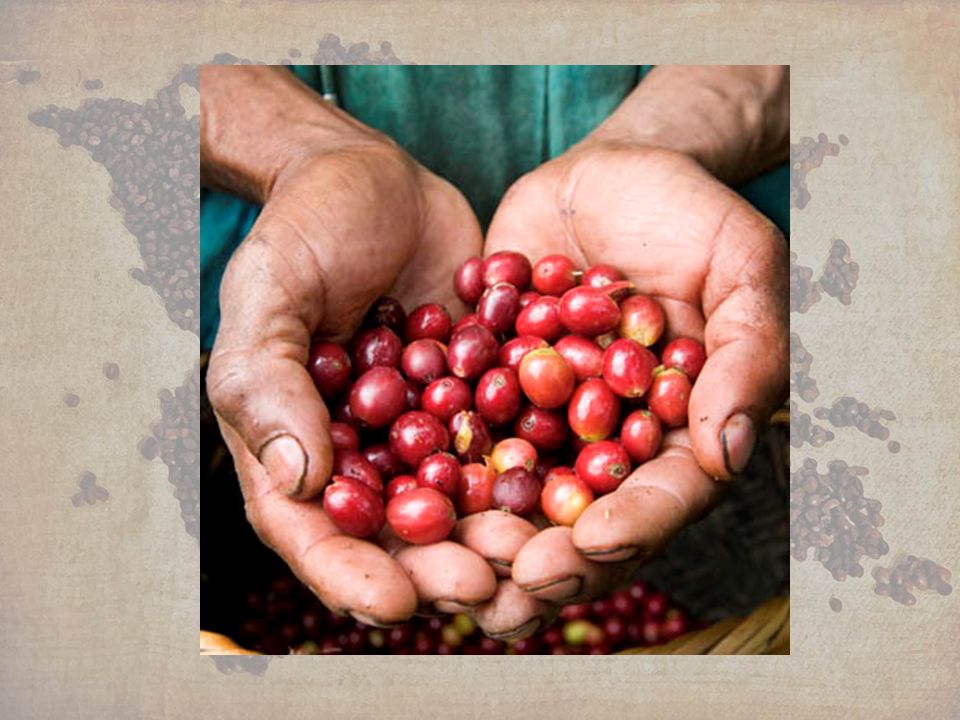
Cultural Factors Wealth and Colonialism
Write a caption underneath each of the five images outlining the spread of coffee globally.

22
Where does the coffee go?
Largest Importers of Coffee 20+ 5 - 10 2 - 5 1 – 2 <1 Millions of 60kg sacks Describe the pattern of coffee imports Remember to describe what the pattern looks like and where it is. Also think about where it is not and what other things it could be related to, to help describe the pattern. Information must be across hemispheres and/or regions

23
The Global Café - Consumers
10+ 8 - 10 6 - 8 4 - 6 Annual kgs per person Largest consumers of Coffee per person Describe the pattern of coffee consumers. Remember to describe what the pattern looks like and where it is. Also think about where it is not and what other things it could be related to, to help describe the pattern. Information must be across hemispheres and/or regions

24
Cultural factors cause these patterns
Global GDP per capita in $US (2005)
")
25
Cultural factors cont.. Who gets what?
The price for a cup of coffee in the US exceeds half the daily income of many small-scale coffee farmers. Workers on large coffee plantations often earn less than $2.00/day. In New Zealand the price for a cup of coffee is around $4.00.

26
Cultural factors cont.. Using the map of GDP per capita and the ‘Who gets what’ graphic briefly explain how wealth levels might contribute to the patterns shown on the maps of coffee importation and consumption? HINT – Incomes levels are important at both the production and consumption level.

27
The Significance of Coffee as a global commodity
Why is coffee important and how does it affect the lives of people?

28
The significance for people
Do you think this little guy is cute?

29
The significance for people
Well if you drink coffee you might be murdering him!

30
The significance for people
Understanding of our world Managing resources Increased poverty Greater opportunities to trade pollution Economic growth Managing natural hazards Employment opportunities Development inequalities urbanisation globalisation Improved education Increasing energy consumption Poor health conditions Environmental degradation Spread of new ideas Pandemics Crime Exploitation Global cooperation

31
The significance for people
Your teacher will assign different pairs a different page to read (either pg 6 or 7). From the page you’ve read, decide from the impacts grid which category it best fits under. Write this category as a heading and then briefly explain what the impact is, whether it is positive or negative and find some specific evidence (stats, facts) to support it. Swap your information with your neighbour, discuss as a class.
. From the page you’ve read, decide from the impacts grid which category it best fits under. Write this category as a heading and then briefly explain what the impact is, whether it is positive or negative and find some specific evidence (stats, facts) to support it. Swap your information with your neighbour, discuss as a class.")
32
The significance for people
There are other impacts for people as a result of the global coffee trade. You need to have at least 3 impacts (positive or negative) that are well supported with global examples to gain Excellence. For homework read the case study from Costa Rica, pgs for other ideas. This can be found on Knowledgenet at Use your school log on and password (DOB) to access this.
 that are well supported with global examples to gain Excellence. For homework read the case study from Costa Rica, pgs for other ideas. This can be found on Knowledgenet at Use your school log on and password (DOB) to access this.")
Similar presentations