Download presentation
Presentation is loading. Please wait.

1
Biological Monitoring of Water Quality
“the totality of features and characteristics of water that bear upon its ability to support an appropriate natural fauna, and to sustain legitimate uses.” (Pugh, 1997) Now perceived to be more than just pollution
 Now perceived to be more than just pollution.")
2
The 3 components of management of ecological quality in rivers
Structure Quantity

3
General Quality Assessment
Water Quality Biology Chemistry Nutrients Aesthetics

4
GQA Scheme for Biology A = Very Good
Biology similar (or better than) that expected for an average and unpolluted river of this size, type and location. High diversity of taxa, usually with several species in each. Rare to find dominance of any one taxon. B = Good C = Fairly Good, D = Fair, E = Poor F = Poor Biology limited to a small number of very tolerant taxa such as worms, midge larvae, leeches and water hoglouse, present in very high numbers.
 that expected for an average and unpolluted river of this size, type and location. High diversity of taxa, usually with several species in each. Rare to find dominance of any one taxon. B = Good C = Fairly Good, D = Fair, E = Poor. F = Poor. Biology limited to a small number of very tolerant taxa such as worms, midge larvae, leeches and water hoglouse, present in very high numbers.")
5
Water Framework Directive (2000)
WFD looks at the whole system; seeks to manage water proactively on a catchment basis, using reference systems Aims: To achieve “Good Status” for all waters by set deadlines (2015) To promote sustainable water consumption To protect & enhance the status of aquatic ecosystems & associated wetlands Water management to be based on natural units not natural ones
 To promote sustainable water consumption. To protect & enhance the status of aquatic ecosystems & associated wetlands. Water management to be based on natural units not natural ones.")
6
Aquatic Invertebrates
Sampling Identification Using aquatic inverts as indicators of biological water quality

7
What are Aquatic Macro-invertebrates?

8
Aquatic Invertebrates - Examples

9
Why Sample Aquatic Invertebrates?
Aquatic inverts are ecologically important within the food chain – - abundance - species and ecological diversity Functional roles include: Algal grazers Consumers of bacteria & fungi Detritivores Predators Prey

10
Why Sample Aquatic Invertebrates cont. ?
Aquatic Invertebrates vary in their sensitivity to water pollution i.e. they are good biological indicators 3. Aquatic invertebrate data provides longer term information than chemical data Sampling aquatic invertebrates is more meaningful than chemical monitoring 5. Aquatic invertebrates are relatively easy to collect

11
Health and Safety first!
Collecting Samples Health and Safety first! Prepare necessary methods statement and risk assessment

13
Collecting Samples Check mobile phone, put on life jacket
3. Review bank features including slope, vegetation, conditions underfoot, obstacles or special hazards 4. Review waterbody features including depth, turbidity, flow, substrate, channel profile, vegetation, obstacles or special hazards

16
Collecting Samples Together with co-worker, identify point(s) of entrance and exit Use ranging pole to test substrate and provide support Go slowly 8. Common Sense Rule: Don’t get in if there is any doubt over safety

17
4 – Minute Combined Kick-sweep Sample
Collecting Samples 4 – Minute Combined Kick-sweep Sample 30 seconds collection of surface activity insects 3 minute kicking and sweeping 30 seconds collection of benthic invertebrates adherent to stones, logs, car tyres and shopping trolleys Key Point: Important to divide time between component habitats or microhabitats proportionally E.g. Open water, submerged vegetation, emergent vegetation, exposed substrate, overhanging vegetation, submerged wood

19
Sample Storage Either a three stage process:
Firstly: apply a fixative, usually 4% aqueous solution of formaldehyde Secondly: sort sample, i.e. pick out inverts Thirdly: store sorted sample in a preservative, usually 70% alcohol Or; simply use 90% alcohol (IMS)
")
20
Sorting a Sample Wash out fixative ‘Dilute’ sample across a white tray
Carefully pick out the invertebrates

21
Review of Aquatic Invertebrate Groups

22
A representation showing how a river recovers after a pollution incident. At stage A, up stream from the incident micro-organisms are of a higher scoring BMWP group these including, Gammarus pulex [1] (Freshwater shrimp), Nemouridae [2] (Stonefly nymph), Limpohiid caddis [3] and Ecdyonurus [5] (May-fly larva). Stage B shows the invertebrates below the site of pollution here the organisms are all of lower scoring groups including Eristalis tenax [1] (Rat-tailed maggot), Tubifex [2[ (Sludge worm) and Chironomus ripatius [3] (Blood worm). Stage C shows the species found further downstream from the incident, species found here start to indicate higher scores including, Asellus aquaticus [1] (water hog-louse), Sialis lutaris [3] (Alder-fly larva) and Erpobdella [5] (Leech). Site D shows further improvement with species including Hydropsyche [2] (Case-less caddis larva) present along with Baetis rhodani [4] (May-fly larva) and Asellus aquaticus [1] (water hog-louse). Finally, Site E shows the complete recovery of the river with the community made up of high scoring species including, Nemouridae [2] (Stonefly nymph), Ephemerella [3] (May-fly nymph) and Stenophylax [5] (Caddis larva). Underneath the diagram the schematic shows the relationship between dissolved oxygen and organic matter in the river. As the amount of organic matter in the water declines so the levels of dissolved oxygen increase. This is due to the oxygen in the water being used to break down the organic compounds. Hawkes (1979) states that “deoxygenation eliminates the more sensitive species and the overall effect is of a reduction in the numbers of species present”.
![A representation showing how a river recovers after a pollution incident. At stage A, up stream from the incident micro-organisms are of a higher scoring BMWP group these including, Gammarus pulex [1] (Freshwater shrimp), Nemouridae [2] (Stonefly nymph), Limpohiid caddis [3] and Ecdyonurus [5] (May-fly larva). Stage B shows the invertebrates below the site of pollution here the organisms are all of lower scoring groups including Eristalis tenax [1] (Rat-tailed maggot), Tubifex [2[ (Sludge worm) and Chironomus ripatius [3] (Blood worm). Stage C shows the species found further downstream from the incident, species found here start to indicate higher scores including, Asellus aquaticus [1] (water hog-louse), Sialis lutaris [3] (Alder-fly larva) and Erpobdella [5] (Leech). Site D shows further improvement with species including Hydropsyche [2] (Case-less caddis larva) present along with Baetis rhodani [4] (May-fly larva) and Asellus aquaticus [1] (water hog-louse). Finally, Site E shows the complete recovery of the river with the community made up of high scoring species including, Nemouridae [2] (Stonefly nymph), Ephemerella [3] (May-fly nymph) and Stenophylax [5] (Caddis larva).](http://slideplayer.com/slide/1519098/5/images/22/A+representation+showing+how+a+river+recovers+after+a+pollution+incident.+At+stage+A%2C+up+stream+from+the+incident+micro-organisms+are+of+a+higher+scoring+BMWP+group+these+including%2C+Gammarus+pulex+%5B1%5D+%28Freshwater+shrimp%29%2C+Nemouridae+%5B2%5D+%28Stonefly+nymph%29%2C+Limpohiid+caddis+%5B3%5D+and+Ecdyonurus+%5B5%5D+%28May-fly+larva%29.+Stage+B+shows+the+invertebrates+below+the+site+of+pollution+here+the+organisms+are+all+of+lower+scoring+groups+including+Eristalis+tenax+%5B1%5D+%28Rat-tailed+maggot%29%2C+Tubifex+%5B2%5B+%28Sludge+worm%29+and+Chironomus+ripatius+%5B3%5D+%28Blood+worm%29.+Stage+C+shows+the+species+found+further+downstream+from+the+incident%2C+species+found+here+start+to+indicate+higher+scores+including%2C+Asellus+aquaticus+%5B1%5D+%28water+hog-louse%29%2C+Sialis+lutaris+%5B3%5D+%28Alder-fly+larva%29+and+Erpobdella+%5B5%5D+%28Leech%29.+Site+D+shows+further+improvement+with+species+including+Hydropsyche+%5B2%5D+%28Case-less+caddis+larva%29+present+along+with+Baetis+rhodani+%5B4%5D+%28May-fly+larva%29+and+Asellus+aquaticus+%5B1%5D+%28water+hog-louse%29.+Finally%2C+Site+E+shows+the+complete+recovery+of+the+river+with+the+community+made+up+of+high+scoring+species+including%2C+Nemouridae+%5B2%5D+%28Stonefly+nymph%29%2C+Ephemerella+%5B3%5D+%28May-fly+nymph%29+and+Stenophylax+%5B5%5D+%28Caddis+larva%29..jpg "Underneath the diagram the schematic shows the relationship between dissolved oxygen and organic matter in the river. As the amount of organic matter in the water declines so the levels of dissolved oxygen increase. This is due to the oxygen in the water being used to break down the organic compounds. Hawkes (1979) states that deoxygenation eliminates the more sensitive species and the overall effect is of a reduction in the numbers of species present .")
23
Crustacea – Water Fleas

24
Crustacea – Freshwater Shrimp

25
Platyhelminthes - Flatworms

26
Annelida – Hirudinea - Leeches

27
Mollusca – Gastropoda - Snails

28
Insecta – Hemiptera – Water Bugs

29
Insecta – Coleoptera – Water Beetles

30
Insecta – Diptera – True Flies

31
Insecta – Megaloptera - Alderflies

32
Insecta – Tricoptera – Caseless Caddis Flies

33
Insecta – Tricoptera – Cased Caddis Flies

34
Insecta – Tricoptera - Adult Caddis Fly

35
Insecta – Plecoptera – Stone-flies

36
Insecta –Ephemeroptera - Mayflies

37
Insecta – Ephemeroptera – Adult Mayfly

38
Insecta – Odonata – Dragonflies & Damselflies

39
Data Interpretation

40
Calculate the Biotic Scores
Taxon or species richness; the easiest measure of biodiversity BMWP score; the Biological Monitoring Working Party score ASPT index value; the Average Score Per Taxon BWMP – Score dependent on sample size, sampling efficiency and seasons Different unpolluted rivers often generate very different BMWP scores due to natural variation in ecological communities eg. silted lowland rivers with turbulent upland streams. The solution ? RIVPACS In this system the different river types are taken into account

41
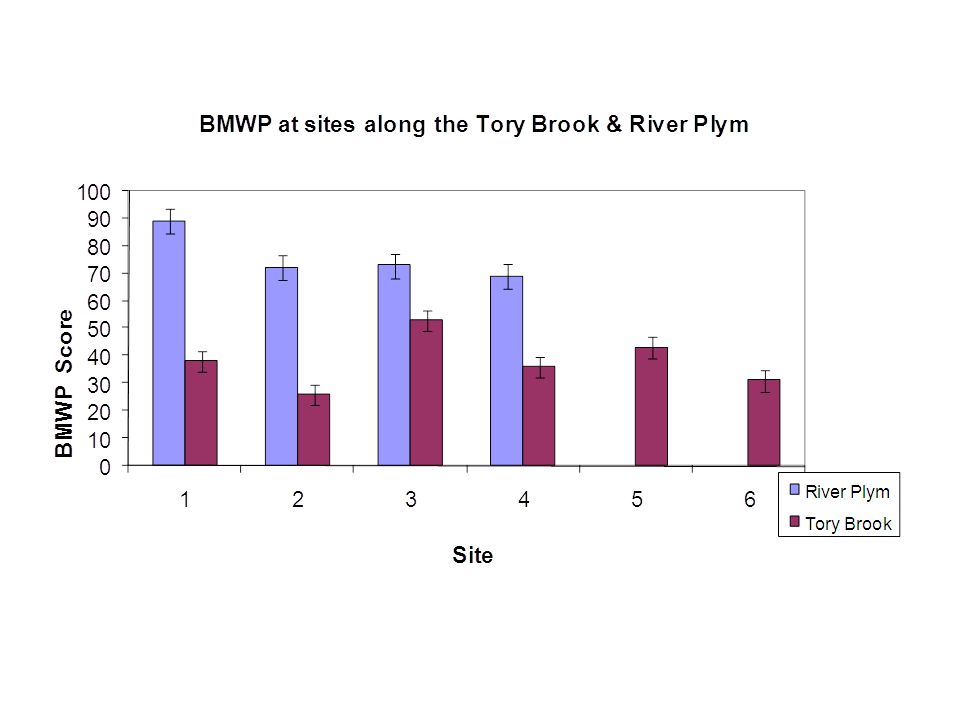
BMWP Scale BMWP score Category Interpretation 0-10 Very poor Heavily polluted 11-40 Poor Polluted or impacted 41-70 Moderate Moderately impacted 71-100 Good Clean but slightly impacted >100 Very good Unpolluted, unimpacted Each family is given a score known as the BMWP this reflects the conditions in which they are found a higher score reflecting a cleaner habitat, where as a lower score reflects a more polluted area of water. The table below indicates how the score relates to the level of pollution (Bourne Stream, 2008)
")
42
BWMP – Score dependent on sample size, sampling efficiency and seasons
Different unpolluted rivers often generate very different BMWP scores due to natural variation in ecological communities eg. silted lowland rivers with turbulent upland streams. The solution ? RIVPACS In this system the different river types are taken into account Even when no pollution is present species of macro-invertebrates vary between different sites and rivers; this is due to natural variation. Factors affecting this include altitude, sediment type, and the speed of river as well as underlying geology to name a few. Under natural conditions the community found at any unstressed site will vary, Vannote et al (1980) make the point that sites will be influenced by many factors (geographical, geological and catchment related) which determine river type, but also by the location of the site along the length of the water course (Wright et al, 1994). Due to these natural differences when comparing rivers “it is best to describe biological quality as the difference between the macro-invertebrate community actually found in the river and that which would be expected under natural conditions.” (Environmental Agency, ND) When comparing a site for environmental stress against another Wright et al (1994) expresses the need to know the “fauna to be expected at the site in the absence of environmental stress”. A system created by the Freshwater Biology Association, RIVPACS (River Invertebrate Prediction and Classification System) is used to compensate for these variations. The advantage of the use of RIVPACS is that it allows for the comparisons of sites to be made with the use of observed fauna, to determine site quality. It also allows for the user to “[locate] sites of a high biological quality within a national classification of sites, using the macro-invertebrate fauna.” (Wright et al, 1994). RIVPACS has evolved over the years and has been “adopted by other countries and has influenced the European Union Water Framework Directive (WFD) (Centre for Ecology & Hydrology, 2008). It should be noted that even rivers that appear not to have undergone any environmental stress, are still likely to have been impacted by man. Wright et al reveals that “it would be naïve to regard them as being close to pristine conditions as man’s activities, both in stream and within the catchment over hundreds if not thousands of years, will have influenced community structure and function”.
 make the point that sites will be influenced by many factors (geographical, geological and catchment related) which determine river type, but also by the location of the site along the length of the water course (Wright et al, 1994). Due to these natural differences when comparing rivers it is best to describe biological quality as the difference between the macro-invertebrate community actually found in the river and that which would be expected under natural conditions. (Environmental Agency, ND) When comparing a site for environmental stress against another Wright et al (1994) expresses the need to know the fauna to be expected at the site in the absence of environmental stress . A system created by the Freshwater Biology Association, RIVPACS (River Invertebrate Prediction and Classification System) is used to compensate for these variations. The advantage of the use of RIVPACS is that it allows for the comparisons of sites to be made with the use of observed fauna, to determine site quality. It also allows for the user to [locate] sites of a high biological quality within a national classification of sites, using the macro-invertebrate fauna. (Wright et al, 1994). RIVPACS has evolved over the years and has been adopted by other countries and has influenced the European Union Water Framework Directive (WFD) (Centre for Ecology & Hydrology, 2008). It should be noted that even rivers that appear not to have undergone any environmental stress, are still likely to have been impacted by man. Wright et al reveals that it would be naïve to regard them as being close to pristine conditions as man’s activities, both in stream and within the catchment over hundreds if not thousands of years, will have influenced community structure and function .")
44
Data Interpretation Compare sampling stations, e.g. up and downstream of potential pollution source Compare with historical data Compare with Environment Agency data

46
The average score per taxon (ASPT) of the species found along the Tory Brook & River Plym. As expected the River Plym boasts a higher ASPT, the first and second sites shows that there is a significant difference in the ASPT between the River Plym and the Tory Brook. Even though sites 3 and 4 show a higher ASPT on the River Plym there is no significant difference between that of the River Plym and the Tory Brook.

47
Site six at the Tory Brook
Evidence of china clay in the water Site two at the Tory Brook Both sites have vegetation inputs, Tory Brook more modified, with sediment input Evidence that channel may have be altered Site six at the Tory Brook

48
The levels of suspended solids found at sites along the Tory Brook and the River Plym. Levels of suspended solids along the River Plym were extremely low when compared to those found along the Tory Brook. The lowest being at site 2 where no suspended solids were detected, the highest (2.56 mg/l) was found at site 3; this site is located in woodland and this could be a contributing factor in the increase in the level of suspended solids. Along the Tory Brook as expected levels of suspended solids were significantly higher potentially due to the discharges from Lee Moor. Site 2 (7.10mg/l) showed the lowest level of suspended solids, it should be noted this site was both deep and faster flowing with a high amounts of vegetation present. Site 3 (23.97mg/l) showed the highest levels of suspended solids along the Tory Brook, here the river widened and slowed causing sediments to be deposited. The levels of suspended solids along the Tory Brook showed no consistency and showed significant variation between sites.
 was found at site 3; this site is located in woodland and this could be a contributing factor in the increase in the level of suspended solids. Along the Tory Brook as expected levels of suspended solids were significantly higher potentially due to the discharges from Lee Moor. Site 2 (7.10mg/l) showed the lowest level of suspended solids, it should be noted this site was both deep and faster flowing with a high amounts of vegetation present. Site 3 (23.97mg/l) showed the highest levels of suspended solids along the Tory Brook, here the river widened and slowed causing sediments to be deposited. The levels of suspended solids along the Tory Brook showed no consistency and showed significant variation between sites..")
49
Site one at the River Plym
Site two at the River Plym Well oxygenated, pool and riffle system. Surrounding land use low intensity grazing. Wide and shallow, with medium sized sediment Site four at the River Plym

50
The levels of the phosphate at sites along the Tory Brook and the River Plym. The graph indicates that levels of phosphate increase along the Tory Brook, with the highest levels being recorded at sites 5 & 6. This could be due to pollution from the industrial estate. Site 3 shows the highest level of phosphate along the River Plym, this could be due to application of fertilisers on the surrounding grassland, which could be used to graze sheep; phosphates from surrounding farmland may have also entered the river.

51
The level of nitrates found in the water at each site, the Tory Brook shows significantly higher levels of nitrate than those found along the River Plym apart from site 4 where higher levels are found. Site 4 is located below Dewerstone Woods next Shaugh Prior Bridge; the reason behind higher levels of nitrate could be due to tributaries flowing into the Plym carrying increased nitrate levels from surrounding farmland.

52
References Bourne Stream BMWP Scoring – measuring Freshwater Quality [online] Available at [Accessed 23rd March 2008] Centre for Ecology & Hydrology RIVPACS (River Invertebrate Prediction and Classification System): an introduction. [Online] Available at: [Accessed 2nd April 2008] DEFRA Key Facts about: Inland Water Quality and Use, Phosphate Concentrations in rivers: [Online]. Available at: [Accessed 4th April 2008] Environmental Agency. ND. General Quality Assessment of rivers – biology, [Online] Available at: [Accessed 19th November 2007] EPA, Biological Indicators of Watershed Health. [Online] (Updated 30th November 2007) Available at: [Accessed 20th March 2008] Gainey P Cornish mineral company fined for polluting salmon river. [Online] Available at: [Accessed 4th April 2008] Hawkes H Technical Note, Origin and Development of the Biological Monitoring Working Party Score System, 32 (4) Pages Martin R Origin of the Biological Monitoring Working Party System, A brief summary, [Online] Available at [Accessed 20th November 2007]
: an introduction. [Online] Available at: [Accessed 2nd April 2008] DEFRA Key Facts about: Inland Water Quality and Use, Phosphate Concentrations in rivers: [Online]. Available at: [Accessed 4th April 2008] Environmental Agency. ND. General Quality Assessment of rivers – biology, [Online] Available at: [Accessed 19th November 2007] EPA, Biological Indicators of Watershed Health. [Online] (Updated 30th November 2007) Available at: [Accessed 20th March 2008] Gainey P Cornish mineral company fined for polluting salmon river. [Online] Available at: [Accessed 4th April 2008] Hawkes H Technical Note, Origin and Development of the Biological Monitoring Working Party Score System, 32 (4) Pages Martin R Origin of the Biological Monitoring Working Party System, A brief summary, [Online] Available at [Accessed 20th November 2007]")
Similar presentations


 and.>")


>")


 n.>")