Download presentation
Presentation is loading. Please wait.

1
Chapter 6: Probability and Simulation, the study of randomness

2
6.1 – Simulation

3
Simulation: The imitation of chance behavior, based on a model that accurately reflects the experiment under consideration. Independent: One event doesn’t influence the outcome of another event. (tossing a coin)
")
4
5 steps of simulation: 1. State the problem or describe the random phenomenon 2. State the assumptions. 3. Assign digits to represent outcomes. 4. Simulate many repetitions 5. State your conclusions

5
Use # table, 0-4 girl and 5-9 boy
Example #1 Describe how you would simulate the following problems. Boy or girl? There is an equally likely chance of delivering a boy or a girl at birth. What is the likelihood of having a girl among their first four children? Flip a coin Roll Die: 1-3 girl, 4-6 boy Use # table, 0-4 girl and 5-9 boy

6
Example #1 Describe how you would simulate the following problems. b. Choose one person at random from a group of which 50% are employed, 20% are unemployed, and 30% are not in the labor force. Use # table, 0-4 employed, 5-6 unemployed, 7-9 not in labor force

7
Calculator Tip: Random Integers
Math – Prob – RandInt (smallest #, largest #, n)
")
8
Probability of a heads or tails is 50%
Example #2 What is the likelihood of tossing a coin 5 times and getting at least 3 consecutive heads or 3 consecutive tails? Simulation Steps: 1. State the problem or describe the random phenomenon Find the likelihood of tossing a coin 5 times and getting 3 consecutive heads or tails 2. State the assumptions Probability of a heads or tails is 50% Coin tosses are independent

9
Random digit table: Line 101
Example #2 What is the likelihood of tossing a coin 5 times and getting at least 3 consecutive heads or 3 consecutive tails? Simulation Steps: 3. Assign digits to represent outcomes 0-4 heads, tails 4. Simulate many repetitions Random digit table: Line 101

10
First time: 1 9 2 2 3 Fifth: 9 6 4 9 Second: 9 Sixth: 1 2 5 3 1 5 3 4
9 T T H H T H T H H H Second: 9 Sixth: 1 2 5 3 1 5 3 4 T T H H H H H T H H Third: 5 7 5 6 Seventh: 4 2 5 4 4 H H H T H H T T T T 8 2 8 5 3 Fourth: 2 8 7 1 3 Eighth: H T T H H T H T T H

11
P(3 consecutive heads or tails) =
Example #2 What is the likelihood of tossing a coin 5 times and getting at least 3 consecutive heads or 3 consecutive tails? Simulation Steps: 5. State your conclusions 3 8 P(3 consecutive heads or tails) = After 8 simulations, the probability of flipping a coin 5 times and getting at least 3 consecutive heads or tails is approximately 37.5%
 = After 8 simulations, the probability of flipping a coin 5 times and getting at least 3 consecutive heads or tails is approximately 37.5%")
12
Assign numbers to represent baskets and misses. 0-6 basket, 7-9 miss
Example #4 A basketball player makes 70% of her free throws in a long season. In a tournament game she shoots 5 free throws late in the game and misses 3 of them. The fans think she was nervous, but the misses may simply be chance. You will shed some light by estimating the probability. Describe how to simulate a single shot if the probability of making each shot is 70%. Then describe how to simulate 5 independent shots. Assign numbers to represent baskets and misses. 0-6 basket, 7-9 miss Use Random Number table to choose 5 numbers

13
Example #4 A basketball player makes 70% of her free throws in a long season. In a tournament game she shoots 5 free throws late in the game and misses 3 of them. The fans think she was nervous, but the misses may simply be chance. You will shed some light by estimating the probability. b. Use the calculator to simulate 20 repetitions of the 5 shots and record the number missed on each repetition. What is the approximate likelihood that the player will miss 3 or more of the 5 shots? randInt(0, 9, 5)
")
14
# of times she didn’t miss 3 out of 5:
14 # of times she did miss 3 out of 5: 6 6 20 P(missing 3 out of 5 shots) = = 30%
 = = 30%")
15
6.2 – Probability Models

16
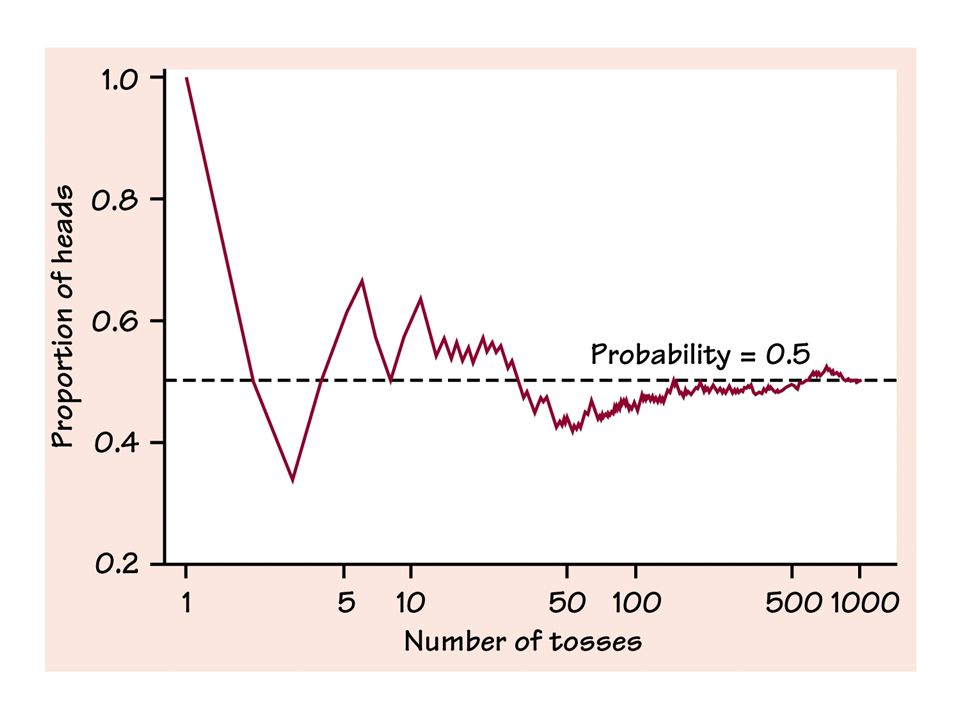
Probability: Chance behavior is unpredictable in the short run but has a regular and predictable pattern in the long run. Probability of an event equals the proportion of times it occurs in a long series of repetitions. # of successes P(Event) = Total #
 = Total #")
17
Random: An event is random if individual outcomes are uncertain, but there is a regular distribution of outcomes in a large number of repetitions.

19
Probability Model: Mathematical description of a random phenomenon that has two parts: Sample Space Way of assigning probabilities to events

20
Sample Space: Set of all possible outcomes S = { … } Event: Any outcome or set of outcomes. Subset of the sample space E = { … }

21
Example #4 Fill in the answers below for each situation 1. Tossing a single die: a. List the sample space. S = {1, 2, 3, 4, 5, 6} b. Event A: an odd number E = {1, 3, 5}

22
Example #4 Fill in the answers below for each situation 1. Tossing a single die: c. P(A) = probability of A occurring: 3 6 P(A) = = 50%
 = = 50%")
23
Fill in the answers below for each situation
Example #4 Fill in the answers below for each situation 2. In a standard deck of playing cards there are 52 cards total. a. Drawing one card, P(Heart) 13 52 P(Heart) = = 25%
 P(Heart) = = 25%")
24
Fill in the answers below for each situation
Example #4 Fill in the answers below for each situation 2. In a standard deck of playing cards there are 52 cards total. b. Drawing one card, P(King) 4 . 52 P(King) = = 8%
 P(King) = = 8%")
25
Fill in the answers below for each situation
Example #4 Fill in the answers below for each situation 2. In a standard deck of playing cards there are 52 cards total. c. If I continue to draw cards from the deck, will the trials be independent? Why or why not? No, the first card influences the probability of the next card

26
There are two ways to find the total number of outcomes in a sample space:
1. Tree Diagram: Branches off to represent each possibility 2. Multiplication Principle: If you can do one task in a number of ways and a second task in b number of ways, then both tasks can be done in a x b number of ways.

27
Example #5 Draw a tree diagram for flipping a coin and then rolling die. Then determine the size of the sample space.

28
1 # of outcomes: 2 3 12 H 4 5 6 Or Mult. Principle: 1 a x b 2 2 x 6 3 T 12 4 5 6

29
6.2 - continued

30
Probability Rules: P(A) = 1 means the event will always occur P(A) = 0 means the event will never occur The probability P(A) of any event A satisfies 0 ≤ P(A) ≤ 1 The sum of the probabilities of all possible outcomes is 1. An event is empty if it has no outcomes in it.
 of any event A satisfies. 0 ≤ P(A) ≤ 1. The sum of the probabilities of all possible. outcomes is 1. An event is empty if it has no outcomes in it. ")
31
Venn Diagram: A picture representation of a sample space. S A B

32
Example #1 Make a Venn diagram for the following situation: 45% of kids like Barney 25% of kids like Blue 55% of kids like Pooh 15% of kids like Blue and Pooh 25% of kids like Barney and Pooh 5% of kids like Blue but not Barney or Pooh 5% of kids like Barney, Blue, and Pooh

33
Things kids like .25 Pooh Barney .20 .15 .20 .05 .05 .10 .05 Blue

34
Complement Rule: The probability that event A does NOT occur Written: Ac P(Ac) = 1 – P(A) S A
 = 1 – P(A) S A")
35
Union: Either event A or event B occurs A B S A B

36
Intersection: Event A and Event B occurs A B S A B

37
B A Disjoint: (mutually exclusive)
Two events A and B are disjoint if they have no outcomes in common, so never can occur simultaneously. S B A

38
B A Addition Rule (for disjoint events only!!!!!):
P(A or B) = P(A) + P(B) S B A Note: P(A and B) = 0
 = P(A) + P(B) S. B. A. Note: P(A and B) = 0.")
39
a. P(A) = Probability of drawing a spade
Example #2 You have drawn one card from a standard deck of cards. Find the following probabilities: a. P(A) = Probability of drawing a spade 13 52 P(A) = = 25%
 = Probability of drawing a spade P(A) = = 25%")
40
b. P(B) = Probability of drawing a King
Example #2 You have drawn one card from a standard deck of cards. Find the following probabilities: b. P(B) = Probability of drawing a King 4 . 52 P(B) = = 8%
 = Probability of drawing a King P(B) = = 8%")
41
c. P(C) = Probability of drawing an Ace
Example #2 You have drawn one card from a standard deck of cards. Find the following probabilities: c. P(C) = Probability of drawing an Ace 4 . 52 P(C) = = 8%
 = Probability of drawing an Ace P(C) = = 8%")
42
Probability of not drawing an King
Example #2 You have drawn one card from a standard deck of cards. Find the following probabilities: d. P(Bc) = Probability of not drawing an King 4 . 52 P(Bc) = 1 – = 92%
 = Probability of not drawing an King P(Bc) = 1 – = 92%")
43
Probability of Ace or King
Example #2 You have drawn one card from a standard deck of cards. Find the following probabilities: e. P(B C) = Probability of Ace or King 4 . 52 4 . 52 8 . 52 P(B C) = P(B) + P(C) = + = = 15%
 = Probability of Ace or King P(B C) = P(B) + P(C) = + = = 15%")
44
Probability of Ace and King
Example #2 You have drawn one card from a standard deck of cards. Find the following probabilities: f. P(B C) = Probability of Ace and King P(B C) =
 = Probability of Ace and King. P(B C) =")
45
What is the difference between disjoint and independent?
Independence is when one event doesn’t influence the probability of the next event. Disjoint means the two events have no outcomes in common, so never can occur simultaneously.

46
Black King Drawing one card and getting a black King. independent
Example #3 Determine if the given example is independent, disjoint, or neither. Drawing one card and getting a black King. independent Deck of cards Black King

47
Example #3 Determine if the given example is independent, disjoint, or neither. b. Drawing two cards and getting a black King, without replacement. neither Deck of cards Black King

48
A B c. Can you have a disjoint event be independent? Explain.
Knowing event A happens means event B cannot A B

49
Multiplication Rule (for independent events only!!!!!):
P(A and B) = P(A) P(B)
 = P(A) P(B)")
50
Find the marginal percents.
Example #4 The following table gives the gender and political party of the 100 delegates at a political convention. Suppose you encounter a delegate at random. The proportion of each person is given. Women Men Republicans 0.21 0.28 Democrats 0.25 0.16 Independents 0.06 0.04 0.49 0.41 0.10 0.52 0.48 1.0 Find the marginal percents.

51
b. Is it a valid probability distribution? How do you know?
Example #4 The following table gives the gender and political party of the 100 delegates at a political convention. Suppose you encounter a delegate at random. The proportion of each person is given. Women Men Republicans 0.21 0.28 Democrats 0.25 0.16 Independents 0.06 0.04 0.49 0.41 0.10 0.52 0.48 1.0 b. Is it a valid probability distribution? How do you know? Yes, the probabilities add to one

52
c. What is the probability that the delegate will not be a man?
Example #4 The following table gives the gender and political party of the 100 delegates at a political convention. Suppose you encounter a delegate at random. The proportion of each person is given. Women Men Republicans 0.21 0.28 Democrats 0.25 0.16 Independents 0.06 0.04 0.49 0.41 0.10 0.52 0.48 1.0 c. What is the probability that the delegate will not be a man? P(not man) = 1 – P(man) = 1 – 0.48 = 0.52
 = 1 – P(man) = 1 – 0.48 =")
53
Women Men Republicans 0.21 0.28 Democrats 0.25 0.16 Independents 0.06
Example #4 The following table gives the gender and political party of the 100 delegates at a political convention. Suppose you encounter a delegate at random. The proportion of each person is given. Women Men Republicans 0.21 0.28 Democrats 0.25 0.16 Independents 0.06 0.04 0.49 0.41 0.10 0.52 0.48 1.0 d. What is the probability that the delegate will not be an Independent? P(not ind.) = 1 – P(ind.) = 1 – 0.10 = 0.90
 = 1 – P(ind.) = 1 – 0.10 =")
54
Women Men Republicans 0.21 0.28 Democrats 0.25 0.16 Independents 0.06
Example #4 The following table gives the gender and political party of the 100 delegates at a political convention. Suppose you encounter a delegate at random. The proportion of each person is given. Women Men Republicans 0.21 0.28 Democrats 0.25 0.16 Independents 0.06 0.04 0.49 0.41 0.10 0.52 0.48 1.0 e. What is the probability that the delegate will be a Republican woman? P(Rep. and Woman) = 0.21 Note: not independent!
 = Note: not independent!")
55
Example #5 A gambler wants to know the probability of rolling one die twice and getting a 3 both times. Note: Independent 1 6 1 6 1 . 36 P(3 3) = P(3) P(3) = = = 3%
 = P(3) P(3) = = = 3%")
56
P(all 20 lights not fail for 3yrs) = (1 – .02)20 = (.98)20
Example #6 A string of Christmas lights contains 20 lights. The lights are wired in a series, so that if any light fails the whole string will go dark. Each light has probability 0.02 of failing during a 3 year period. The lights fail independently of each other. What is the probability the strings of lights will remain bright for 3 years? Note: Independent P(all 20 lights not fail for 3yrs) = (1 – .02)20 = (.98)20 0.6676
 = (1 – .02)20. = (.98)")
57
6.3 – General Probability Rules

58
A B Problem: Addition Rule only works for disjoint events
P(A B) = P(A) + P(B) Solution: Subtract P(A and B) from both probabilities P(A B) = P(A) + P(B) – P(A B) S A B
 = P(A) + P(B) Solution: Subtract P(A and B) from both probabilities. P(A B) = P(A) + P(B) – P(A B) S. A. B.")
59
Conditional Probability:
The probability of an event occurring, given another event occurred P(AB) = P(A) happens given that B occurs P(BA) = P(B) happens given that A occurs
 = P(A) happens given that B occurs. P(BA) = P(B) happens given that A occurs.")
60
P(A and B) P(B) P(AB) = S A B
 P(B) P(AB) = S A B")
61
P(A and B) P(A) P(BA) = S A B
 P(A) P(BA) = S A B")
62
General Multiplication Rule:
If Independent: P(A and B) = P(A) P(B) P(A and B) P(B) In General: P(AB) = P(A and B) = P(B) P(AB)
 = P(A) P(B) P(A and B) P(B) In General: P(AB) = P(A and B) = P(B) P(AB)")
63
Determining Independence:
Two events A and B are independent if P(AB) = P(A) OR: P(BA) = P(B)
 = P(A) OR: P(BA) = P(B)")
64
Number of Spare Parts Warehouse Defective Acceptable Total Baltimore
Example #1 The Adams Corporation stores spare parts at two warehouses, one in Baltimore and one in Plattsburgh. The number of defective and acceptable spare parts at each warehouse is given below: Number of Spare Parts Warehouse Defective Acceptable Total Baltimore 28 272 Plattsburgh 10 190 300 200 38 462 500 If one of the 500 spare parts kept by the firm is chosen at random let D and A denote the events that the spare part is defective or acceptable, while B and P denote the events that it comes from Baltimore or Plattsburgh. Calculate the following probabilities:

65
Number of Spare Parts Warehouse Defective Acceptable Total Baltimore 28 272 Plattsburgh 10 190 300 200 38 462 500 300 500 = a. P(B) = 0.60
 =")
66
Number of Spare Parts Warehouse Defective Acceptable Total Baltimore 28 272 Plattsburgh 10 190 300 200 38 462 500 272 500 b. P(A B) = = 0.544 Using Rule: P(A and B) = P(B) P(AB) 300 500 272 300 P(A and B) = = 0.544
 = = Using Rule: P(A and B) = P(B) P(AB) P(A and B) = =")
67
Number of Spare Parts Warehouse Defective Acceptable Total Baltimore 28 272 Plattsburgh 10 190 300 200 38 462 500 300 500 c. P(Bc) = 1 – P(B) = 1 – = 0.40
 = 1 – P(B) = 1 – =")
68
Number of Spare Parts Warehouse Defective Acceptable Total Baltimore 28 272 Plattsburgh 10 190 300 200 38 462 500 d. P(A B) = P(A) + P(B) – P(A and B) 462 500 300 500 272 500 + – = = – .544 = 0.98
 = P(A) + P(B) – P(A and B) – = = – =")
69
Number of Spare Parts Warehouse Defective Acceptable Total Baltimore 28 272 Plattsburgh 10 190 300 200 38 462 500 272 300 0.9067 e. P(AB) = =
 = =")
70
Using Rule: 272 500 272 500 500 300 P(A and B) P(B) = P(AB) = = 300 500 272 300 0.9067 = =
 P(B) = P(AB) = = = =")
71
Number of Spare Parts Warehouse Defective Acceptable Total Baltimore 28 272 Plattsburgh 10 190 300 200 38 462 500 10 38 0.2632 f. P(PD) = =
 = =")
72
Using Rule: 10 . 500 10 . 500 500 38 P(P and D) P(D) = P(PD) = = 38 . 500 10 38 = = 0.2632
 P(D) = P(PD) = = = =")
73
Number of Spare Parts Warehouse Defective Acceptable Total Baltimore
28 272 Plattsburgh 10 190 300 200 38 462 500 g. Determine if coming from Plattsburgh and being defective are independent. P(PD) = P(P) No, they are not 10 . 200 0.2632 = 0.05
 = P(P) No, they are not = ")
74
Tree Diagram: Some conditional probabilities can be solved by drawing a schematic way of looking at all possible outcomes.

75
Example #2 Suppose a computer company has manufacturing plants in three states. 50% of their computers are manufactured in California and 85% of these are desktops, 30% of computers are manufactured in Washington, and 40% of these are laptops, and 20% of computers are manufactured in Oregon, and 40% of these are desktops. All computers are first shipped to a distribution site in Nebraska before being sent out to stores. If you picked a computer at random from the Nebraska distribution center, what is the probability that it is a laptop?

76
0.15 laptop CA desktop 0.85 0.50 laptop 0.40 WA desktop 0.30 0.60 0.60
(.5.15) = 0.075 laptop CA desktop 0.85 (.5.85) = 0.425 0.50 laptop 0.40 (.3.4) = 0.12 State WA desktop 0.30 0.60 (.3.6) = 0.18 0.60 laptop (.2.6) = 0.12 OR desktop 0.40 (.2.4) = 0.08 0.20 P(laptop) = = 0.315
 = laptop. CA. desktop (.5.85) = laptop (.3.4) = State. WA. desktop (.3.6) = laptop. (.2.6) = OR. desktop (.2.4) = P(laptop) = =")
Similar presentations


, 1 heads and.>")


