Download presentation
Presentation is loading. Please wait.

1
The Global Financial Crisis and the Slow Recovery
An Overview by Assaf Razin Tel-Aviv University and Cornell University January 1, 2010

2
Current Global Crisis: 3 Acts
Act I: Credit-fed Asset Bubble Act II: Financial Collapse after the Burst of the bubble Act III: spill overs to the real economy

3
Under currents Financial innovation, globalization, and reduced transparency in the financial sector Panicky in free fall of asset prices Under capitalized banking system and credit crunch

4
Historical Precedents?
The great depression? Japan in the 1990s? Sweden in the 1980s? The saving and loan crisis in the US in the 1980?

5
Percentage decline in employment in recessions since 1970

6
History Carmen Reinhart of Maryland and Ken Rogoff of Harvard, have recently published an analysis of the current financial crisis in the context of what they identify as the previous 18 banking crises in industrial countries since the second world war. They find what they call "stunning qualitative and quantitative parallels across a number of standard financial crisis indicators" - the common themes that translate these individual dramas into the big-picture story of financial boom and bust. Their study is focused on the US, 6

7
Banking Crises BANKING CRISES ARE PROTRACTED, THEY NOTE, WITH OUTPUT DECLINING, ON AVERAGE, FOR TWO YEARS. ASSET MARKET COLLAPSES ARE DEEP, WITH REAL HOUSE PRICES FALLING, AGAIN ON AVERAGE, BY 35 PER CENT OVER SIX YEARS AND EQUITY PRICES DECLINING BY 55 PER CENT OVER 3½ YEARS. THE RATE OF UNEMPLOYMENT RISES, ON AVERAGE, BY 7 PERCENTAGE POINTS OVER FOUR YEARS, WHILE OUTPUT FALLS BY 9 PER CENT.

8
Banking crises: follow ups

9
US Bank Failures

10
in deep slumps monetary expansion just piles up in bank reserves

11
Monetary Policy and Asset Prices
During the past quarter century, monetary authorities in developed countries have remarkably successful in reducing and stabilizing inflation. This phenomenon is coined” the great moderation”

12
Irrational exuberance
A common view was that asset prices are driven by exogenous shocks to investor beliefs or preferences that have little to do with underlying macro fundamentals. Greenspan, famously used the phrase irrational exuberance

13
Asset prices reflect expectations about economic growth
An alternative view is that asset markets Reflect evolving beliefs about the long term prospects for the economy, particularly trends about growth, rather than Irrational exuberance, which describe an exogenous shock to investor beliefs

14
Fluctuations in asset markets
The same period, however, has seen major fluctuations in asset markets. The equity bull markets during the 1980s and the 1990s, the boom and bust in technology stocks during the late 1990s and early 2000s, And the dramatic rise in hose prices that busted into the “great recession “

15
Early Warning In 2006 there were warning predictions: from a few studies : Ceccheti, in an empirical study, finds strong linkages between housing markets and the macroeconomy. Housing booms predict strong economic growth in the near term, weak economic growth in the longer term, and relatively high inflation.

16
Financial accelerator and inflation targeting
Gilchrist and Saito , use in the model the financial accelerator model : high asset prices increase the collateral of entrepreneurs and lower the external cost of funds for investment. They find, using standard loss function, that a policy of aggressive inflation targeting is less than ideal because, while stabilizing inflation, it allows the financial accelerator to destabilize output.

17
Two historical precedents
The Great Depression in the 1930s The Japanese Deflation(Mid -90s) The shocks that played a role in each: (1)An asset price correction, in real estate and equities (reducing consumption through a “wealth effect”) (2)Impairmaint of financial institutions’ balance sheets (reducing credit)
 The shocks that played a role in each: (1)An asset price correction, in real estate and equities (reducing consumption through a wealth effect ) (2)Impairmaint of financial institutions’ balance sheets (reducing credit)")
18
US GDP: The Cycles

19
Great Depression

20
Japan’s Stock-Market Roller Coaster

21
Tracking the Great Depression by months into the Crisis
Eichengreen and O’Rourke point out that the original Great Depression was most severe in America, while this one is more severe in a number of other countries.
![]()
22
Chronology of Crisis Sept 18, 2008—Bank of America bought Merril
Summer of 2007 Distress in financial markets from the subprime problem May 2008 Bear Stearns crushed and forced to be sold to JP Morgan Sept —Lehman Brothers went belly up. Sept 16, 2008: A.I.G. is effectively nationalized Sept 18, 2008—Bank of America bought Merril Lynch. December 2008—the Federal Reserve cuts interest rates virtually to zero

23
Understanding what’s going on is Like shooting at a moving target
Housing bubble. Subprime mortgage crisis Financial sector’s toxic assets Liquidity crisis Zero interest rate. Unconventional central banking Liquidity trap?

24
The Current Crisis vs. the Great Depression
(1) Both crises followed asset bubbles. (2) Both crises started in the financial sector and gradually spread to the real sector. During both crises many financial institutions either defaulted or had to be bailed out. (3)In both cases the crisis appears to have started with the bursting of a bubble. (4) In both cases banking credit dried up. (5) In both cases the lower zero bound on the policy rate became effective. (6) In both cases the crisis started in the US and then US and subsequently spread to other countries.
 Both crises followed asset bubbles. (2) Both crises started in the financial sector and gradually spread to the real sector. During both crises many financial institutions either defaulted or had to be bailed out. (3)In both cases the crisis appears to have started with the bursting of a bubble. (4) In both cases banking credit dried up. (5) In both cases the lower zero bound on the policy rate became effective. (6) In both cases the crisis started in the US and then US and subsequently spread to other countries.")
25
Key Differences 1. Responses of both fiscal and monetary policies today are much swifter and vigorous than they were during the first three years of the great depression The deficit declined in fiscal 1935 by roughly the same amount it had risen in 1934. The US was on a gold standard throughout the Depression. In April 1933, Rosevelt temporaryily suspended the convertibility to gold and let Dollar depreciate substantially. When US went back on gold at the new higher price of gold, large quantities of gold flowed in and caused expansion of money supply. The expansion of money broke expectations of deflation. .

26
Budget Balance and Monetary Base
2. Hoover’s Federal budget was largely balanced; budget deficit in the current crisis is 8-10 percent of GDP. Friedman and Schwartz (1963) claim that, during the first three years of the great depression, the Fed tolerated and even reinforced a substantial shrinkage of the money The monetary base was flat during ; it was doubled during 2008.
 claim that, during the first three years of the great depression, the Fed tolerated and even reinforced a substantial shrinkage of the money. The monetary base was flat during ; it was doubled during")
27
Differences 3. Unemployment: in 1930: 25 %; in May 2009 9.4%
Change in output: 1929-(peak) to 1933 (trough) -25%; 2007 (peak) last qtr 2008 (before trough) – 2% Change in prices: : deflation; : low inflation/deflation? See next slide
 to 1933 (trough) -25%; 2007 (peak) last qtr 2008 (before trough) – 2% Change in prices: : deflation; : low inflation/deflation See next slide.")
28
The graph, from the Cleveland Fed, shows inflation as gauged by the consumer price index and by a measure called the median CPI. As every grade school student learns when the teacher reports results of the latest test, the average of any data set can be thrown off by a few extreme outliers; the median is a more robust statistic to estimate the central tendency in the data.

29
Monetary institutions
4. There are two important differences in monetary institutions: First there was no banking deposit insurance at the time. As a matter of fact deposit insurance was introduced only after Roosevelt became president in March

30
Gold Standard the 5. US was in the great depression on the gold standard. The maintenance of a fixed parity with gold collided with the use of monetary policy to offset domestic unemployment during the first three years of the great depression. For this reason the US abandoned the gold standard under Roosevelt. Obviously, since the $ is floating vis-à-vis other major currencies, no such constraint operates in the current crisis.

31
Contractionary Policies under the Gold Standard
Central banks discount rates in the US, UK and Germany, in the late 1920s and early 1930s were pushed up to prevent gold leakages. The good news is that we donot have the Gold Standard now. But East European countries in crisis are now jacking up interest. Especially those who are trying to enter the Euro zone.

32
Informational capital
5. Fourth, the fact that a relatively large number of banks disappeared during the great depression led to the destruction of banking “informational capital” about the credit worthiness of potential borrowers.

33
Tariff War 6. The great depression was characterized by beggar thy neighbor policies. In mid 1930 the US Congress passed the Smoot-Hawley Tariff Act that raised tariffs on over 20,000 imported goods to record levels. Other countries retaliated by also imposing restrictions on imports and engaged in competitive devaluations. This led to a serious contraction of international trade.

34
The recession tracks the Great Depression

35
Irving Fisher’s debt deflation
As the great American economist Irving Fisher pointed out in the 1930s, the things people and companies do when they realize they have too much debt tend to be self defeating: when every one tries to do them, AT THE SAME TIME, the attempts to sell assets and pay off debt deepen the plunge in asset prices. This further reduces a net worth and the process repeats itself.

36
Keynes’ Metaphor for a Bubble
Consider beauty competitions famously described by John Maynard Keynes, in which the winner was the contestant who chose the six faces most popular with all contestants. The result, Keynes observed, was that the task was not to choose the most beautiful face, but the face that average opinion would think that average opinion would find the most beautiful. In this way beliefs feed on themselves and become divorced from any underlying reality.

37
The Basics of Banks Banks are in the business of borrowing short and lending long They create credit that allows the real economy grow When one or more banks experience a solvency problem due to non performing

38
Liquidity crisis Loans, bank run is possible. If a liquidity crisis erupts that can bring down other banks by a collective movement of distrust

39
THE LENDER OF LAST RESORT
The role of lender of last resort was classically defined by Walter Bagehot. His great book Lombard Street was published in 1873, and set out what has become the guiding mantra for central banks in times of crisis ever since: lend freely at high rates against good collateral. Lend freely, in his words, "to stay the panic". At high rates, so that "no one may borrow out of idle precaution without paying well for it". And lend on all good banking securities to an unlimited extent - because the "way to cause alarm is to refuse someone who has good security to offer". 39

40
Moral Hazard Large systematically important banks are able to obtain cash at near zero interest rate and engage in risky arbitrage activities. They know that the “invisible wallet” of the taxpayer stands behind them, to bail the banks out in case of a crisis.

41
Investment Banks By forcing the fourth largest investment bank, Lehman Brothers, into bankruptcy and Merrill Lynch into a distressed sale to Bank of America, they helped to facilitate a badly needed consolidation in the financial services sector. However, at the 2008 juncture, the credit crisis radiated out into corporate, consumer and municipal debt. Regardless of the Fed and Treasury’s most determined efforts, the political pressures for a much larger bail-out, and pressures from the continued volatility in financial markets, are going to be irresistible.

42
Bail Outs the financial crisis has probably already added at most $200bn-$300bn to net debt, taking into account the likely losses on nationalising the mortgage giants Freddie Mac and Fannie Mae, the costs of the $29bn March bail-out of investment bank Bear Stearns, the potential fallout from the various junk collateral the Federal Reserve has taken on to its balance sheet in the last few months, and finally, Wednesday’s $85bn bail-out of the insurance giant AIG.

43
Repo market and liquidity
In repo agreements borrowers transfer securities to lenders with an agreement to repurchase them later, often the next day. They enable banks and shadow banks to fund long-term, high-yield investments with short-term low-cost loans – which they did enthusiastically during the credit bubble: by 2008 the top US investment banks funded half their balance sheets in a repo market exceeding $10,000bn.

44
What is a Bank? Banks take people’s money, promise to give it back on demand – and lock it up in less liquid investments. This works marvellously while few enough lenders want their money back. It collapses when all want to hoard their cash at the same time. That is what happened to Lehman Brothers: the equivalent of a bank run in the repo market.

45
Lehman as a Custodian The panic was made worse, the Fed thinks, by the custodians’ exposure to losses as Lehman’s lenders left it to its fate. Custodians also faced conflicts of interest as counterparties to the repo-funded banks in other markets.

46
Limited Liability The core of the crisis lies in the legal provisions of limited liability: creditors have no claims against the personal assets of the owners (shareholders). These liability constraints lead to a systematic disregard of systemic disaster risks-ocurrences only with a small probability about gigantic losses.
. These liability constraints lead to a systematic disregard of systemic disaster risks-ocurrences only with a small probability about gigantic losses.")
47
Risk taking bahavior Investors that opt for high-risk projects with high potential gains and losses instead of safe projects with similar average profits, can expect to gain, since they only have to bear a portion of the possible losses. If things go well, investors reap the full profit. If things go badly, at worst their losses are limited by the stock of equity they invest.

48
Moral Hazard A HOUSE INSURED FOR MORE THAN ITS VALUE IS ALWAYS CONSIDERED A FIRE RISK. BUT HOME INSURANCE IS REGULATED AND ARSON IS A CRIMINAL OFFENCE THAT KEEPS PEOPLE HONEST, MOST OF THE TIME

49
Bank recapitalization
A severe fall in the market value of a financial institution's assets raises the risk and lowers the market value of its debt, as well as its equity. Bringing in new equity capital produces an equal (dollar for dollar) increase in the market value of assets. This lowers the risk and raises the market value of the institution's debt. As a result, part of the new equity capital shows up not as equity but as a transfer to debt holders. (This is the debt overhang problem.)
 increase in the market value of assets. This lowers the risk and raises the market value of the institution s debt. As a result, part of the new equity capital shows up not as equity but as a transfer to debt holders. (This is the debt overhang problem.)")
50
Who pays for the transfer?
Not the new private stockholders. They will not invest unless they get stock with market value at least equal to the funds they provide. This means the transfer of wealth to the old debt holders must come from the old stockholders. They pay via the dilution of their ownership share (and the drop in the share price) caused by bringing in new equity.
 caused by bringing in new equity.")
51
Value of old stock If the market value of the old stock before the equity issue is low, it may be insufficient to cover the transfer of wealth to debt holders that new equity capital produces. As a result, the market value of a stock issue would be less than the funds provided, and the financial institution's attempt to issue equity to meet its capital requirement will fail.

52
Subsidy If the Treasury steps in when the private market refuses to provide equity capital to a financial institution, we are in subsidy land. Again, the subsidy arises because a large part of the equity injection by the government does not end up as government (taxpayer) equity but rather goes to prop up the financial institution's debt holders.
 equity but rather goes to prop up the financial institution s debt holders.")
53
Determinants of Global Imbalances
Among the favoured determinants are low US savings (stressed especially by Feldstein 2008, 2009), Asia’s export-led growth strategy, reserve build-up, and exchange rate policies (discussed by many, including Bibow 2008, Obstfeld and Rogoff 2009,), and Asian “savings glut” (highlighted by Bernanke 2005, 2007, 2008, Bini Smaghi 2008, Wolf 2008, Greenspan 2010).
, Asia’s export-led growth strategy, reserve build-up, and exchange rate policies (discussed by many, including Bibow 2008, Obstfeld and Rogoff 2009,), and Asian savings glut (highlighted by Bernanke 2005, 2007, 2008, Bini Smaghi 2008, Wolf 2008, Greenspan 2010).")
54
US as the main Deficit country
Ben Bernanke (2005) argued that the US became the main deficit nation because of its service as global safe haven and reserve currency issuer, and because of the rapid growth in US household wealth from stock market gains and housing appreciation. The wealth effect kept savings low, perpetuating foreign borrowing.
 argued that the US became the main deficit nation because of its service as global safe haven and reserve currency issuer, and because of the rapid growth in US household wealth from stock market gains and housing appreciation. The wealth effect kept savings low, perpetuating foreign borrowing.")
55
Flows of money The flow of money into housing rather equipment or, say, software was linked to regulatory and supervisory gaps in mortgage underwriting and securitisation (Johnson and Kwak 2009).
.")
56
The Global Picture a la Krugman
we used to talk about the “subprime crisis” . Today we know that subprime lending was only a small fraction of the problem. Ben Barnanke (2005), “The Global Saving Glut and the U.S. Current Account Deficit,” offered a novel explanation for the rapid rise of the U.S. trade deficit in the early 21st century. The causes, argued Bernanke, lay not in America but in Asia.
, The Global Saving Glut and the U.S. Current Account Deficit, offered a novel explanation for the rapid rise of the U.S. trade deficit in the early 21st century. The causes, argued Bernanke, lay not in America but in Asia.")
57
Global Picture (Continued)
In the mid-1990s, Bernanke pointed out, the emerging economies of Asia had been major importers of capital, borrowing abroad to finance their development. But after the Asian financial crisis of , these countries began protecting themselves by amassing huge war chests of foreign assets, in effect exporting capital to the rest of the world.

58
Global Picture (Continued)
Most of the Asia cheap money went to the United States — hence our giant trade deficit, because a trade deficit is the flip side of capital inflows. But as Mr. Bernanke correctly pointed out, money surged into other nations as well. In particular, a number of smaller European economies experienced capital inflows that, while much smaller in dollar terms than the flows into the United States, were much larger compared with the size of their economies.

59
Global Picture (Continued)
wide-open, loosely regulated financial systems characterized the US shaddow banking system and mortgage institutions, as well as many of the other recipients of large capital inflows. This may explain the almost eerie correlation between conservative praise two or three years ago and economic disaster today. “Reforms have made Iceland a Nordic tiger,” declared a paper from the Cato Institute. “How Ireland Became the Celtic Tiger” was the title of one Heritage Foundation article; “The Estonian Economic Miracle” was the title of another. All three nations are in deep crisis now.

60
Global Picture (Continued)
For a while, the inrush of capital created the illusion of wealth in these countries, just as it did for American homeowners: asset prices were rising, currencies were strong, and everything looked fine. But bubbles always burst sooner or later, and yesterday’s miracle economies have become today’s basket cases, nations whose assets have evaporated but whose debts remain all too real. And these debts are an especially heavy burden because most of the loans were denominated in other countries’ currencies.

61
Global Picture (end) Nor is the damage confined to the original borrowers. In America, the housing bubble mainly took place along the coasts, but when the bubble burst, demand for manufactured goods, especially cars, collapsed — and that has taken a terrible toll on the industrial heartland. Similarly, Europe’s bubbles were mainly around the continent’s periphery, yet industrial production in Germany — which never had a financial bubble but is Europe’s manufacturing core — is falling rapidly, thanks to a plunge in exports.

62
Imbalances and Crisis Imbalances relaxed America’s credit constraint and perpetuated low US real interest rates that, in turn, stoked borrowing and the housing bubble Bernanke 2008, Caballero et al. 2008, Dunaway 2009, Obstfeld and Rogoff 2009, IMF 2009, Caballero and Krishnamurthy 2009, Blanchard and Milesi-Ferretti 2009, Roubini 2009, Kohn 2010).
.")
63
Global imbalances in 2010 With trade, credit, and commodity prices recovering, the IMF (2010) recently revised its projections of US current-account deficit to 3.3% of GDP in 2010 and 3.4% in Also UK, Canada, Australia, India, Turkey, France, and southern European nations are projected to run steep trade deficits. The mirroring surplus nations are the familiar China, Japan, emerging East Asia, Germany, and oil producing nations.
 recently revised its projections of US current-account deficit to 3.3% of GDP in 2010 and 3.4% in Also UK, Canada, Australia, India, Turkey, France, and southern European nations are projected to run steep trade deficits. The mirroring surplus nations are the familiar China, Japan, emerging East Asia, Germany, and oil producing nations.")
64
Europe vs. the US 27 EU countries lack ways of boosting their overall fiscal and monetary firepower by acting collectively. Europe has fallen short in terms of both fiscal and monetary policy: it’s facing at least as severe a slump as the United States, yet it’s doing far less to combat the downturn. On the fiscal side, America’s actions dwarf anything the Europeans are doing. Monetary policy: The European Central Bank has been far less proactive than the Federal Reserve; it has been slow to cut interest rates (it actually raised rates July 2008!), and it has shied away from any strong measures to unfreeze credit markets. The only thing working in Europe’s favor is the very thing for which it takes the most criticism — the size and generosity of its welfare states, which are cushioning the impact of the economic slump.
, and it has shied away from any strong measures to unfreeze credit markets. The only thing working in Europe’s favor is the very thing for which it takes the most criticism — the size and generosity of its welfare states, which are cushioning the impact of the economic slump.")
65
FDIC If a bank cannot raise private equity to meet its FDIC capital requirement, the powers of the FDIC kick in. For example, the FDIC can seize the bank and auction it off. The bidders are typically other banks. Acquiring a seized bank is often an attractive option for a strong bank since it can be a cost effective way to expand deposits and acquire links to profitable borrowers.

66
Price of acquiring a bank
The maximum price the acquiring bank should be willing to pay is the market value of the seized bank's assets minus the seized bank's deposits. This net amount is then distributed to the bank's non-deposit liability holders, in order of priority. What this means is that the seized bank's stockholders and some of its lower priority debt often get nothing.

67
Credit Crunch 2008

68
Interbank Lending’s Squeeze
68

69
Global Saving Glut Behind this Global Saving Glut lie three phenomena
1.–excess of retained profits (corporate saving) over investment, of the corporate sectors of the advanced countries, 2. --the persistent savings surpluses of a number of mature economies, particularly Japan and post-unification Germany. 69
 over investment, of the corporate sectors of the advanced countries, 2. --the persistent savings surpluses of a number of mature economies, particularly Japan and post-unification Germany. 69.")
70
Global imbalances

71
Currency reserves

72
The US moves into: debtor status, and vast increase in cross-holdings.
In 1996, on the eve of the Asian crisis, the US had assets overseas equal to 52 percent of GDP, and liabilities equal 57 percent of GDP. By 2007, these numbers were up to 128 percent and 145 percent, respectively.

73
Risk sharing and globalization
This is change is supposes to reduce risk: US investors held much of their assets abroad(less exposed to a slump in the US); foreign investors held much of their wealth in the US (they were less exposed to a slump in their domestic economies). But, large parts of the increase in globalization came from investments in highly leveraged financial institutions (making various riskycross border bets).
; foreign investors held much of their wealth in the US (they were less exposed to a slump in their domestic economies). But, large parts of the increase in globalization came from investments in highly leveraged financial institutions (making various riskycross border bets).")
74
Four vicious cycles “Four vicious cycles are simultaneously under way: falling asset prices are forcing levered holders to sell, driving prices further down; losses at financial institutions are reducing their ability to finance investment, which in turn reduces asset values, causing further losses; the weakness of the financial system is reducing growth, which in turn weakens the financial system; and falling output is hitting employment, which in turn leads to reduced demand for output”—Larry Summers.

75
Debt accumulation and deflation in the US
The big US debt accumulations were not by non-financial corporations but by households and the financial sector. The gross debt of the financial sector rose from 22 percent of GDP in 1981, to 117 percent of GDP in the third quarter of 2008; the debt of non financial corporations rose from 53 percent to 76 percent, in the same period. Thus, the desire of financial institutions to shrink balance sheet may be a cause of the recession.

76
Akerlof’s Problem When house prices started to decline, this has had bigger effect on some MBS than other MBSs, depending on the complexity of the mortgages that backed the securities. Owners of MBS have strong incentive to price each an every one of them. They have superior information over the market buyers. As in Akerlof’s Lemmons Problem, the market for MBS will collapse.

77
Market illiquidity The buyer hopes that the seller sells the security because he needs cash. But the buyer worries that the seller will unloads the most troubled securities. This makes the market illiquid.

78
Mortgage Finance The common form of mortgage commits the household to make equal monthly payments for 30 years. These mortgages payy off with 10 years because households sell the property or does refinance. New model: The borrower applies to a mortgage broker, receives money from a wholesale lender, and make payments to a servicer. The servicer passes on each payment to a master servicer, who pays it out to holders of a mortgage-based-security (MBS), who pass it on to the adminstrator of a collateralized debt obligation (CDO), who passes it on to investors in CDOs.
, who pass it on to the adminstrator of a collateralized debt obligation (CDO), who passes it on to investors in CDOs.")
79
Mortgage as option, not loan
This mortgage is therefore not a loan but an option: it allowed for gains if house prices rose, but cost relatively little if prices fell.

80
Barriers to Lending The Problem: most banks no longer hold the loans they make, content to collect interest until the debt comes due. Instead, the loans are bundled into securities and sold to investors. But the securitization market broke. The result is a drastic contraction of credit available throughout the economy. Banks have come to depend on selling mortgages and other loans to investors like hedge funds and insurance companies. This allows banks to make more loans and earn bigger profits.

81
Mortgage-backed Securities
How to value MBSs? Imagine you bought a $100,000 house a year ago, with a $10,000 down payment. If the value of the house rises, you are “in the money”. If it falls, you can walk away. You loose the original $10,000 investment, but are safe in the knowledge that the lender cannot seize your other assets..

82
US Borrowings

83
US banks, undermine willingness to expand credit, Destroy Confidence

84
House Price Bubble

85
US GDP

86
US Unemployment

87
counterparty risk DEFINITION:The risk that the other party in an agreement will default. In an option contract, the risk to the option buyer that the writer will not buy or sell the underlying as agreed. In general, counterparty risk can be reduced by having an financial organization with extremely good credit reputation which acts as an intermediary between the two parties.

88
Investors behavior in the asset bubble -“Disaster” Myopia : Equity markets lost by 2009 all the gains from the crises A tendency to underestimate the probability of disastrous outcomes, especially for low-frequency events last experienced in the distant past. The risk of falling victim to this syndrome was particularly acute in the recent period of unusual economic stability known as the “great moderation”. Investors were confronted by falling yields against a background of declining volatility in markets. Many concluded that a new era of low risk and high returns had dawned.

89
Investors in FX markets: Carry Trade—”depreciation myopia”
EQUALLY POPULAR WERE TRADING STRATEGIES SUCH AS CARRY TRADES, WHICH INVOLVED BORROWING AT LOW INTEREST RATES AND INVESTING AT HIGHER RATES, ESPECIALLY VIA THE CURRENCY MARKETS. FAVOURITE TRADES INCLUDED BORROWING IN JAPANESE YEN TO INVEST IN AUSTRALIA OR NEW ZEALAND, AND BORROWING IN SWISS FRANCS TO INVEST IN ICELANDIC ASSETS.

90
The danger in Carry Trade
Carry trade WAS DANGEROUS BECAUSE THE INTEREST RATE SPREAD COULD BE WIPED OUT IN SHORT ORDER BY VOLATILE CURRENCY MOVEMENTS. YET BECAUSE VOLATILITY REMAINED LOW FOR SO LONG, DISASTER MYOPIA PREVAILED. CARRY TRADERS WERE LULLED INTO A FALSE SENSE OF SECURITY, WHILE MORE SCEPTICAL COMPETITORS JOINED IN FOR FEAR OF UNDERPERFORMING.

91
The Credit Crunch 1. Overnight credit is blocked by the asymmetric information held across banks regarding each other’s assets’ quality. 2. Fear of the bank of being short of funds to meet creditor demands; thus the bank is reluctant to lend. 3. fear of the bank of being short of funds if investment opportunities get better.

92
Moral Hazard Moral hazard, a situation in which one person makes
a decision about How much risk to take while someone else bears the cost if things go badly; Treasury proposes to make low-interest, non-recourse, loans to private investors who buy bad assets —this is a plan to drive up the prices of toxic assets by creating a lot of moral hazard. By offering low interest non-recourse loans, these public-private entities can pay a higher than market price for the toxic assets (since there is no downside risk). This amounts to a direct subsidy from the taxpayers to the banks.
. This amounts to a direct subsidy from the taxpayers to the banks.")
93
Four distinct economic mechanisms that played a role in the liquidity and credit crunch
1. . The effects of large quantities bad loan write-downs on borrowers' balance sheets caused two "liquidity spirals“: 1a. As asset prices dropped, financial institutions not only had less capital; 1b. financial institutions also had harder time borrowing, because of tightened lending standards. The two spirals forced financial institutions to shed assets and reduce their leverage. This led to fire sales, lower prices, and even tighter funding, amplifying the crisis beyond the mortgage market.

94
Mechanisms (continued)
2. Lending channels dried up when banks, concerned about their future access to capital markets, hoarded funds from borrowers regardless of credit-worthiness. 3. Runs on financial institutions, as occurred at Bear Stearns, Lehman Brothers, and others following the mortgage crisis, can and did suddenly erode bank capital. 4. The mortgage crisis was amplified and became systemic through network effects, which can arise when financial institutions are lenders and borrowers at the same time. Because each party has to hold additional funds out of concern about counterparties' credit, liquidity gridlock can result.

95
The Geithner Public-private scheme to buy toxic assets from banks
One or more giant investment fund will be created to buy up toxic assets. Its balance sheet: for every $1 of toxic assets they buy from banks, the FDIC will lend 85.7 percent (6/7 th of $1), and the US treasury and private investors will each put 7.15 cents in equity to cover the remaining balance.
, and the US treasury and private investors will each put 7.15 cents in equity to cover the remaining balance.")
96
The Geithner Public-private scheme to buy toxic assets from banks (continue)
The FDIC loan is non-recourse, meaning that if the toxic assets purchased by private investors fall in value below the amount of the FDIC loans, the investment fund will default, and the FDIC will end up holding the toxic assets.

97
Tax payer giveaway in the Geithner Plan
An Example (Jeff Sachs): Consider a portfolio of toxic assets with a face value of $1 trillion. Assume that they have a 20 percent chance of paying out their full face value ($1 trillion) and an 80 percent chanceof paying out only $200 billion. The market value of these assets is given by their expected payout (.2x1+0.8x.2)=$360 billion. Because the FDIC is lending money at a low (bidding up the market value of toxic assets) interest rate on a non-recourse basis is likely to experience a massive default on the loan. The FDIC subsidy subsidy shows up as a bid price for the toxic assets as it above $360 billion.
: Consider a portfolio of toxic assets with a face value of $1 trillion. Assume that they have a 20 percent chance of paying out their full face value ($1 trillion) and an 80 percent chanceof paying out only $200 billion. The market value of these assets is given by their expected payout (.2x1+0.8x.2)=$360 billion. Because the FDIC is lending money at a low (bidding up the market value of toxic assets) interest rate on a non-recourse basis is likely to experience a massive default on the loan. The FDIC subsidy subsidy shows up as a bid price for the toxic assets as it above $360 billion.")
98
Over pricing the toxic assets through the government non-recourse loan
Investor is prepared to bid $714, 000 for the the asset that a risk-neutral would pay $360,000 only. How is this number derived? The investor uses $71,000 of her own money and $643,000 of the government loan– adding up to $714, 000 bid. If the asset pays in full, the investor repays the loan with a profit of $357,000 (=$1, $643,000) so that with 20 percent of the time, which bring an expected profit of $71,000. The other 80 percent of the time the investor defaults on the loan, getting a profit of 0, and the government ends up with $200,000. Summing up: the investor just breaks even by bidding $714, 000, as would beexpected in competitive auction.
 so that with 20 percent of the time, which bring an expected profit of $71,000. The other 80 percent of the time the investor defaults on the loan, getting a profit of 0, and the government ends up with $200,000. Summing up: the investor just breaks even by bidding $714, 000, as would beexpected in competitive auction.")
99
Price Discovery or Overpricing?
The idea of “price discovery” of the toxic asset would be genuine if the government loan has to be repaid whether or not the asset paid of in full or not. But, with the non-recourse loan it leads to overpricing of the toxic asset.

100
Gaming the System: Jeff Sachs Example
Consider a toxic asset held by Citibank with a face value of $1 million, but with zero probability of any payout and therefore with a zero market value. An outside bidder would not pay anything for such an asset.

101
More.. Suppose, however, that Citibank itself sets up a Citibank Public-Private Investment Fund (CPPIF) under the Geithner-Summers plan. The CPPIF will bid the full face value of $1 million for the worthless asset, because it can borrow $850K from the FDIC, and get $75K from the Treasury, to make the purchase! Citibank will only have to put in $75K of the total.
 under the Geithner-Summers plan. The CPPIF will bid the full face value of $1 million for the worthless asset, because it can borrow $850K from the FDIC, and get $75K from the Treasury, to make the purchase! Citibank will only have to put in $75K of the total.")
102
potential rip-off Citibank thereby receives $1 million for the worthless asset, while the CPPIF ends up with an utterly worthless asset against $850K in debt to the FDIC. The CPPIF therefore quietly declares bankruptcy, while Citibank walks away with a cool $1 million. Citibank's net profit on the transaction is $925K (remember that the bank invested $75K in the CPPIF) and the taxpayers lose $925K. Since the total of toxic assets in the banking system exceeds $1 trillion, and perhaps reaches $2-3 trillion, the amount of potential rip-off in the Geithner-Summers plan is unconscionably large.
 and the taxpayers lose $925K. Since the total of toxic assets in the banking system exceeds $1 trillion, and perhaps reaches $2-3 trillion, the amount of potential rip-off in the Geithner-Summers plan is unconscionably large.")
103
the insider-bidding route
The earlier criticisms of the Geithner-Summers plan showed that even outside bidders generally have the incentive to bid far too much for the toxic assets, since they too get a free ride from the government loans. But once we acknowledge the insider-bidding route, the potential to game the plan at the cost of the taxpayers becomes extraordinary. And the gaming of the system doesn't have to be as crude as Citibank setting up its own CPPIF. There are lots of ways that it can do this indirectly, for example, buying assets of other banks which in turn buy Citi's assets. Or other stakeholders in Citi, such as groups of bondholders and shareholders, could do the same.

104
Ersatz Capitalism? Ersatz is a German word meaning compensation or idemnity (or still, substitute). Ersatz capitalism is when the government in effect insure loses, so that loses are socialized but gains are privatized. The Geithner plan would not determine the fair price of toxic assets in the ailing banks. It sets a mechanism to price discovery on a “ put” on the toxic asset but not on the “value” of the asset. Its success in helping capitalize the banks is negatively related to loses to tax payers.
. Ersatz capitalism is when the government in effect insure loses, so that loses are socialized but gains are privatized. The Geithner plan would not determine the fair price of toxic assets in the ailing banks. It sets a mechanism to price discovery on a put on the toxic asset but not on the value of the asset. Its success in helping capitalize the banks is negatively related to loses to tax payers.")
105
Sources for charts: Robert Shiller, Andrew Smithers; Thomson Datastream

106
Just under half of corporate debt in America was rated as “speculative” (BB or below) at the end of 2008
 at the end of 2008")
107
Global Trends

108
Financial crises over the history

109
Global Crisis

110
US CREDIT MARKET

111
Volume of asset backed securities

112
House price index

113
Stimulus packages

114
No two fiscal packages are ever launched amid the same circumstances
It is wrong to extrapolate from the past! Measuring the separate effect of any One-off fiscal boost from the automatic Extra spending that was anticipated Is hard.

116
Fed Rate

117
Emerging stars buffeted by global storm

118
Triggers of credit bubbles and depression Economics
1. Moral hazard, a situation in which one person makes a decision about How much risk to take while someone else bears the cost if things go badly; 2. Self fulfilling panics, as in bank runs.

119
Credit Market : September 2008
financial institutions hold significant assets that are backed by mortgage payments. Two years ago, many of those mortgage-backed securities (MBS) were rated AAA, very likely to yield a steady stream of payments with minimal risk of default. This made the assets liquid. If a financial institution needed cash, it could quickly sell these securities at a fair market price, the present value of the stream of payments. A buyer did not have to worry about the exact composition of the assets it purchased, because the stream of payments was safe.
 were rated AAA, very likely to yield a steady stream of payments with minimal risk of default. This made the assets liquid. If a financial institution needed cash, it could quickly sell these securities at a fair market price, the present value of the stream of payments. A buyer did not have to worry about the exact composition of the assets it purchased, because the stream of payments was safe.")
120
Libor-OIS spreads reached 200 basis points in September 2008 when Congress failed to pass the Paulson plan

121
Bank bailouts

122
Japan’s 1990s Japan’s experience in the 1990s is cautionary example of the peril of propping up banks after a real estate boom ends. The Japanese government helped keep many troubled banks afloat, hoping to avoid the pain of bank failures, only to extend the economic downturn as consumer spending and job growth fell.

123
Japan’s Banks THE 1990 COLLAPSE OF AN ASSET BUBBLE PROVOKED A SHARP FALL IN THE VALUE OF PROPERTY AND EQUITY THAT UNDERPINNED BANKS’ BALANCE SHEETS. BUT BANKS IGNORED THEIR PROBLEMS UNTIL 1997 WHEN SANYO SECURITIES, YAMAICHI SECURITIES AND HOKKAIDO TAKUSHOKU BANK ALL FAILED.

124
Japan’s Current Account

125
Reluctance to recapitalize by state funds
A RELUCTANCE TO ADMIT THE SCALE OF THE PROBLEM MEANT CAPITAL INJECTIONS TOOK PLACE IN THREE MAIN TRANCHES. THE FIRST CAME IN THE SPRING OF 1998, WHEN THE GOVERNMENT INJECTED Y1,800BN ($18BN, £11BN, €14BN) INTO 21 INSTITUTIONS. THE MONEY, WHICH CAME IN THE FORM OF PREFERENCE SHARES, HAD FEW STRINGS ATTACHED. THE SECOND FOLLOWED THE COLLAPSE IN 1998 OF NIPPON CREDIT BANK AND LONG TERM CREDIT BANK. A TIGHTENING OF RULES FORCED 32 INSTITUTIONS TO RAISE CAPITAL AND IN 1999 TO ACCEPT GOVERNMENT FUNDS TOTALLING Y8,600BN.
 INTO 21 INSTITUTIONS. THE MONEY, WHICH CAME IN THE FORM OF PREFERENCE SHARES, HAD FEW STRINGS ATTACHED. THE SECOND FOLLOWED THE COLLAPSE IN 1998 OF NIPPON CREDIT BANK AND LONG TERM CREDIT BANK. A TIGHTENING OF RULES FORCED 32 INSTITUTIONS TO RAISE CAPITAL AND IN 1999 TO ACCEPT GOVERNMENT FUNDS TOTALLING Y8,600BN.")
126
Conditions set by government
Conditions grew stricter. “The first time, the government injections were very generous, depending on the banks’ own will. The second time was more forcible,” says the former BoJ official. “The first priority was that in a certain period they had to return from red to black, second was to lend to SMEs [small and medium-sized enterprises] and third was a host of conditions, such as cutting their payroll,”

127
Non performing loans By March 2005, non-performing loans were at 2.9 per cent of banks’ total assets from 8.4 per cent at the height of the crisis.

128
Sweden in the 1990s Sweden in the early 1990s took a middle pathswiftly taking over many of its troubled banks. The American bailout plan, economists say, takes a page from the Swedish example by making the government a shareholder in banks participating in the program. But, they add, the American banking system is so much larger and diverse than Sweden’s that the parallels are limited.

129
Capital injection and tax payers
In exchange for the capital injection by the government, taxpayers might be protected through preferred shares (or warrants), giving them dividends in the future.
, giving them dividends in the future.")
130
Differences between bailout and government spending
First, note that there is a major difference between a program to support the financial sector and $700bn in new outlays. No one is contemplating that the $700b in the Paulson plan will be given away. All of its proposed uses involve either purchasing assets, buying equity in financial institutions or making loans that earn interest.

131
2nd difference Second, the usual concern about GOVERNMENT BUDGET DEFICITS IS THAT THE NEED FOR GOVERNMENT BONDS TO BE HELD BY INVESTORS WILL CROWD OUT OTHER, MORE PRODUCTIVE, INVESTMENTS OR FORCE GREATER DEPENDENCE ON FOREIGN SUPPLIERS OF CAPITAL. TO THE EXTENT THAT THE GOVERNMENT PURCHASES ASSETS SUCH AS MORTGAGE-BACKED SECURITIES WITH INCREASED ISSUANCE OF GOVERNMENT DEBT, THERE IS NO SUCH EFFECT.

132
What’s Next? Green Shoots? Persistent and high unemployment?
Non functioning financial sector? Debt overhang? Inflation? Prolong risk and volatility?

134
long-term interest rates: 2009 treasuries
Peak of panic is June 2009

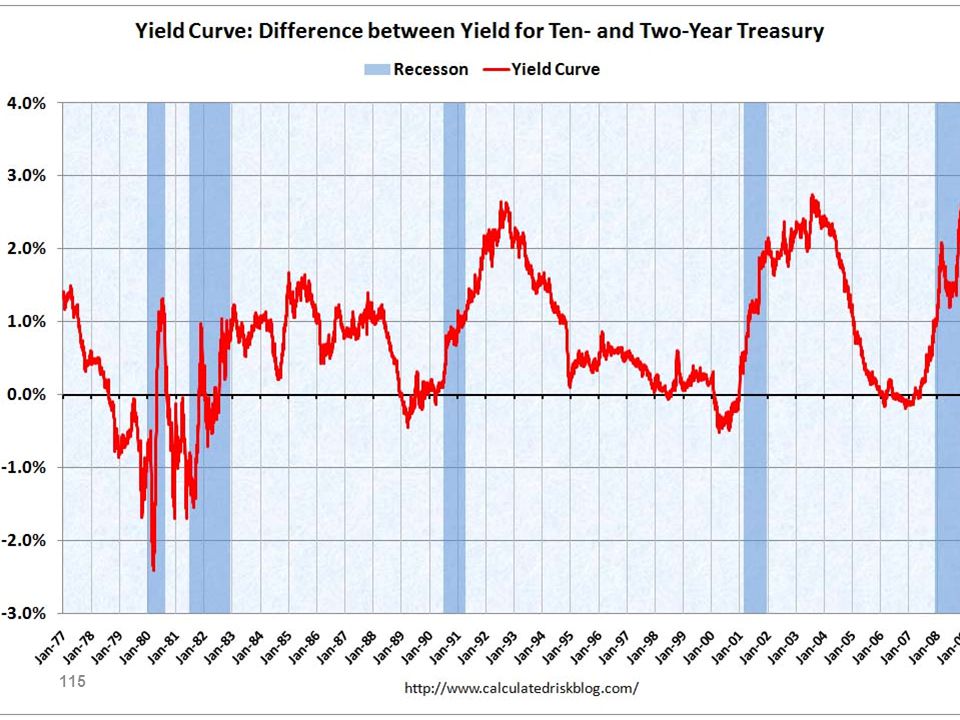
135
The yield curve as a predictor of future growth
This graph shows the difference between the 10-year and 2-year yield on Treasuries. In general, a steep yield curve--that is, a high value of this variable--is a positive indicator of future economic growth. In many ways, however, this is an unusual downturn, so it is not entirely clear to what extent historical relationships are a useful guide going forward

136
Treasuries (May 2009) sell-off
The sell-off may reflect fears of future inflation The downgrade of treasuries in the presence of huge US government debt

137
Paul De Grauwe on Mcroeconomics
Take government budget deficits, which now exceed 10 per cent of gross domestic product in countries such as the US and the UK. One camp of macroeconomists claims that, if not quickly reversed, such deficits will lead to rising interest rates and a crowding out of private investment. Instead of stimulating the economy, the deficits will lead to a new recession coupled with a surge in inflation.

138
Budget Deficits Wrong, says the other camp. There is no danger of inflation. These large deficits are necessary to avoid deflation. A clampdown on deficits would intensify the deflationary forces in the economy and would lead to a new and more intense recession.

139
Monetary Policy I take monetary policy. One camp warns that the build-up of massive amounts of liquidity is the surest road to hyperinflation and advises central banks to prepare an “exit strategy”.

140
Monetary Policy II Nonsense, the other camp retorts. The build-up of liquidity just reflects the fact that banks are hoarding funds to improve their balance sheets. They sit on this pile of cash but do not use it to increase credit. Once the economy picks up, central banks can withdraw the liquidity as fast as they injected it. The risk of inflation is zero

141
Does it Matter? Take the issue of government deficits. If you want to forecast the long-term interest rate, it matters a great deal which of the two camps you believe. If you believe the first one, you will fear future inflation and you will sell long-term government bonds. As a result, bond prices will drop and rates will rise. You will have made a reality of the fears of the first camp.

142
But… But if you believe the story told by the second camp, you will happily buy long-term government bonds, allowing the government to spend without a surge in rates, thereby contributing to a recovery that the second camp predicts will follow from high budget deficits.

143
Evidence? One day, when green shoots are popping up here and there, they believe the story warning about inflation; the next day, when the shoots turn brownish, they believe the other story. Disagreements among economists take away the intellectual anchors around which market participants interpret events and forecast the future.

144
Forecasts are ambigous
Ultimately, all our forecasts use a particular economic model to interpret data and to forecast their future course. The existence of wildly different models takes away this intellectual anchor and this translates into more market volatility.

145
Policy making under uncertainty
The two camps of economists have wildly different estimates of the effect of a 1 per cent permanent increase in government spending on real US GDP over the next four years. According to the first camp, the Ricardians, the multiplier is closer to zero than to one, ie 1 per cent extra spending generates much less than 1 per cent of extra GDP, producing little extra tax revenue. Thus budget deficits surge and become unsustainable.

146
What to do? By contrast, the second camp, the Keynesians, predict that the same 1 per cent of extra government spending multiplies into significantly more than 1 per cent of extra GDP each year until the end of This is the stuff of dreams for governments, because such multiplier effects are likely to generate additional tax income so that budget deficits decline.

147
US Consumer Spending: Summer 2009
In previous post-world war II recessions, inventory rebuilding contributed a third of economic growth 12 months after the recessions ended. Household debt was on average 60 percent of GDP in previous post-world war II recessions, in 2009 it is 128 percent of GDP. Consumption growth at the end of previous post-world war II recessions was significantly larger than in the recession.

148
“Credit easing” vs. “Quantitative "easing
“Credit easing” reflects a focus is on the assets’ side of the banks’ balance sheet “Quantitative easing”, reflects a focus on the liabilities’ side of the banks’ balance sheet

149
Money Growth vs Credit Growth: The Fed
The FED stopped tracking the broadest measure of money supply in 2006; no figures for the US in 2009. Outstanding consumer credit has been contracting from May to June, 2009 by 5 percent on an annual basis.

150
ECB ECB, in contrast to the US Fed, does indeed pay attention to the growth of Money In fact, ECB broad money growth began to accelerate in 2009

151
US Productivity Productivity soared by a higher-than-expected 6.4 per cent in the non-farm business sector in the second quarter, its highest level since 2003, as hours worked fell faster than output

152
Asia: early exit from the Recession

153
Eurozone Germany and France, partly helped by its neighbour’s stimulus, exited recession in the second quarter of Both countries’ 0.3 per cent quarter-on-quarter growth yanked up the eurozone as a whole to a mere 0.1 per cent contraction.

154
Japan

155
Spain can’t devalue to restore lost competitiveness
UK Can!

156
China has the world’s fastest-growing economy and largest current account surplus

157
Greece Greece accounts for less than
3 per cent of the eurozone economy. There is also a precedent. Hungary, Latvia and Romania have all won EU and International Monetary Fund backing, albeit with tough conditions attached.

158
Fed Balance Sheet Exit from unconventional monetary policy.

159
Israel Growth

160
China in a Dilemma Having set in motion a credit and investment-fuelled recovery to manufacture strong growth in the 60th anniversary year of the People’s Republic, China is beginning to face the consequences.

161
Renminbi exchange rate

162
Policy switch China lifted its currency peg in July It allowed the renminbi to appreciate by 21 percent over three years to mid when the peg was reinstated: the “emergency setting” of the renminbi/dollar peg, reimposed in July May 2010’s export surge of almost 50 per cent from a year earlier, the biggest in six years, restored China’s monthly trade surplus comfortably above its five-year average. The basket of 2005 to 2008 returned in June , along with the same daily trading band.

163
US Base Money Fed now pays interest on reserves. As long as the interest rate on reserves is high enough, banks should be happy to hold onto those excess reserves.

164
Both reserves and T-bills are interest-paying obligations of the Federal government (including the Federal Reserve). perfect substitutes. The standard way of reducing the monetary base is open market operations. The Fed sells Treasury bills, say, and drains reserves from the banking system, reducing the monetary base. But consider what this means in the monetary current regime. An open market operation merely removes interest-paying reserves from a bank's balance sheet and replaces them with interest-paying T-bills. What difference does it make? None at all.

165
Global Imbalances China’s accumulation of foreign reserves, many of which were invested in American bonds, was arguably doing US a favor by keeping interest rates low — although what US did with those low interest rates was mainly to inflate a housing bubble. But right now the world is awash in cheap money, looking for someplace to go. Short-term interest rates are close to zero; long-term interest rates are higher, but only because investors expect the zero-rate policy to end some day. China’s bond purchases make little or no difference.

166
If China were to start selling dollars?
Right now the world is awash in cheap money. So if China were to start selling dollars, there’s no reason to think it would significantly raise U.S. interest rates. It would probably weaken the dollar against other currencies — but that would be good, not bad, for U.S. competitiveness and employment. So if the Chinese do dump dollars, US should send them a thank-you note.

167
China’s Mercantilism Under normal circumstances, the inflow of dollars from trade surpluses would push up the value of China’s currency, unless it was offset by private investors heading the other way. And private investors are trying to get into China, not out of it. But China’s government restricts capital inflows, even as it buys up dollars and parks them abroad, adding to a $2 trillion-plus hoard of foreign exchange reserves. China’s trade surplus drains much-needed demand away from a depressed world economy.

168
China Mercantilism and US jobs
Paul Samuelson: “With employment less than full ... all the debunked mercantilistic arguments” — that is, claims that nations who subsidize their exports effectively steal jobs from other countries — “turn out to be valid.” He then went on argue that persistently misaligned exchange rates create “genuine problems for free-trade apologetics.” The best answer to these problems is getting exchange rates back to where they ought to be. But that’s exactly what China is refusing to let happen.

169
A narrowing of China’s current-account surplus, from 11% of GDP at its peak in 2007 to 6.1% in 2009.
America’s huge trade deficit with China sets it apart from many other G20 members. Japan has a surplus of $45.5 billion with China and South Korea $59.1 billion. Even Brazil can boast more than $14 billion. In the past 12 months China has run a trade deficit with the G20 excluding America (even counting the entire European Union as a member).
.")
Similar presentations


 Geometry (29%)>")


