Download presentation
Presentation is loading. Please wait.

1
GDP – measures legal production in the U.S. in one year.
To Count or Not To Count What 8 Things Do Not Count In GDP GDP – measures legal production in the U.S. in one year. GDP measures all final goods/services produced by workers and capital located in the U.S., regardless of ownership. [Domestically located resources] Final goods are goods ready for consumption.

2
Eight Things Not Counted in GDP
[no production] Second Hand Sales[no production] Public/Private Transfer Payments Purely Financial Transactions Intermediate Goods 5. U.S. Corporations producing overseas 6. Non-market transactions [household or volunteer work] Underground Economy 7. Illegal business activity 8. Unreported legal business activity

3
What Eight Things Do Not Count In GDP?
Intermediate Goods – components of the final good. A. Ford buys batteries or tires for its cars. B. KFC buys chickens to eventually sell to customers.

4
This falls under the rule of “Do Not Double Count”.
GDP - what is not counted 2nd Hand Sales – no current production. A Chevy bought in 2010 This falls under the rule of “Do Not Double Count”. 57 Chevy Salesman [It has not been produced again in 2010 & would not count.] The salesman is doing productive work. His commission would count. B. Boots produced in 1980 are bought in a Thrift Store in 2011. They also have not been produced again. Salesman’s commission would count. You are buying his services. Shoe salesman

5
GDP - what is not counted
Purely Financial Transactions – stocks, bonds, CDs. There is no current production. Ex: If 100 shares of Dell stock is bought Buying stock is not buying a product but buying ownership of the firm. Buying bonds is making a loan. I’m not buying a Dell computer but part ownership of Dell. Exchanging one financial asset for another. This represents transfer of ownership from one shareholder to another. [swapping bits of paper].

6
GDP – what is not counted
A. Public Transfer Payments–welfare, unemployment, social security. [There is no contribution to final production] “Now that I’ve gotten my welfare check, I can get a white iPad 2” B. Private Transfer Payments, like your parents giving you $250 cash for Christmas, or - $100 for making an “A” in economics. [Just transferring funds from one private individual to another private individual]

7
Unreported “Legal” Business Activity
Unreported “legal” business activity does not count. This is two-thirds of the “underground economy.” Before LASIK Surgery Then he has LASIK but the surgeon doesn’t report $500 of his $3,400 bill? And what if the dentist doesn’t report $400 for teeth whitening? And what if this waitress doesn’t report all tips?

8
Illegal business activity is also not counted.
Illegal business activity, because it goes unreported, also does not count. Making up 1/3 of the “underground economy,” also called the [“black market”]. It includes murder for hire, gambling, drugs, prostitution, and money laundering. And, what is money laundering? “Give me the money in your purse. At least it will not count in GDP!” Money Laundering Making money illegally (drug money) and making it look like it was legally earned (like buying a laundry mat or car wash that deal in cash) and report it as legally earned. “Ida Ho”
 and making it look like it was legally. earned (like buying a laundry mat. or car wash that deal in cash) and. report it as legally earned. Ida Ho")
9
U.S. Underground Economy What doesn’t get reported
Illegal $300 B Legal $600 B Drugs $120 Bribery $35 Self Employed $255 Gambling and Loan Sharking $10 Other Legal $25 Rents & Royalties $30 Pornography $20 Fraud $30 Corporate Profits $50 Other Illegal $20 Prostitution $30 Interest $55 Stolen Goods $35 Wages and Salaries $185 What gets reported is the “Above Ground” What doesn’t get reported is the “Underground”

10
Non-market Transactions Are Not Counted
Work in your own household or volunteer work in the community does not count because there was no payment. You need to do some of this housework.

11
or fitness instructor, or you will hurt GDP.
Non-market Transactions Are Not Counted Work in your own household or volunteer work in the community does not count because there was no payment. So, don’t marry your maid, yardman, or fitness instructor, or you will hurt GDP.

12
U.S. Corporations Producing Goods Overseas
GM in France Nike in Indonesia If U. S. corporations produce goods overseas, it does not count in GDP, but would count in GNP. Remember, we are measuring production inside the U.S. Imports represent production outside of the U.S.

13
Is It Counted In GDP? Underground Economy [not reported] Example:
On the next slide, read each sentence and determine, “To Be or Not To Be Counted?” That is the question. If “Yes”, put “Y” and tell if it is “C”, “Ig”, “G”, or “X”. If “No”, put “N” and give the number from below on why it is not counted in GDP. GDP DOES NOT INCLUDE 1. Second hand sales [no current production] [but the salesman’s commission counts] 2. Public/Private transfer payments [no current production] 3. Purely financial transactions [no current production] [broker’s fees do count] 4. Intermediate goods [component of final good] 5. U.S. corporations producing overseas. 6. Non-market transactions [ household or volunteer work. Underground Economy [not reported] 7. Illegal business activity [prostitution, murder-for-hire, illegal drugs, etc.] 8. Unreported legal business activity [“off the books”] Example: ___ ___ 1. New Toyota Tundra truck manufactured in San Antonio and sold to your economics teacher the year it was produced. ___ ___ 2. You buy a new Wii at GameStop in Does it count if you resell it on eBay in March of 2010? C Y 1 N
![Is It Counted In GDP Underground Economy [not reported] Example:](http://slideplayer.com/slide/1391267/3/images/13/Is+It+Counted+In+GDP+Underground+Economy+%5Bnot+reported%5D+Example%3A.jpg "On the next slide, read each sentence and determine, To Be or Not To Be Counted That is the question. If Yes , put Y and tell if it is C , Ig , G , or X . If No , put N and give the number from below on. why it is not counted in GDP. GDP DOES NOT INCLUDE. 1. Second hand sales [no current production] [but the salesman’s commission counts] 2. Public/Private transfer payments [no current production] 3. Purely financial transactions [no current production] [broker’s fees do count] 4. Intermediate goods [component of final good] 5. U.S. corporations producing overseas. 6. Non-market transactions [ household or volunteer work. Underground Economy [not reported] 7. Illegal business activity [prostitution, murder-for-hire, illegal drugs, etc.] 8. Unreported legal business activity [ off the books ] Example: ___ ___ 1. New Toyota Tundra truck manufactured in San Antonio and. sold to your economics teacher the year it was produced. ___ ___ 2. You buy a new Wii at GameStop in Does it. count if you resell it on eBay in March of 2010 C. Y. 1. N.")
14
Is It Counted In GDP? C Y 6 N 6 N 3 N 6 N 1 N C Y 6 N 8 N 7 N 6 N 6 N
___ ___ 1. You buy a purple “Tinky Winky”, [produced in TX] from Wal-Mart. ___ ___ 2. You and your family paint your house. [labor involved] ___ ___ 3. You marry your housemaid. [“working-for-love”] [her services] ___ ___ 4. You buy 100 shares of Microsoft Corporation. ___ ___ 5. You volunteer to babysit your little sister to help your parents while they work. ___ ___ 6. Bob buys a 1965 ford Mustang convertible, in 2010, which is in mint condition. ___ ___ 7. The salesman gets a commission [pay] for selling that 1965 Ford Mustang in 2010. ___ ___ 8. You and your friend volunteer to cook at the senior class picnic. ___ ___ 9. Dr. Payne does $1,000 worth of dental work but reports only $500 of it. Does the $500 the dentist keeps and doesn’t report count? ___ ___ 10. You are given suitcase full of $100 bills from the sale of smuggled drugs. ___ ___ 11. Your mother is teaching you to read [& not having much success]. ___ ___ 12. Your dad bakes you a home-baked loaf of bread. [his labor] ___ ___ 13. You buy a loaf of bread from Kroger’s Grocery Store. ___ ___ 14. The U.S. government purchases 5 B-2 Bombers for $2 B each. ___ ___ 15. Ford buys a ton of sheet metal used in making car doors. ___ ___ 16. You buy a new “iPad 2” [produced in China] from the Apple store. ___ ___ 17. You send in a $90 check to your dentist for cleaning your teeth. ___ ___ 18. Your family buys a new house next to the mansion of Bill Gates. ___ ___ additional teachers are hired by the Frisco ISD. ___ ___ 20. GM invest in $500 million worth of robots to assemble their cars. ___ ___ 21. You volunteer 10 hours a week of your time to work for senior citizens. ___ ___ 22. Ford produces 25,000 F150s in Denver which are not sold by the end of the year. ___ ___ 23. Russia buys 3,000 Dell computers, produced in NY, as they become Rusky Dell Dudes. ___ ___ 24. A man’s wife does all his cooking and sewing, working for him 16 hours per day. ___ ___ 25. Nike produces $10 million worth of Nike Air Jordan’s in Vietnam. C Y 6 N 6 N 3 N 6 N 1 N C Y 6 N 8 N 7 N 6 N 6 N 1. 2nd Hd sales 2. Transfers 3. Financial 4. Intermediate 5. Overseas 6. Non-market 7. Illegal 8. Unreported C Y G Y 4 N 5 N C Y Ig Y G Y Ig Y 6 N Ig Y X Y 6 N 5 N

15
National Income Accounting
Gross Domestic Product GDP= C +I+G+Xn = Consumption + Investment +Government Spending+ Net Exports [(all exports) X-M (all imports)] Net Domestic Product (your value-what you could sell if ya had to!) NDP= GDP- Depreciation (the loss of value over time- replacement cost) National Income NI= NDP +NFFIEUS-Statistical Discrepancy Net Foreign Factor Income earned in US Personal Income (what you can pay in taxes, spend or save!) PI= NI- Undistributed Corporate Profits–Corporate Income Taxes -Social Security-Taxes on production & iMports +Transfer Payments Disposable Income (what you can spend or save!) DI= PI- personal income taxes U Can See The Toilet Paper
 X-M (all imports)] Net Domestic Product (your value-what you could sell if ya had to!) NDP= GDP- Depreciation (the loss of value over time- replacement cost) National Income. NI= NDP +NFFIEUS-Statistical Discrepancy. Net Foreign Factor Income earned in US. Personal Income (what you can pay in taxes, spend or save!) PI= NI- Undistributed Corporate Profits–Corporate Income Taxes -Social Security-Taxes on production & iMports +Transfer Payments. Disposable Income (what you can spend or save!) DI= PI- personal income taxes. U Can See The Toilet Paper.")
16
Elaborate Circular Flow Showing NIA
D P PI DI NDP NI

17
expenditure approach] Gross Domestic Product National Domestic Product
18th Ed. NIA – 2009 [$14,256] “U Can See The ToiletPaper” $10, 089 [“C”] Consumption [66%] -Depreciation [Replacement Cap.] $1,864 -$418 Undis Cor Pro -$315 Corp Inc Tax -$967Soc Sec Con -1090 Taxes on pro.& M +N.F.F.I. $105 Y earned/not received -Statistical Discrep. $209 [to make the income approach match the expenditure approach] +$2,528 Trans Pay Y received/not earned $12,392 [births-deaths] “Available for sale” $12,026 PI is what we can spend, save, or pay in taxes. “Income received by households, whether earned or unearned” Personnel Taxes -$1,102 Gross Private Domestic Investment $1, 628 $12,288 “Income earned by U.S. resources” plus taxes on pro- duction & imports $10,924 DI is what we can SPEND or SAVE. ROW[$264] U.S. [$159] NFFI = $105 Government Purchases $2,931 Xn(X-M) -$392 GDP Gross Domestic Product $14,256 NDP National Domestic Product $12,392 NI National Income $12,288 PI Personal income $12,026 DI Disposable Income $10,924
![expenditure approach] Gross Domestic Product National Domestic Product](http://slideplayer.com/slide/1391267/3/images/17/expenditure+approach%5D+Gross+Domestic+Product+National+Domestic+Product.jpg "18th Ed. NIA – 2009 [$14,256] U Can See The ToiletPaper $10, 089. [ C ] Consumption. [66%] -Depreciation. [Replacement Cap.] $1,864. -$418 Undis Cor Pro. -$315 Corp Inc Tax. -$967Soc Sec Con Taxes on pro.& M. +N.F.F.I. $105. Y earned/not received. -Statistical Discrep. $209. [to make the income. approach match the. expenditure approach] +$2,528 Trans Pay. Y received/not earned. $12,392. [births-deaths] Available. for sale $12,026. PI is what we. can spend, save, or pay in taxes. Income. received by. households, whether. earned or. unearned Personnel. Taxes. -$1,102. Gross Private. Domestic. Investment. $1, 628. $12,288. Income earned. by U.S. resources plus taxes on pro- duction & imports. $10,924. DI. is what we can. SPEND. or. SAVE. ROW[$264] U.S. [$159] NFFI = $105. Government. Purchases. $2,931. Xn(X-M) -$392. GDP. Gross Domestic Product. $14,256. NDP. National Domestic Product. $12,392. NI. National Income. $12,288. PI. Personal income. $12,026. DI. Disposable Income. $10,924.")
18
Depreciation, Investment & Disinvestment
Negative Net Investment Depreciation exceeds Ig Positive Net Investment Ig exceeds Depreciation In Investment of $531 bil. Ig $2,105 Trillion Depreciation 1933 $7.6 billion [in current dollars] Disinvestment of $6 billion Great Depression [1933] Declining productive capacity Expanding productive capacity Depreciation 2005 $1,574 Trillion Ig $1.6 billion Ig($1.6) - D($7.6) = (Disinv. of $6) (Disinvest. of $6) + D($7.6)=($1.6) Ig($1.6)–Disinv.($6)=(Depr. of $7.6) Ig($2,105) - D($1,574) = (In of $531) In($531) + D($1,574) = (Ig of $2,105) Ig($2,105)-In($531)=(Depr. of $1,574)
 - D($7.6) = (Disinv. of $6) (Disinvest. of $6) + D($7.6)=($1.6) Ig($1.6)–Disinv.($6)=(Depr. of $7.6) Ig($2,105) - D($1,574) = (In of $531) In($531) + D($1,574) = (Ig of $2,105) Ig($2,105)-In($531)=(Depr. of $1,574)")
19
N.F.F.I. = $10 billion Rest of World $210 billion N.F.F.I.
[U.S.A. Profits Overseas] Rest of World $220 billion Foreign Profits in U.S.A. $210 billion N.F.F.I. = $10 billion If U.S. profits in the ROW [$220] are greater than foreign profits in the U.S. [$210], add the difference.

20
[18th Edition] NIA Practice – “How To Do It”
Personal taxes Undistributed corp. profits Imports Social Security contrib +Transfer payments Personal consumption ,316 -Corporate Income Taxes Gross private domes invest -Taxes on prod. & imports Government purchases Exports Depreciation [Capital consumption] 307 Statistical Discrepancy N.F.F.I.E. in the U.S C = $_______ Ig = $_______ G = $_______ Xn = $_______ Gross Domestic Product (GDP) -Consumption of fixed capital Net Domestic Product (NDP) +Net For. Factor Inc. Earn. U.S. -Statistical Discrepancy National Income (NI) -Undistributed Corporate Profits -Corporate income taxes -Social Security Contributions -Taxes on prod. & imports +Transfer payments Personal Income (PI) -Personal Taxes Disposable Income (DI) I’m going through an academic recession. 2,316 503 English C Accounting C American History D Economics F 673 +103 ROW $100 3,595 -307 3,288 -12 -10 $112 3,266 -46 -88 -534 -169 NFFI = -$12 -231 +283 3,015 -403 2,612
![[18th Edition] NIA Practice – How To Do It](http://slideplayer.com/slide/1391267/3/images/20/%5B18th+Edition%5D+NIA+Practice+%E2%80%93+How+To+Do+It.jpg "Personal taxes 403 -Undistributed corp. profits 46. Imports 362 -Social Security contrib Transfer payments 283 Personal consumption 2,316. -Corporate Income Taxes 88 Gross private domes invest Taxes on prod. & imports 231 Government purchases 673. Exports 465 Depreciation [Capital consumption] 307. Statistical Discrepancy 10 N.F.F.I.E. in the U.S C = $_______. Ig = $_______. G = $_______. Xn = $_______. Gross Domestic Product (GDP) -Consumption of fixed capital. Net Domestic Product (NDP) +Net For. Factor Inc. Earn. U.S. -Statistical Discrepancy. National Income (NI) -Undistributed Corporate Profits. -Corporate income taxes. -Social Security Contributions. -Taxes on prod. & imports. +Transfer payments. Personal Income (PI) -Personal Taxes. Disposable Income (DI) I’m going through an academic recession. 2, English C. Accounting C. American History D. Economics F ROW. $100. 3, , $112. 3, NFFI = -$ , ,612.")
23
Business Cycle Time Inflation Expansion Expansion PEAK PEAK
Economic Growth, Business Cycles & Instability [Inflation and Unemployment] PEAK Business Cycle PEAK Inflation “Too much money” GROWTH TREND Expansion Contraction Expansion Contraction TROUGH Level of business activity Trough Unemployment Time

24
Real Capital Real Capital Real Capital
We ONLY have Economic Growth when we expand the size of the productive capacity of the economy - the ability to produce MORE goods and services. Real Capital Real Capital Real Capital

25
Labor and Productivity
There are two main ways in which RGDP can grow. 1. Increase in inputs [land, labor, or capital] {33%} 2. Increase in productivity of these inputs {66%} Size of employed labor force Quantity of real capital Discovery of new raw materials Increase in inputs [such as land, labor and capital] [33%] Average hours of work x Real GDP = Technological advance Education and training Use resources in the least costly way [Productive efficiency] Allocate resources among production techniques that produce goods/services that maximize society’s well-being. Increase productivity of these inputs [66%]

26
The “Big Three” in Economics
1. Real GDP 2. Unemployment 3. Core Inflation [taking out food and energy]

27
Nominal GDP Real GDP and What is the difference between
[prices of output in the current year] [measures “output and prices”] and Real GDP [base year prices of the year being measured] [measures “only output”]

28
Importance of Real GDP in Determining a Recession
Real GDP measures current output at base-year prices. Apple GDP Example A country produces 10 apples in base year x $1; Nominal [current] & Real [constant]GDP both=$10 Year 2: A country produces 10 apples x $1.25; Nominal GDP=$12.50 (no recession but worse off) [Real GDP would = $10 (10 apples x $1)] Or Year 2: A country produces 9 apples x $1.25; Nominal GDP=$11.25 but real is $9 (9 apples x $1) (recession although nominal GDP is up)
 [Real GDP would = $10 (10 apples x $1)] Or Year 2: A country produces 9 apples x $1.25; Nominal GDP=$11.25 but real is $9 (9 apples x $1) (recession although nominal GDP is up)")
29
Nominal [ ] GDP v. Real GDP
Base year[$50/$50=1x100=100] $46/$50x100=92 [deflation of 8%] Price of Market Basket(2001) [nominal GDP] $64 GDP Price Index = Price of same Market Basket(1998)x100; [Real GDP] $50x100=128 [GDP Deflator] in the base year (1998) [$64/128 x 100 = $50] Nominal [Current) GDP v. Real (constant) GDP
![Nominal [ ] GDP v. Real GDP](http://slideplayer.com/slide/1391267/3/images/29/Nominal+%5B+%5D+GDP+v.+Real+GDP.jpg "Base year[$50/$50=1x100=100] $46/$50x100=92 [deflation of 8%] Price of Market Basket(2001) [nominal GDP] $64. GDP Price Index = Price of same Market Basket(1998)x100; [Real GDP] $50x100=128. [GDP Deflator] in the base year (1998) [$64/128 x 100 = $50] Nominal [Current) GDP. v. Real (constant) GDP.")
30
“GDP” Balloon [Real GDP=Nominal GDP/GDP Deflator X 100]
[$13,847] Inflation component GDP Deflator [119.98] Real GDP $11,541 Real GDP [& Nominal GDP] $9,847 Base Year + $1,694 trillion 2000 [not $4 trillion] 2006 Nominal GDP – measured in terms of money. [Current output measured in current prices] Real GDP – measured in terms of goods/services. [Current output measured in base-year prices] Real GDP takes the “air” out of the nominal GDP “balloon”. The effects of inflation have been eliminated, so the remaining changes are “real” changes.
![GDP Balloon [Real GDP=Nominal GDP/GDP Deflator X 100]](http://slideplayer.com/slide/1391267/3/images/30/GDP+Balloon+%5BReal+GDP%3DNominal+GDP%2FGDP+Deflator+X+100%5D.jpg "[$13,847] Inflation. component. GDP Deflator [119.98] Real GDP. $11,541. Real GDP. [& Nominal GDP] $9,847. Base Year. + $1,694 trillion [not $4 trillion] Nominal GDP – measured in terms of money. [Current output measured in current prices] Real GDP – measured in terms of goods/services. [Current output measured in base-year prices] Real GDP takes the air out of the nominal GDP balloon . The effects of inflation have been eliminated, so the. remaining changes are real changes.")
31
Depreciation, Investment & Disinvestment
Negative Net Investment Depreciation exceeds Ig Positive Net Investment Ig exceeds Depreciation In Investment of $531 bil. Ig $2,105 Trillion Depreciation 1933 $7.6 billion [in current dollars] Disinvestment of $6 billion Great Depression [1933] Declining productive capacity Expanding productive capacity Depreciation 2005 $1,574 Trillion Ig $1.6 billion Ig($1.6) - D($7.6) = (Disinv. of $6) (Disinvest. of $6) + D($7.6)=($1.6) Ig($1.6)–Disinv.($6)=(Depr. of $7.6) Ig($2,105) - D($1,574) = (In of $531) In($531) + D($1,574) = (Ig of $2,105) Ig($2,105)-In($531)=(Depr. of $1,574)
 - D($7.6) = (Disinv. of $6) (Disinvest. of $6) + D($7.6)=($1.6) Ig($1.6)–Disinv.($6)=(Depr. of $7.6) Ig($2,105) - D($1,574) = (In of $531) In($531) + D($1,574) = (Ig of $2,105) Ig($2,105)-In($531)=(Depr. of $1,574)")
32
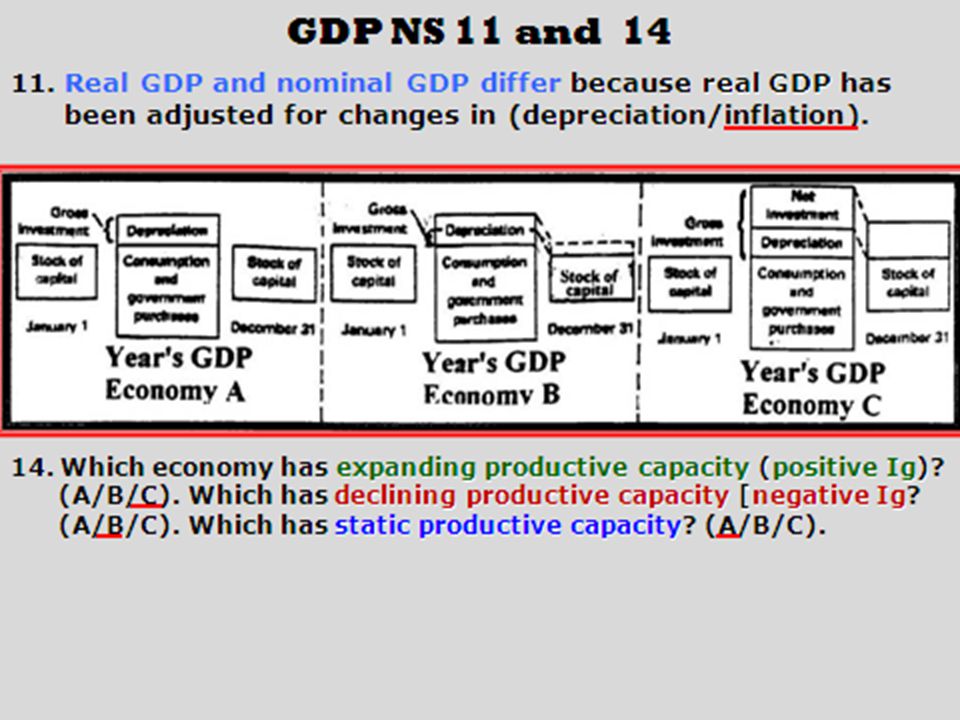
Expanding/Static/Declining Productive Capacity
increased Expanding Productive Capacity Maintaining our production possibilities No change Static Productive Capacity decreased Declining Productive Capacity

33
SHORTCOMINGS OF GDP Non-market Transactions don’t count
Earthquakes, divorces, etc. increase GDP Leisure isn’t factored in Improved Product Quality The Underground Economy GDP’s impact on the Environment Per Capita Output Countries with low GDP per capita have more infants with low birth weight, higher rates of infant mortality, higher rates of maternal mortality, higher rates of child malnutrition, and less common access to safe drinking water. Also, fewer go to school and they have fewer teachers. They have fewer TVs and telephones, fewer paved roads. They also win fewer Olympic medals.

34
GDP Deflator[GDP Price Index] = Later CPI/Base CPI x 100
Market Basket cost $50.00 in base year. Base Year $50.00/$50.00 x 100 = 100 Later year, let’s say the basket cost $75.00. $75.00/$50.00 x 100 = 150 or 50% inflation Later year, Let’s say the basket cost $25.00. $25.00/$50.00 x 100 = 50 or 50% deflation.
![GDP Deflator[GDP Price Index] = Later CPI/Base CPI x 100](http://slideplayer.com/slide/1391267/3/images/34/GDP+Deflator%5BGDP+Price+Index%5D+%3D+Later+CPI%2FBase+CPI+x+100.jpg "Market Basket cost $50.00 in base year. Base Year $50.00/$50.00 x 100 = 100. Later year, let’s say the basket cost $ $75.00/$50.00 x 100 = 150 or 50% inflation. Later year, Let’s say the basket cost $ $25.00/$50.00 x 100 = 50 or 50% deflation.")
35
Macroeconomic Formulas Warning!!!!
[Know these formulas - they will be on your next test.] Warning!!!! [Failure to learn these means no graduation and living in "perpetual poverty."]

36
Nominal GDP(2001) [nominal GDP] $64
Practice Formulas Base year[$50/$50=1x100=100] $46/$50x100=92[deflation of 8%] Nominal GDP(2001) [nominal GDP] $64 GDP Price Index = Real GDP(1998) x 100; [Real GDP] $50 x 100 = 128 [GDP Deflator] [The base year is 1998] [$64/128 x 100 = $50] $6,737[1994]/126.1[1987($4,540)]x100 = $5,343 [+$803.] “Real GDP deflates nominal GDP to actual value”[takes the air out of the nominal balloon] Unemployment ,655,000 Labor Force x 100 = unemployment rate; ,863, x 100 = 4% [Employed + unemployed] [135,208,000+5,655,000] [2000] Okun’s Law or GDP gap)=Unemployment Rate over 6% x 2; 7.5%, so 1.5%x2 = 3%. Or, $3 billion GDP Gap[$100 billion nominal GDP x .03% = $3 billion]. (2000-later year) (1999-earlier year) [*Change/original x 100] Current year’s index – last year’s index (5.6) C.P.I. = Last year’s index(1999-earlier year) x 100; x100 = 3.4% _________________________ “Rule of 70” = % annual rate of increase (3%) = 23 years 70 “Real Income” measures the amount of goods/services nominal income will buy. [% change in real income = % change in nominal income - % change in PL.] 5% % %
![Nominal GDP(2001) [nominal GDP] $64](http://slideplayer.com/slide/1391267/3/images/36/Nominal+GDP%282001%29+%5Bnominal+GDP%5D+%2464.jpg "Practice Formulas. Base year[$50/$50=1x100=100] $46/$50x100=92[deflation of 8%] Nominal GDP(2001) [nominal GDP] $64. GDP Price Index = Real GDP(1998) x 100; [Real GDP] $50 x 100 = 128. [GDP Deflator] [The base year is 1998] [$64/128 x 100 = $50] $6,737[1994]/126.1[1987($4,540)]x100 = $5,343 [+$803.] Real GDP deflates nominal GDP to actual value [takes the air out of the nominal balloon] Unemployment 5,655,000. Labor Force x 100 = unemployment rate; 140,863,000 x 100 = 4% [Employed + unemployed] [135,208,000+5,655,000] [2000] Okun’s Law or GDP gap)=Unemployment Rate over 6% x 2; 7.5%, so 1.5%x2 = 3%. Or, $3 billion GDP Gap[$100 billion nominal GDP x .03% = $3 billion]. (2000-later year) (1999-earlier year) [*Change/original x 100] Current year’s index – last year’s index (5.6) C.P.I. = Last year’s index(1999-earlier year) x 100; x100 = 3.4% _________________________. Rule of 70 = % annual rate of increase (3%) = 23 years. 70. Real Income measures the amount of goods/services nominal income will buy. [% change in real income = % change in nominal income - % change in PL.] 5% 10% 5%")
37
“GDP” Balloon [Real GDP=Nominal GDP/GDP Deflator X 100]
[$6,737] Inflation component GDP Deflator [126.1] Real GDP $5,343 Real GDP [& Nominal GDP] $4,540 Base Year + $803 billion 1987 [not $2,197 trillion] 1994 Nominal GDP – measured in terms of money. [Current output measured in current prices] Real GDP – measured in terms of goods/services. [Current output measured in base-year prices] Real GDP takes the “air” out of the nominal GDP “balloon”. The effects of inflation have been eliminated, so the remaining changes are “real” changes.
![GDP Balloon [Real GDP=Nominal GDP/GDP Deflator X 100]](http://slideplayer.com/slide/1391267/3/images/37/GDP+Balloon+%5BReal+GDP%3DNominal+GDP%2FGDP+Deflator+X+100%5D.jpg "[$6,737] Inflation. component. GDP Deflator [126.1] Real GDP. $5,343. Real GDP. [& Nominal GDP] $4,540. Base Year. + $803 billion [not $2,197 trillion] Nominal GDP – measured in terms of money. [Current output measured in current prices] Real GDP – measured in terms of goods/services. [Current output measured in base-year prices] Real GDP takes the air out of the nominal GDP balloon . The effects of inflation have been eliminated, so the. remaining changes are real changes.")
38
Real GDP Nominal GDP REAL GDP= Index x 100
Ex:Using the above formula, what is the real GDP for 1994 if nominal GDP was $6,947 trillion and the GDP deflator was 126.1? $6, x =5,509 trillion 126.1

39
Real GDP = Nominal GDP/Index X 100
Practice Macroeconomic Formulas Real GDP = Nominal GDP/Index X 100 $9,299.2[1999]/104.77[1996] x 100 = $8,875.8 [So, +$1,062.6] “Real GDP deflates nominal GDP to actual value” [takes the air out of the nominal balloon] $5, $3, $5,671.8 108.5 x 100=$_____ x 100=$_____ x100=$_____ “Nominal” “Real” 4,839 3,492 4,848 NS 12 and 13 12. Using the above formula, what is the real GDP for 1994 if nominal GDP was $6,947 trillion and the GDP deflator was 126.1? ($6,611/$5,610/$5,509) trillion. 13. For 1996, what would real GDP be if nominal GDP were $7,636 trillion and the GDP deflator were 110.2? ($6,929/$9,628/$6,928). [$6,947/126.1 x 100 = $5,509 trillion [$7,636 trillion/110.2 x 100 = $6,929 trillion]
 trillion. 13. For 1996, what would real GDP be if nominal GDP were. $7,636 trillion and the GDP deflator were ($6,929/$9,628/$6,928). [$6,947/126.1 x 100 = $5,509 trillion. [$7,636 trillion/110.2 x 100 = $6,929 trillion]")
40
UNEMPLOYMENT #Unemployed Unemployment Rate= Labor Force x 100
Ex:If the total population is 280 million, and the civilian labor force includes 129,558,000 with jobs and 6,739,000 unemployed but looking for jobs what is the unemployment rate? 6,739, x =4.9% 129,558, ,739,000

41
Unemployment Rate = Unemployment/Labor force X 100
Unemployment Rate = Labor Force x 100; 9.8% = 154,082,000 x 100 [Employed + unemployed] [138,982,000+15,100,000] In Forney, 42 are unemployed & 658 are employed. The unemployment rate is __%. One mil. are unemployed & 19 mil. are employed. The unemploy. rate is __%. (Sept. of 2009) 6 5 NS 41 41. If the total population is 280 million, and the civilian labor force includes 129,558,000 with jobs and 6,739,000 unemployed but looking for jobs, then the unemployment rate would be ____%. 4.9 [6,739,000/136,297,000 x 100 = 4.9%]
 NS If the total population is 280 million, and the civilian labor force. includes 129,558,000 with jobs and 6,739,000 unemployed but. looking for jobs, then the unemployment rate would be ____% [6,739,000/136,297,000 x 100 = 4.9%]")
42
The Unemployment Rate May Drop But Be Worse
The unemployment rate in June of 2010 was 9.7%. The next month, 125,000 jobs were lost. “Did the unemployment rate go up in July, 2010?” No, because 652,000 more workers became discouraged [bringing the total to 2.6 million] and quit looking, the July unemployment rate actually improved to 9.5%. But, the economy was obviously worse off. Jan, June, 2010 The “discouraged workers” had looked in the last year but not in the last month. 9.5% Are We Out Of The “Great Recession”?

43
GDP GAP/Okun’s Law Okun’s Law= 6%- current unemployment rate x 2 = ___x GDP = ___ Ex: The Actual unemployment rate is 7.3%. The GDP is 300 Billion. What is the GDP Gap? 6% - 7.3% (1.3) 1.3x2+ 2.6% 2.6% x 300 Billion = 780 million
 1.3x2+ 2.6% 2.6% x 300 Billion = 780 million.")
44
AD/AS Primer - Recessionary Gap [Frictional+Structural]
3% FE GDP “Bull’s Eye” 1% 6% Y*F YP YA $10 tr. [Frictional+Structural] 5% Cyclical(“real”) Unempl. 10%[5%x2=10%] Negative Gap 11% YR YA $9 Tr. [Okun’s Law] Arthur Okun [GDP Gap = unemployment rate above 6% x 2] E2 Recessionary Gap(YR) Potential output ($10) exceeds actual output($9). Actual unemployment rate(11%) exceeds Potential unemp. rate(6%). Unemployment [Let’s say that Nominal GDP is $100 billion.][And if it were $300 billion?] Rate 1. 7%; real unempl. is __%; % gap is ___ %; output forgone is ___ B ___ B 2. 8%; real unempl. is __%; % gap is ___ %; output forgone is ___ B ___ B 3. 13%; real unempl. is __%; % gap is ___ %; output forgone is ___ B ___ B 4. 14%; real unempl. is __%; % gap is ___ %; output forgone is ___ B ___ B $100 B $300 B 1 2 2 6 2 4 4 12 7 14 14 42 8 16 16 48
![AD/AS Primer - Recessionary Gap [Frictional+Structural]](http://slideplayer.com/slide/1391267/3/images/44/AD%2FAS+Primer+-+Recessionary+Gap+%5BFrictional%2BStructural%5D.jpg "3% FE GDP Bull’s Eye 1% 6% Y*F. YP. YA. $10 tr. [Frictional+Structural] 5% Cyclical( real ) Unempl. 10%[5%x2=10%] Negative Gap. 11% YR. YA. $9 Tr. [Okun’s Law] Arthur Okun. [GDP Gap = unemployment rate above 6% x 2] E2 Recessionary Gap(YR) Potential output ($10) exceeds actual output($9). Actual unemployment rate(11%) exceeds Potential unemp. rate(6%). Unemployment [Let’s say that Nominal GDP is $100 billion.][And if it were $300 billion ] Rate. 1. 7%; real unempl. is __%; % gap is ___ %; output forgone is ___ B ___ B. 2. 8%; real unempl. is __%; % gap is ___ %; output forgone is ___ B ___ B %; real unempl. is __%; % gap is ___ %; output forgone is ___ B ___ B %; real unempl. is __%; % gap is ___ %; output forgone is ___ B ___ B. $100 B. $300 B")
45
Unemployment Rate over 6% x 2
Okun’s Law GDP Gap = Unemployment Rate over 6% x 2 7.5% unemployment, so 1.5% x 2 = 3%. [$3 bil. GDP Gap($100 Bil. nominal GDPx3%; or $100 B x .03 =$3 B.) on Practice Formulas 1. Unemployment is 7%; Nominal GDP is $200 billion. Real unemp. is __%. The % gap is __%. Y being forgone is $__ B. 2. Unemployment is 8%; Nominal GDP is $500 billion. 3. Unemployment is 10%; Nominal GDP is $100 billion. Unemployment Rate over 6% x 2 GDP Gap (Okun’s Law) 1 2 4 2 4 20 4 8 8 NS 43 & 44 43.Unemployment is 17%. Nominal GDP is $200 billion. What % is the GDP gap? __% What output is forgone? $___ 44. Unemployment is 16%. Nominal GDP is $300 billion. 22 44 20 60
 on Practice Formulas. 1. Unemployment is 7%; Nominal GDP is $200 billion. Real unemp. is __%. The % gap is __%. Y being forgone is $__ B. 2. Unemployment is 8%; Nominal GDP is $500 billion. 3. Unemployment is 10%; Nominal GDP is $100 billion. Unemployment Rate over 6% x 2. GDP Gap (Okun’s Law) NS 43 & Unemployment is 17%. Nominal GDP is $200 billion. What % is the GDP gap __% What output is forgone $___. 44. Unemployment is 16%. Nominal GDP is $300 billion")
46
Why It Doesn’t Feel Like A Recovery [2% Growth]
Although output is rising [2%], there is still a $900 billion output gap, so how long will it take to eliminate the output gap & put 7 million back to work. It all depends on the pace of the growth. Here’s what would happen to the unemployment rate [8.9 now] under three growth scenarios: At 3% the unemployment rate would reach 5% in 2020. At 6% growth, the unemployment rate would reach its potential, 5% unemployment in 2012. Sometimes the economy is turbocharged and we are cranking out more than can be sustained. POTENTIAL Y $14.1 Trillion At 2%, the unemployment rate would rise, reaching 11.9% in 2020. Usually potential & actual output track pretty closely. Actual Y $13.2 Trillion Even when the economy is functioning at its potential, about 5% of the labor force is unemployed. During a recession, actual Y falls below potential Y. PROJECTED
![Why It Doesn’t Feel Like A Recovery [2% Growth]](http://slideplayer.com/slide/1391267/3/images/46/Why+It+Doesn%E2%80%99t+Feel+Like+A+Recovery+%5B2%25+Growth%5D.jpg "Although output is rising [2%], there is still a $900 billion output gap, so how long will it take to eliminate the output gap & put 7 million back to work. It all depends on the pace of the growth. Here’s what would happen to the unemployment. rate [8.9 now] under three growth scenarios: At 3% the unemployment. rate would reach 5% in At 6% growth, the unemployment rate would reach its potential, 5% unemployment in Sometimes the economy is turbocharged and we are cranking out more than can be sustained. POTENTIAL Y. $14.1 Trillion. At 2%, the unemployment. rate would rise, reaching. 11.9% in Usually potential & actual. output track pretty closely. Actual Y. $13.2 Trillion. Even when the economy is functioning at its potential, about 5% of the labor force is unemployed. During a recession, actual Y falls below potential Y. PROJECTED.")
47
CPI / INFLATION Current year’s index – last year’s index
C.P.I. = Last year’s index x 100 Ex:The CPI was in 1999 and in Therefore, the rate of inflation for 2000 was? x =4.9% 166.6

48
[Change/Original X 100 = inflation]
Figuring Inflation (2006-later year) (2005-earlier year) Current year’s index – last year’s index – [6.7] C.P.I. = Last year’s index(2006-earlier year) x 100; x 100 = 3.3% (6.7) (-4) (33) x 100 = ____ x 100 = ____ x 100 = ____ So, 3.3% increase in Social Security benefits for 2007 5.4% -3.3% 11% NS 50, 51, & 52 50.The CPI was in 1999 and in 2000. Therefore, the rate of inflation for 2000 was (2.7/3.4/4.2)% 51. If the CPI falls from 160 to 149 in a particular year, the economy has experienced (inflation/deflation) of (5/4.9/6.9)%. 52. If CPI rises from to in a particular year, the rate of inflation for that year is (1.6/2.0/4.0)%. [5.6/166.6 x 100 = 3.4%] [-11/160 x 100 = -6.9%]
![[Change/Original X 100 = inflation]](http://slideplayer.com/slide/1391267/3/images/48/%5BChange%2FOriginal+X+100+%3D+inflation%5D.jpg "Figuring Inflation. (2006-later year) (2005-earlier year) Current year’s index – last year’s index – [6.7] C.P.I. = Last year’s index(2006-earlier year) x 100; x 100 = 3.3% (6.7) (-4) (33) x 100 = ____ 120 x 100 = ____ 300 x 100 = ____. So, 3.3% increase in Social. Security benefits for % -3.3% 11% NS 50, 51, & The CPI was in 1999 and in Therefore, the rate of inflation for 2000 was. (2.7/3.4/4.2)% 51. If the CPI falls from 160 to 149 in a particular. year, the economy has experienced (inflation/deflation) of (5/4.9/6.9)%. 52. If CPI rises from to in a particular year, the rate of inflation for that year is (1.6/2.0/4.0)%. [5.6/166.6 x 100 = 3.4%] [-11/160 x 100 = -6.9%]")
49
Figuring CPI For An Individual
A consumer in this economy buys only 2 goods–hot dogs & hamburgers. Step 1. Fix the market basket. What percent of income is spent on each. The consumer in this economy buys a basket of: 4 hot dogs and hamburgers Step 2. Find the prices of each good in each year. Year Price of Hot Dogs Price of Hamburgers $1 $2 $ $3 Step 3. Compute the basket cost for each year. ($1 per hot dog x 4 = $4) + ($2 per hamburger x 2 = $4), so $8 ($2 per hot dog x 4 = $8) + ($3 per hamburger x 2 = $6), so $14 Step 4. Choose one year as a base year (2009) and compute the CPI ($8/$8) x 100 = 100 (14/$8) x 100 = 175 Step 5. Use the CPI to compute the inflation rate from previous year (175/100 x 100 = 175%) or to get actual % ( )/100 x 100 =75% Or, Change $14-$8 ($6) Original $ x 100 = 75%
 + ($2 per hamburger x 2 = $4), so $ ($2 per hot dog x 4 = $8) + ($3 per hamburger x 2 = $6), so $14. Step 4. Choose one year as a base year (2009) and compute the CPI ($8/$8) x 100 = (14/$8) x 100 = 175. Step 5. Use the CPI to compute the inflation rate from previous year (175/100 x 100 = 175%) or to get actual % ( )/100 x 100 =75% Or, Change $14-$8 ($6) Original $8 x 100 = 75%")
50
Figuring CPI For An Individual [MC (42%)]
(42%) 18. Suppose that a consumer buys the following quantities of these three commodities in 2007 and 2008. Commodity Quantity 2007 per Unit Price 2008 per Unit Price Food 5 units $ $5.00 Clothing 2 units $ $9.00 Shelter 3 units $ $19.00 Which of the following can be concluded about the CPI for this individual from 2007 to 2008 [inflation]? a. It remained unchanged. c. it decreased by 20% b. It decreased by 25%. d. It increased by 20% e. It increased by 25%. (Answer) Year 1 [2007]: [5 food x $6 = $30; 2 clothing x $7 = $14; 3 shelters x $12 = $36, for dollar value [or basket cost] of $80. CPI = 100 ($80/$80 x 100 = 100 for 2007) Year 2 [2008]: [5 food x $5 = $25; 2 clothing x $9 = $18; 3 shelters x $19 = $57, for dollar value [basket cost ]of $100. CPI =125 ($100/$80 X 100 = 125) or (125/100 x 100 = 125 for 2008) Change $100-$80 [$20] Original = $ x 100 = 25%; so the CPI for this individual is 25%.
![Figuring CPI For An Individual [MC (42%)]](http://slideplayer.com/slide/1391267/3/images/50/Figuring+CPI+For+An+Individual+%5BMC+%2842%25%29%5D.jpg "(42%) 18. Suppose that a consumer buys the following quantities of. these three commodities in 2007 and Commodity Quantity 2007 per Unit Price 2008 per Unit Price. Food 5 units $6.00 $5.00. Clothing 2 units $7.00 $9.00. Shelter 3 units $12.00 $ Which of the following can be concluded about the CPI for this individual. from 2007 to 2008 [inflation] a. It remained unchanged. c. it decreased by 20% b. It decreased by 25%. d. It increased by 20% e. It increased by 25%. (Answer) Year 1 [2007]: [5 food x $6 = $30; 2 clothing x $7 = $14; 3 shelters x $12 = $36, for dollar value [or basket cost] of $80. CPI = 100 ($80/$80 x 100 = 100 for 2007) Year 2 [2008]: [5 food x $5 = $25; 2 clothing x $9 = $18; 3 shelters x $19 = $57, for dollar value [basket cost ]of $100. CPI =125 ($100/$80 X 100 = 125) or (125/100 x 100 = 125 for 2008) Change $100-$80 [$20] Original = $80 x 100 = 25%; so the CPI for this individual is 25%.")
51
CPI, 1913-2010 Year CPI Inflat. Year CPI Inflat. Year CPI Inflat.
Year CPI Inflat. Year CPI Inflat. Year CPI Inflat. ftp://ftp.bls.gov/pub/ special.requests/cpi/ cpiai.txt

52
Rule of 70 _______70___________
“Rule of 70” = % annual rate of increase Ex: The GDP is growing at 1.6%. At this rate the standard of living will double in __ years? = 44 years (43.75 years) 1.6% Ex: Inflation is growing at 5%. At this rate prices will double in __ years? = 14 years 5% Ex: Interest rates are currently at 3%. At this rate investments will double in __ years? = 23 years ( years) 3% [
 1.6% Ex: Inflation is growing at 5%. At this rate prices will double in __. years 70 = 14 years. 5% Ex: Interest rates are currently at 3%. At this rate investments will double in __ years 70 = 23 years ( years) 3% [")
53
“Rule of 70” 70 70 __________________________
“Rule of 70” = % annual rate of increase (3%) = 23 years [Inflation (prices to double)] [Investments to double] 10 = ________12 = _____ = _______ [GDP (standard of living) to double] 70 7 years 6 years 8 years 70
 = 23 years. [Inflation (prices to double)] [Investments to double] 10 = ________12 = _____ 9 = _______ [GDP (standard of living) to double] years. 6 years. 8 years. 70.")
54
Real Income Value nominal income –inflation rate= real income
Ex: The inflation rate rose by 3%, but the income level rose by 5%, what happened to the real income? 5%-3%=2%

55
[Nominal income – inflation rate = Real Income]
16% 10% - 6% = Nominal Income Inflation Premium Real Income
![[Nominal income – inflation rate = Real Income]](http://slideplayer.com/slide/1391267/3/images/55/%5BNominal+income+%E2%80%93+inflation+rate+%3D+Real+Income%5D.jpg "16% 10% - 6% = Nominal. Income. Inflation. Premium. Real. Income.")
56
Real Income “You will get a 10% raise”
“Real Income” measures the amount of goods/services nominal income will buy. [% change in real income = % change in nominal income - % change in PL.] 5% % % Nominal income rose by 10%, PL increased by 4% - then real income rose by ___%. Nominal income rose by 20%, PL increased by 5% - then real income rose by ___%. 6 15 “You will get a 10% raise”

57
[Figuring GDP, Inflation, & Real GDP]
2008 FRQ [form B] [Figuring GDP, Inflation, & Real GDP]
![[Figuring GDP, Inflation, & Real GDP]](http://slideplayer.com/slide/1391267/3/images/57/%5BFiguring+GDP%2C+Inflation%2C+%26+Real+GDP%5D.jpg "2008 FRQ [form B] [Figuring GDP, Inflation, & Real GDP]")
58
Outputs & Prices in Gala Land
3. Gala Land produces 3 final goods: bread, water, and fruit. The table [right] shows this year’s output and price for each good. (a) Calculate this year’s nominal GDP. (b) Assume that in Gala Land the GDP deflator [GDP price index) is 100 in the base year and 150 this year. Calculate the following. (i) The inflation rate, expressed as a percent, between the base year & this year. (ii) This year’s real GDP (c) Since the base year, workers have received a 20% increase in their nominal wages. If workers face the same inflation that you calculated in part (b)(i), what has happened to their real wages? Explain. (d) If the GDP deflator [inflation] in Gala Land increases unexpectedly, would a borrower with a fixed-interest-rate loan be better off or worse off? Explain. 2008 FRQ [form B] Outputs & Prices in Gala Land This Year’s Output This Year’s Price 400 loaves of bread $6 per loaf 1,000 gallons of water $2 per gallon 800 pieces of fruit $2 per piece Answer to 3. (a): 400x$6=$2,400; 1,000x$2=$2,000; and 800x$2 = $1,600 for a Nominal GDP of $6,000. Answer to 3. (b) (i): Change/Original x 100; therefore 50/100 x 100 = 50% inflation rate. Answer to 3. (b) (ii): Nominal GDP/GDP deflator x 100 = Real GDP; $6,000/150 X 100 = Real GDP of $4,000. Answer to 3. (c): Inflation between these years has increased 50%; wages have increased only 20%; therefore workers real wages or real purchasing power has decreased. Answer to 3. (d): The borrower has borrowed “dear” money but is paying back “cheaper” money. He is better off because he is paying back money that isn’t worth what it was when he took out the loan.
 Calculate this year’s nominal GDP. (b) Assume that in Gala Land the GDP deflator [GDP price index) is 100 in the base year and 150 this year. Calculate the following. (i) The inflation rate, expressed as a percent, between the base year & this year. (ii) This year’s real GDP. (c) Since the base year, workers have received a 20% increase in their nominal wages. If workers face the same inflation that you calculated in part (b)(i), what has. happened to their real wages Explain. (d) If the GDP deflator [inflation] in Gala Land increases unexpectedly, would a borrower with a fixed-interest-rate loan be better off or worse off Explain FRQ [form B] Outputs & Prices in Gala Land. This Year’s Output This Year’s Price. 400 loaves of bread $6 per loaf. 1,000 gallons of water $2 per gallon. 800 pieces of fruit $2 per piece. Answer to 3. (a): 400x$6=$2,400; 1,000x$2=$2,000; and 800x$2 = $1,600 for a Nominal GDP of $6,000. Answer to 3. (b) (i): Change/Original x 100; therefore 50/100 x 100 = 50% inflation rate. Answer to 3. (b) (ii): Nominal GDP/GDP deflator x 100 = Real GDP; $6,000/150 X 100 = Real GDP of $4,000. Answer to 3. (c): Inflation between these years has increased 50%; wages have increased. only 20%; therefore workers real wages or real purchasing power has decreased. Answer to 3. (d): The borrower has borrowed dear money but is paying back cheaper money. He is better off because he is paying back money that isn’t worth what it was when he took out the loan.")
59
Outputs & Prices in Gala Land
3. Gala Land produces 3 final goods: bread, water, and fruit. The table [right] shows this year’s output and price for each good. (a) Calculate this year’s nominal GDP. (b) Assume that in Gala Land the GDP deflator [GDP price index) is 100 in the base year and 150 this year. Calculate the following. (i) The inflation rate, expressed as a percent, between the base year & this year. (ii) This year’s real GDP (c) Since the base year, workers have received a 20% increase in their nominal wages. If workers face the same inflation that you calculated in part (b)(i), what has happened to their real wages? Explain. (d) If the GDP deflator [inflation] in Gala Land increases unexpectedly, would a borrower with a fixed-interest-rate loan be better off or worse off? Explain. 2008 FRQ [form B] Outputs & Prices in Gala Land This Year’s Output This Year’s Price 400 loaves of bread $6 per loaf 1,000 gallons of water $2 per gallon 800 pieces of fruit $2 per piece
 Calculate this year’s nominal GDP. (b) Assume that in Gala Land the GDP deflator [GDP price index) is 100 in the base year and 150 this year. Calculate the following. (i) The inflation rate, expressed as a percent, between the base year & this year. (ii) This year’s real GDP. (c) Since the base year, workers have received a 20% increase in their nominal wages. If workers face the same inflation that you calculated in part (b)(i), what has. happened to their real wages Explain. (d) If the GDP deflator [inflation] in Gala Land increases unexpectedly, would a borrower with a fixed-interest-rate loan be better off or worse off Explain FRQ [form B] Outputs & Prices in Gala Land. This Year’s Output This Year’s Price. 400 loaves of bread $6 per loaf. 1,000 gallons of water $2 per gallon. 800 pieces of fruit $2 per piece.")
60
NS 15-21 15. The business cycle is defined as the _______ and _______ in business activity. A. EXPANSION B. PEAK C. CONTRACTION D. TROUGH ___ 16. High point of expansion ___ 17. Period of growth (GDP increases) ___ 18. “Bottoming out” of business activity ___ 19. Laid off workers are called back. ___ 20. Near or at full employment (4-6%) ___ 21. Have averaged 11 months since W.W.II. upturns downturns B A D A B C
 ___ 18. Bottoming out of business activity. ___ 19. Laid off workers are called back. ___ 20. Near or at full employment (4-6%) ___ 21. Have averaged 11 months since W.W.II. upturns. downturns. B. A. D. A. B. C.")
61
NS 22-30 4-6 7.3 22. During a recession, jobs relating to
(durable/nondurable) goods are affected the most because they are postponable and have monopoly power (few sellers). 23. (Leading/Coincident/Lagging) indicators – statistics that illustrate the direction the economy is heading in 6-9 months. 24. (Leading/Coincident/Lagging) indicators – snapshot of the economy “at this time.” 25. (Leading/Coincident/Lagging) indicators – statistics that tell where the economy has been. 26. Full employment occurs when we have ______% unemployment. The current unemployment rate is ____%. 27. (Discouraged workers/Temporary unemployed workers) are those who have given up looking for a job. 28. The presence of discouraged workers & counting part-time workers as fully employed results in the official rate being (understated/overstated). 29. If 2 million out of 8 million unemployed workers become “discouraged” & quit looking for work, the official rate would (incr/decr/be unchanged). 30. If 3 million part time workers switch to full time work, the official rate will (fall/rise/remain unchanged). NS 22-30 4-6 7.3
 goods are affected the most because they are postponable and have monopoly power (few sellers). 23. (Leading/Coincident/Lagging) indicators – statistics that illustrate the direction the economy is heading in 6-9 months. 24. (Leading/Coincident/Lagging) indicators – snapshot of the economy at this time. 25. (Leading/Coincident/Lagging) indicators – statistics that tell where the economy has been. 26. Full employment occurs when we have ______% unemployment. The current unemployment rate is ____%. 27. (Discouraged workers/Temporary unemployed workers) are those who have given up looking for a job. 28. The presence of discouraged workers & counting part-time workers as fully employed results in the official rate being (understated/overstated). 29. If 2 million out of 8 million unemployed workers become discouraged & quit looking for work, the official rate would (incr/decr/be unchanged). 30. If 3 million part time workers switch to full time work, the official rate will (fall/rise/remain unchanged). NS")
62
NS 31-49 31. (Frictional/Structural/Cyclical) is “temporary”, “short-term” unemployment. 32. (Frictional/Structural/Cyclical) is technological, “long-term” unemployment. 33. (Frictional/Structural/Cyclical) is unemployment resulting from recessions. A. FRICTIONAL B. STRUCTURAL C. CYCLICAL ___ 34. Michael lost his job due to the recession [business cycle downturn]. ___ 35. College graduate is searching for his first job. ___ 36. Amanda is quitting Wendy’s to work at McDonald’s. ___ 37. There are job losses at Ford due to a decrease in AD. ___ 38. Lifeguards in the winter and Santa’s during the spring. ___ 39. The auto replaces carriage makers. ___ 40. ATM machines replace bank tellers. 45. The cost of unemployment can be measured by the amount by which (potential/actual) GDP exceeds (potential/actual) GDP. 46. If the unemployment rate is 8%, we can infer that the (potential/actual) GDP is in excess of (potential/actual) GDP. 47. (Inflation/Disinflation/Deflation) is a general increase in prices. 48. (Inflation/Disinflation/Deflation) is a decline in prices. 49. (Inflation/Disinflation/Deflation) is a decrease in the rate of inflation. C A A C A B B
 is technological, long-term unemployment. 33. (Frictional/Structural/Cyclical) is unemployment resulting from recessions. A. FRICTIONAL B. STRUCTURAL C. CYCLICAL. ___ 34. Michael lost his job due to the recession [business cycle downturn]. ___ 35. College graduate is searching for his first job. ___ 36. Amanda is quitting Wendy’s to work at McDonald’s. ___ 37. There are job losses at Ford due to a decrease in AD. ___ 38. Lifeguards in the winter and Santa’s during the spring. ___ 39. The auto replaces carriage makers. ___ 40. ATM machines replace bank tellers. 45. The cost of unemployment can be measured by the amount by which. (potential/actual) GDP exceeds (potential/actual) GDP. 46. If the unemployment rate is 8%, we can infer that the (potential/actual) GDP. is in excess of (potential/actual) GDP. 47. (Inflation/Disinflation/Deflation) is a general increase in prices. 48. (Inflation/Disinflation/Deflation) is a decline in prices. 49. (Inflation/Disinflation/Deflation) is a decrease in the rate of inflation. C. A. A. C. A. B. B.")
63
Invented in 1970’s- post-dated back to the 50’s…
54. (Demand-pull/Cost-push) inflation results from an increase in aggregate demand [AD]. 55. (Demand-pull/Cost-push) inflation results from an increase in production costs [wages or input cost]. 56. The only group that benefits from inflation are (creditors/debtors/fixed income pensioners). 59. The misery index is equal to the _______________________ plus the ________________ 60. The current misery index is ______. [changes every month] unemployment rate [7.3%] inflation rate [1.5%] (These 2 figures chg each month) 8.8% This changes every month. Highest ever- June % Lowest ever July % Invented in 1970’s- post-dated back to the 50’s…
 inflation results from an increase in. aggregate demand [AD]. 55. (Demand-pull/Cost-push) inflation results from an increase in. production costs [wages or input cost]. 56. The only group that benefits from inflation are. (creditors/debtors/fixed income pensioners). 59. The misery index is equal to the _______________________. plus the ________________. 60. The current misery index is ______. [changes every month] unemployment rate [7.3%] inflation rate [1.5%] (These 2 figures chg each month) 8.8% This changes every month. Highest ever- June % Lowest ever July % Invented in 1970’s- post-dated back to the 50’s…")
64
INFLATION

65
49. Disinflation – decrease in inflation(1980-83)
Inflation Since 1954 Above about % inflation is considered too much. [3.9% in 2008; -0.4% in 2009; and 1.6% in 2010] Up in % Legal Svc Col. Tuition 5.8 Tech. Svc Hospitals Col. Fees Comp. Train5.3 Med. Serv Take some money out of circulation to make it more valuable. Down in 2007 % Gasoline TVs Homes Toys Girls clothing 3.6 New cars Boys clothing 1.1 Furniture 47. Inflation – overall increase in prices 48. Deflation – decrease in prices (1955) 49. Disinflation – decrease in inflation( )
 49. Disinflation – decrease in inflation( )")
66
Demand-Pull Inflation
[“Good News” – more jobs; “Bad News” – higher prices] AD2 AS AD1 PL2 E2 “Bad News” -higher prices E1 PL1 “Good News” - more jobs Y* YI

67
Disinflationary Recessions
[“Good News”–lower prices; “Bad News”–job losses] AS AD1 AD2 PL1 PL2 “Good news” -lower prices “Bad news” - job losses YR Y*

68
Adverse Supply Shocks [“bad news” – job losses; “bad news” – inflation]
AS2 AD AS1 PL2[10%] This economy is stagnating but inflating. Inflating PL1 Stagflation $2.25 Stagnating This created cognitive dissonance among many. YR 10% Y*
![Adverse Supply Shocks [ bad news – job losses; bad news – inflation]](http://slideplayer.com/slide/1391267/3/images/68/Adverse+Supply+Shocks+%5B+bad+news+%E2%80%93+job+losses%3B+bad+news+%E2%80%93+inflation%5D.jpg "AS2. AD. AS1. PL2[10%] This economy is. stagnating. but. inflating. Inflating. PL1. Stagflation. $2.25. Stagnating. This created cognitive. dissonance among many. YR. 10% Y*")
69
Traditional Fiscal Policy [“G” & “T”] will not work with Stagflation
AS2 AD1 AD2 15% 10% 4% AD3 15% 10% Y* Stagflation
![Traditional Fiscal Policy [ G & T ] will not work with Stagflation](http://slideplayer.com/slide/1391267/3/images/69/Traditional+Fiscal+Policy+%5B+G+%26+T+%5D+will+not+work+with+Stagflation.jpg "AS2. AD1. AD2. 15% 10% 4% AD3. 15% 10% Y* Stagflation.")
70
[“good news”–job gains; “good news”–disinflation]
Beneficial Supply Shocks [“good news”–job gains; “good news”–disinflation] AD AS1 AS2 $1.50 PL1 PL2 Y2 Y*
![[ good news –job gains; good news –disinflation]](http://slideplayer.com/slide/1391267/3/images/70/%5B+good+news+%E2%80%93job+gains%3B+good+news+%E2%80%93disinflation%5D.jpg "Beneficial Supply Shocks. [ good news –job gains; good news –disinflation] AD. AS1. AS2. $1.50. PL1. PL2. Y2. Y*")
71
Three Measures of Inflation
1. PPI – (Production Price Index) wholesale prices [what retailers are buying] 2. CPI – (Consumer Price Index) retail prices [what consumers are buying] 3. GDP Deflator – production prices [what consumers, businesses, government, and foreigners are buying that we produced.]
 wholesale prices [what retailers are buying] 2. CPI – (Consumer Price Index) retail prices [what consumers are buying] 3. GDP Deflator – production prices [what consumers, businesses, government, and foreigners are buying that we produced.]")
72
Consumer Price Index (CPI)
Core Food & energy make up 23% of the CPI. Core inflation makes sense only for people who “don’t eat or drive.” [CPI measures cost of living relative to a base year[100] The CPI is a market basket of 364 items at 23,000 establishments in cities that the typical householder buys. It does not include exports because we do not buy exports but does include imports. About 55% of the CPI is services.

73
The “Market Basket” Clothing 6.6% Alcohol Household Health 4.5% 10.0%
4.3% Recreation 10.4% Shelter 27.9% Food 18.0% Transportation 18.3% 5 5

74
CPI Shortcomings Substitutes not counted
Quality not considered (airbags) No discount stores (“outlet bias”) New items not counted If orange goes from $1.00 to $2.00 & Tomato juice goes from $1 to .80 CPI Shortcomings a. 1st VCR, the Phillips 1500, the world’s 1st VCR for home use sold for $1,295 but $50 today. They fell in price 70% before entering the CPI. b. First solar powered calculators appeared in 1972 for $120 but didn’t make the CPI until 1978. c. In 2000, a 20-inch LCD TV cost $5,000, today under $300. d. Cell phones[The “Brick”]were introduced in 1984 at $3,995. e. The camcorder cost $1,500 in 1987, now under $150. f. 50 inch Flat Screen TV in 1999 cost $12,000, now $650. 1969 Sharp QT-8D Calculator for $475 [4 functions] [First battery-powered electronic calculator]
 No discount stores ( outlet bias ) New items not counted. If orange goes. from $1.00 to. $2.00. & Tomato juice. goes from $1. to .80. CPI Shortcomings. a. 1st VCR, the Phillips 1500, the world’s. 1st VCR for home use sold for $1,295. but $50 today. They fell in price 70% before entering the CPI. b. First solar powered calculators appeared in 1972 for. $120 but didn’t make the CPI until c. In 2000, a 20-inch LCD TV cost $5,000, today under $300. d. Cell phones[The Brick ]were introduced in 1984 at $3,995. e. The camcorder cost $1,500 in 1987, now under $150. f. 50 inch Flat Screen TV in 1999 cost $12,000, now $ Sharp QT-8D Calculator for $475 [4 functions] [First battery-powered electronic calculator]")
75
Computer Quality Over Time
*These could execute 330,000 computations per sec(2 billion now). These had 5 MB disk drives. Today Dell makes computers with 500GB, 70,000 times larger. Stores were selling them for $3,300 after buying them for $2,000. 1981 IBM PC 4.77MHz 160 KB floppy drives $3,300 1991 Compaq 486 33 MHz 120 MB hard drive $2,300 2011 Dell Optiplex 160 2 GB 320 GB hard drive $700 M. Dell – 2nd richest TX He bought parts from BYTE Magazine for $600 and sold them for $1,500-$2,000.
. These had 5 MB disk drives. Today. Dell makes computers with 500GB, 70,000 times larger. Stores were. selling them for $3,300 after buying. them for $2, IBM PC. 4.77MHz. 160 KB floppy drives. $3, Compaq MHz. 120 MB hard drive. $2, Dell Optiplex GB. 320 GB hard drive. $700. M. Dell – 2nd richest TX. He bought parts from. BYTE Magazine for. $600 and sold them. for $1,500-$2,000.")
76
Dollar Figures From Different Times
Babe Ruth made $80,000 in That would be equivalent to $1.1 mil. today. [Barry Bonds got $18 million for his last year] President Herbert Hoover’s salary in 1931 was $75,000. That would be equivalent to $1,075,657 today. Pres. Obama is being paid $400,000 a year. President Kennedy was paid $100,000 in 62 [$730,000 today] $80,000=$1.1 M Who is the Richest American Ever? John D. Rockefeller’s [ ] wealth would be worth $200 billion in today’s money, or 2 1/2 times that of Bill Gates ($72 Billion). Although Rockefeller was worth $200 billion, he could not watch TV, play video games, surf the internet, or send to his grandkids. For most of his life, he could not use AC, travel by car or plane, use a telephone to call friends, or take advantage of antibiotics to prolong & enhance life. Perhaps the average American today is richer than the richest American a century ago.
. Although Rockefeller was worth $200 billion, he could not. watch TV, play video games, surf the internet, or send . to his grandkids. For most of his life, he could not use AC, travel by car or plane, use a telephone to call friends, or take. advantage of antibiotics to prolong & enhance life. Perhaps the average American today is richer. than the richest American a century ago.")
77
Presidential Pay and CPI
Presidential pay history Date established Salary Salary in 2011 Dollars September 24, 1789 $25,000 $631,000 (1789) March 3, 1873 $50,000 $860,000 (1873) March 4, 1909 $75,000 $1,837,078 (1909) January 19, 1949 $100,000 $915,966 (1949) January 20, 1969 $200,000 $1,188,010 (1969) January 20, 2001 $400,000 $492,000 (2011) *CPI was for 2010 CPI 8.9 23.8 36.7 177.1 Obama would have to make $492,000 to buy what Bush could buy for $400,000 in 2001. [$400,000 x 218.0/177.1 = $492,000]
 March 3, $50,000. $860,000 (1873) March 4, $75,000. $1,837,078 (1909) January 19, $100,000. $915,966 (1949) January 20, $200,000. $1,188,010 (1969) January 20, $400,000. $492,000 (2011) *CPI was for CPI Obama would have to make $492,000 to buy what Bush could buy for $400,000 in [$400,000 x 218.0/177.1 = $492,000]")
78
1962 Prices v Prices [National Debt - $286 billion] [National Debt - $$316,722,162 so each citizen's share of this debt is $52, ] Tuition at Harvard - $900 Starting salary - $6, [college graduate] FICA of of $4, [$150 maximum] Top marginal tax rate of 91% of incomes over $200,000. New house for $10-15, [2.5 times the income of a new college graduate] Coke - .5 cents Movies - .50 Gas, a gallon - $.29 1962 Chevy Impala- $1,500 Tuition at Harvard - $38,891 Median Starting salary - $45, [college graduate] FICA of 6.2 of $113, [$7,049 maximum] Top marginal tax rate of 35% of incomes over $388,350 New median house price is $242,000 [5.5 times the income of today’s college grads] Coke - $1 Movies - $10 Gas, a gallon - $3.50 2011 Chevy Impala- $25,860 2013 Corvette Grand $59,600 62 Corvette $2,995
![1962 Prices v Prices [National Debt - $286 billion] [National Debt - $$316,722,162 so each citizen s share of this debt is $52, ]](http://slideplayer.com/slide/1391267/3/images/78/1962+Prices+v+Prices+%5BNational+Debt+-+%24286+billion%5D+%5BNational+Debt+-+%24%24316%2C722%2C162+so+each+citizen+s+share+of+this+debt+is+%2452%2C+%5D.jpg "Tuition at Harvard - $900. Starting salary - $6,000 [college graduate] FICA of of $4,800 [$150 maximum] Top marginal tax rate of 91% of incomes over $200,000. New house for $10-15,000 [2.5 times the income of a new college graduate] Coke - .5 cents. Movies Gas, a gallon - $ Chevy Impala- $1,500. Tuition at Harvard - $38,891. Median Starting salary - $45,400 [college graduate] FICA of 6.2 of $113,700 [$7,049 maximum] Top marginal tax rate of 35% of incomes over $388,350. New median house price is $242,000 [5.5 times the income of today’s college grads] Coke - $1. Movies - $10. Gas, a gallon - $ Chevy Impala- $25, Corvette Grand $59, Corvette $2,")
79
Demand-Pull & Cost-Push Inflation
Demand-Pull Inflation – increase in AD. [“Too many dollars chasing too few goods”] Originates from “buyers side of the market”. D1 D2 S P2 P1 “Demand-pull” D S2 S1 PL2 PL1 Cost-Push Inflation – 3 things may cause “cost-push” inflation. 1. Wage-push – strong labor unions 2. Profit-push – companies increase prices when their costs increase. 3. Supply-side cost shocks – unanticipated increase in raw materials such as oil. “Cost-push” “Wage-price” Spiral

80
Stagflation Periods [1974-75 and 1981-82]
Although the economy was stagnating, it was inflating, instead of disinflating.
![Stagflation Periods [ and ]](http://slideplayer.com/slide/1391267/3/images/80/Stagflation+Periods+%5B+and+%5D.jpg "Although the economy was stagnating, it was inflating, instead of disinflating.")
81
Who is Hurt by Inflation?
Fixed-Income Receivers Savers Creditors Who is Unaffected by Inflation? Flexible-Income Receivers Cost-of-Living Adjustments (COLAs) Debtors Government (as a big debtor) benefits big time
 Debtors. Government (as a big debtor) benefits big time.")
Similar presentations


 Geometry (29%)>")


 GDP vs GPI discussion The Other Major Macroeconomic Variables (Unemployment and.>")

![MACROECONOMICS Economics 2008 [Form B FRQ].](/5/1600521/big_thumb.jpg "MACROECONOMICS Economics 2008 [Form B FRQ].>")
