Download presentation
Presentation is loading. Please wait.

1
Goal: Identify and graph functions.

2
Relation: mapping or pairing, of input values with output values. Domain: Set of input values. Range: set of output values. Function: a relation is a function if each input value has exactly one output.

3
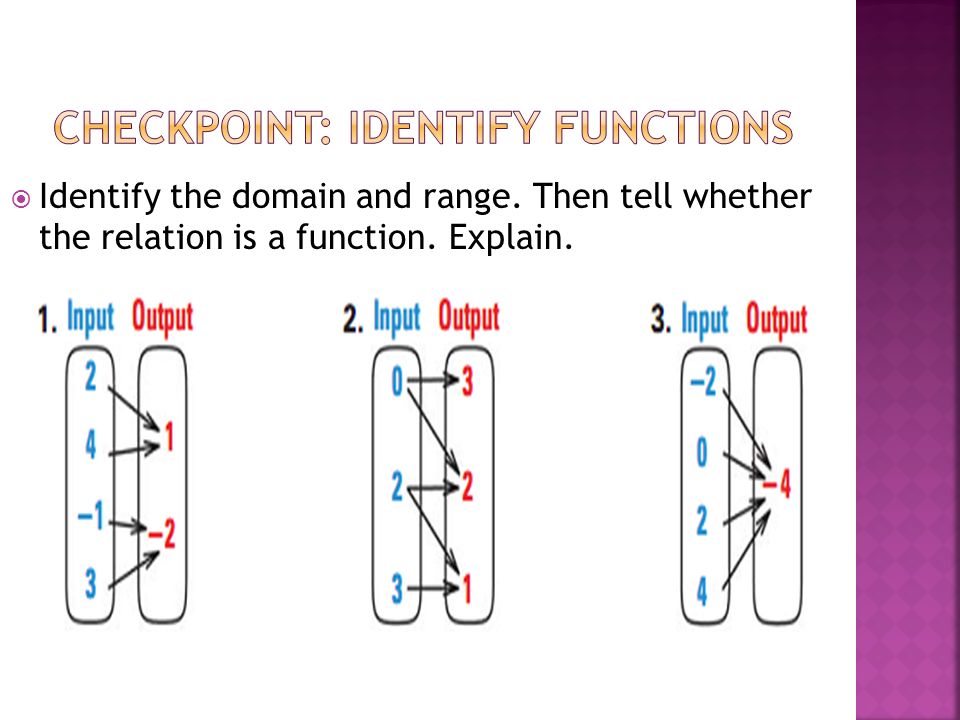
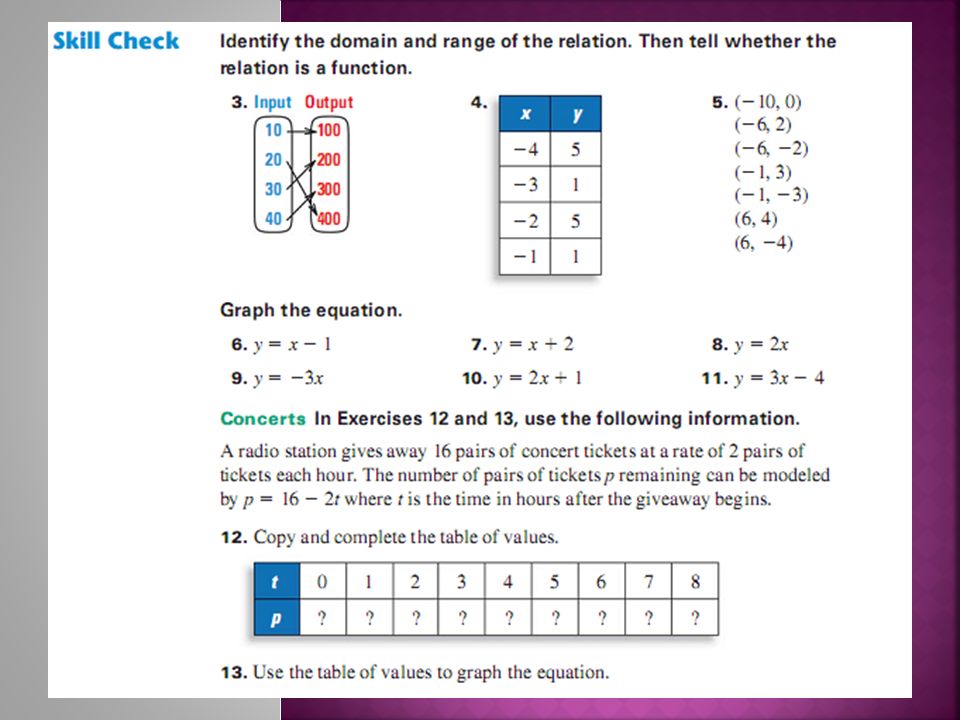
Identify the domain and range. Then tell whether the relation is a function. Explain.

6
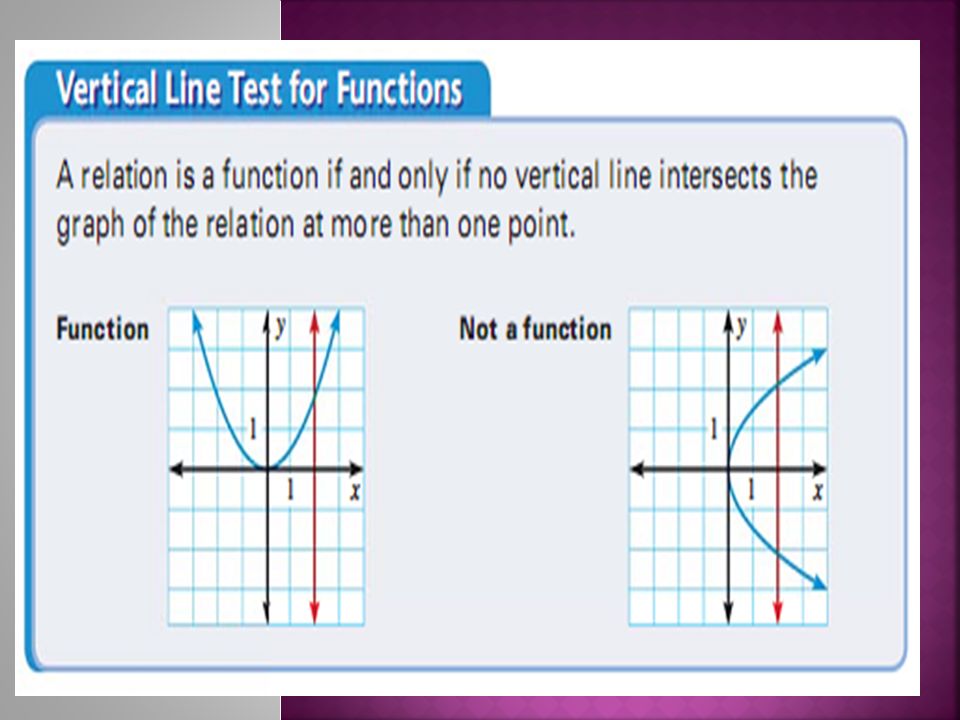
Graph the relations from Ex. 1. Use the vertical line test to tell whether the relation is a function.

7
A. graph the relation shown in the diagram below. B. Explain how to use the vertical line test to show whether the relation is a function.

8
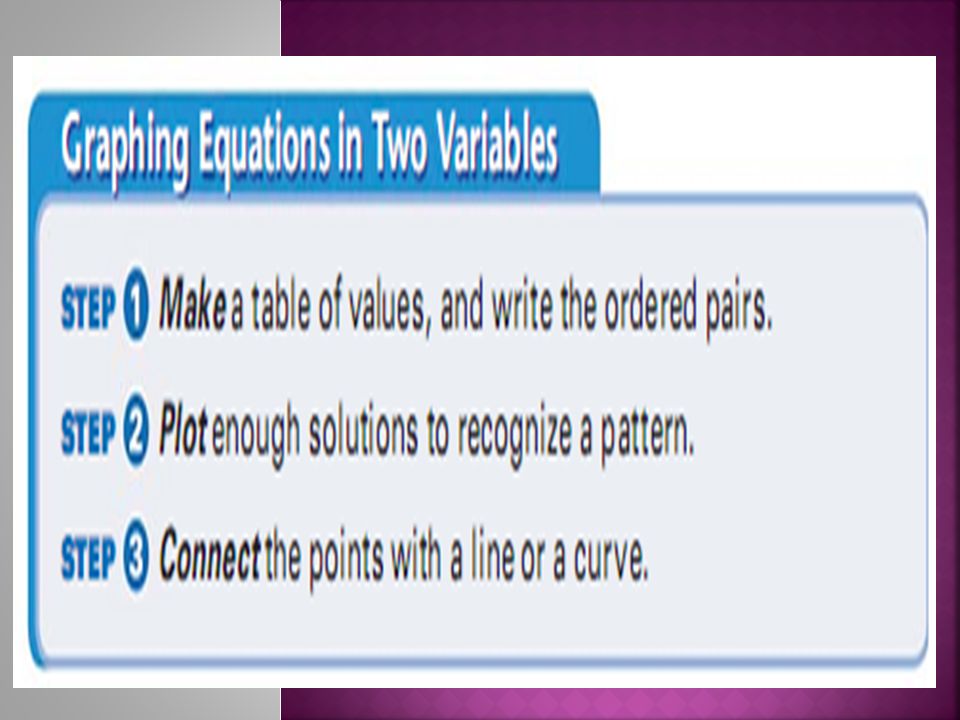
Equations in two variables: such as y = 5x – 2; an ordered pair (x, y) is a solution of such an equation if substituting the values of x and y into the equation makes a true statement. Independent variable: the input variable in an equation. Dependent variable: the output variable.

10
Graph y = x + 1

11
y = x - 3

12
y = -x + 4

13
y = 2x + 3

15
p. 70 – 72 14 – 46 even, 52-56

Similar presentations

 Functions, Rules, Tables and Graphs>")


 domain: -2, -1, 0, 1; 8) domain: -2, -1, 0, 1; range: -9, 2, 4, 5 range: -9, 2, 4, 5 10) domain: -4, -3, 2,>")

, (–1, 1), (1, 3), (2, –2), and (3, 1). a. Identify the.>")


