Download presentation
Presentation is loading. Please wait.

1
Lecture PowerPoint Slides Basic Practice of Statistics 7 th Edition

2
In chapter 15, we cover … 2

3
Parameters and statistics

4
Statistical estimation Population Sample Collect data from a representative Sample... Make an Inference about the Population. The process of statistical inference involves using information from a sample to draw conclusions about a wider population. Different random samples yield different statistics. We need to be able to describe the sampling distribution of possible statistic values in order to perform statistical inference. We can think of a statistic as a random variable because it takes numerical values that describe the outcomes of the random sampling process. Therefore, we can examine its probability distribution using what we learned in earlier chapters.

5
The Law of Large Numbers

6
Sampling distributions

7
Population distributions versus sampling distributions 7 There are actually three distinct distributions involved when we sample repeatedly and measure a variable of interest. 1)The population distribution gives the values of the variable for all the individuals in the population. 2)The distribution of sample data shows the values of the variable for all the individuals in the sample. 3)The sampling distribution shows the statistic values from all the possible samples of the same size from the population.
The population distribution gives the values of the variable for all the individuals in the population. 2)The distribution of sample data shows the values of the variable for all the individuals in the sample. 3)The sampling distribution shows the statistic values from all the possible samples of the same size from the population..")
9
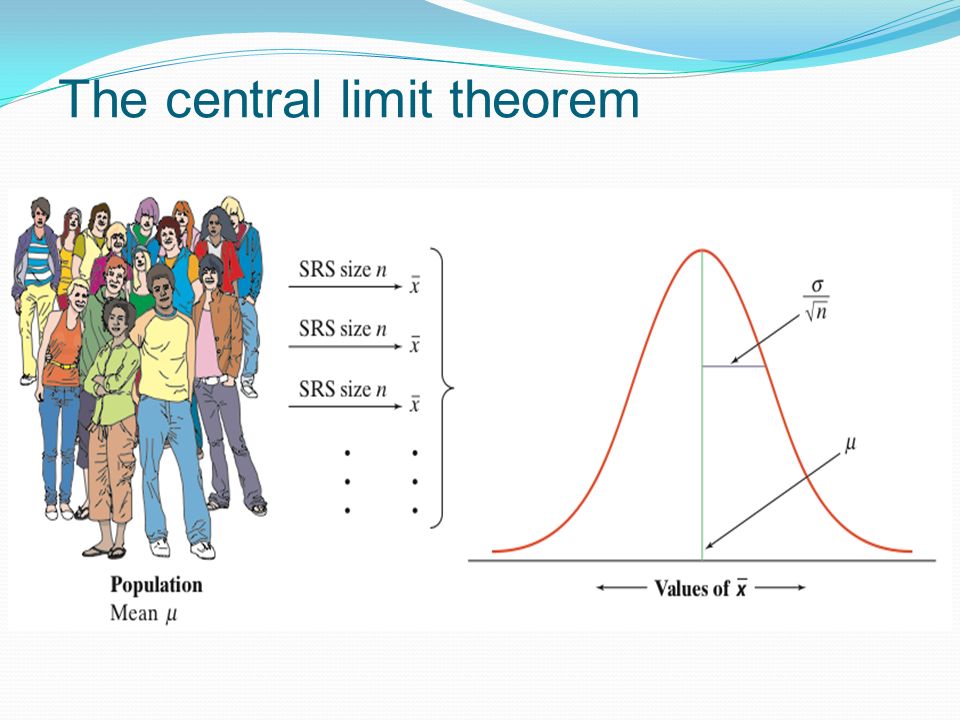
The central limit theorem

11
Central limit theorem: example 11 Based on service records from the past year, the time (in hours) that a technician requires to complete preventative maintenance on an air conditioner follows the distribution that is strongly right-skewed, and whose most likely outcomes are close to 0. The mean time is µ = 1 hour and the standard deviation is σ = 1. Your company will service an SRS of 70 air conditioners. You have budgeted 1.1 hours per unit. Will this be enough? The central limit theorem states that the sampling distribution of the mean time spent working on the 70 units has: The sampling distribution of the mean time spent working is approximately N(1, 0.12) since n = 70 ≥ 30. If you budget 1.1 hours per unit, there is a 20% chance the technicians will not complete the work within the budgeted time.
 since n = 70 ≥ 30. If you budget 1.1 hours per unit, there is a 20% chance the technicians will not complete the work within the budgeted time..")
12
Sampling distributions and statistical significance We have looked carefully at the sampling distribution of a sample mean. However, any statistic we can calculate from a sample will have a sampling distribution. The sampling distribution of a sample statistic is determined by the particular sample statistic we are interested in, the distribution of the population of individual values from which the sample statistic is computed, and the method by which samples are selected from the population. The sampling distribution allows us to determine the probability of observing any particular value of the sample statistic in another such sample from the population.

Similar presentations