Download presentation
Presentation is loading. Please wait.

1
Remote Sensing Theory & Background III GEOG370 Instructor: Yang Shao

2
Vegetation Information Normalized Difference Vegetation Index NDVI: [-1.0, 1.0] Often, the more the leaves of vegetation present, the bigger the Contrast in reflectance in the red and near-infrared spectra.
![Vegetation Information Normalized Difference Vegetation Index NDVI: [-1.0, 1.0] Often, the more the leaves of vegetation present, the bigger the Contrast in reflectance in the red and near-infrared spectra.](http://images.slideplayer.com/31/9714903/slides/slide_2.jpg "Vegetation Information Normalized Difference Vegetation Index NDVI: [-1.0, 1.0] Often, the more the leaves of vegetation present, the bigger the Contrast in reflectance in the red and near-infrared spectra.")
4
2. Feature space and image classification Imagine you have available image data from a multi- spectral scanner that has two narrow spectral bands. One is centered on 0.65 and the other on 1.0 wavelength. Suppose the corresponding region on the earth’s surface consists of water, vegetation and soil. Construct a graph with two axes, one representing the brightness of a pixel in the 0.65 band and the other representing the brightness of the pixel in the 1.0 band. In this show where you would expect to find vegetation pixels, soil pixels and water pixels.

5
An Example “Sorting incoming Fish on a conveyor according to species using optical sensing” Sea bass Species Salmon

6
Problem Analysis Set up a camera and take some sample images to extract features Length Lightness Width Number and shape of fins Position of the mouth, etc…

8
Classification Select the length of the fish as a possible feature for discrimination

10
The length is a poor feature alone! Select the lightness as a possible feature.

13
Image classification “Labeling image pixels according to land use/cover classes using spectral signals” vegetation Land use/cover classes urban water soil

14
11111111 11111111 11222222 11222222 11122111 11111111 11111111 11111111 Forest: 1 Non-forest: 2

15
11111111 11111111 11222222 11222222 11122111 11111111 11111111 11111111 11111111 11111111 22222222 22222222 22222111 22221111 11111111 11111111 Forest: 1 Non-forest: 2 1990 image2000 image

16
1. The rate of land use/cover change 2. The pattern of land use/cover change (e.g., large/small patch, along road/stream) 3. What are the drivers of land use/cover change? 4. What are the environmental, social, economic, and human health consequences of current and potential land-use and land-cover change
 3. What are the drivers of land use/cover change. 4. What are the environmental, social, economic, and human health consequences of current and potential land-use and land-cover change.")
17
Fragmentation Statistics Landscape Composition Proportional Abundance of each Class Landscape Configuration Patch size distribution and density Patch shape complexity Isolation/Proximity See Fragstats website: http://www.umass.edu/landeco/research/fragstats/fragstats.html

18
Remote sensing applications Deforestation Urban growth mapping Coastal wetlands vegetation Geology (mineral identification) Precision Agriculture Sea surface temperature Identify invasive species
 Precision Agriculture Sea surface temperature Identify invasive species")
19
Wrapping up: You should know What is remote sensing? How it works? Remote sensing data characteristics NDVI How image classification works Some applications (e.g., biodiversity and conservation)
.")
20
Remote sensing for biodiversity 1. Two approaches - direct and indirect approaches 2. Challenges - spatial/spectral resolution - data analysis

21
Elementary Spatial Analysis

22
Overview Spatial Analysis Flowcharting Query Defining spatial characteristics

23
Spatial Analysis Spatial analysis: Way in which we turn raw data into useful information A set of techniques whose results are dependent on the locations of the objects being analyzed Variety of methods Powerful computers Intelligent users

24
Preparing a Spatial Analysis: Flowcharting Flowchart tools provided by: ESRI’s Model Builder, ERDAS’s GIS Modeler, etc.) Objective – systematizing thinking and documenting procedures about a GIS application/project InputOutput Operation (Plus conditions) General form of most GIS flowcharts: From Fundamentals of Geographic Information Systems, Demers (2005)
 Objective – systematizing thinking and documenting procedures about a GIS application/project InputOutput Operation (Plus conditions) General form of most GIS flowcharts: From Fundamentals of Geographic Information Systems, Demers (2005)")
25
GIS Data Query Important Why? Narrowing down information Better understanding of map What might you want to know? Which features occur most often How often they occur Where are they located?

26
Vector data Select by attributes Select by location Raster data Raster calculator GIS Data Query: Vector and rater data

27
GIS Data Query What is it? Using tools to find records meeting specific criteria How? Select criteria Use operators to define expression Simple Complex And: Intersection of sets Ex.: ([area] > 1500) and ( [b_room] > 3) Or: Union of sets Ex: ([age] 65) Not: Subtracts one set from another set Ex.: ([sub_region] = "N Eng") and ( not ( [state_name] = "Maine"))
 and ( [b_room] > 3) Or: Union of sets Ex: ([age] 65) Not: Subtracts one set from another set Ex.: ([sub_region] = N Eng ) and ( not ( [state_name] = Maine )).")
28
Raster calculator

29
Examining vector entities’ attributes Check spatial objects’ properties Using identify tool Using find tool Performing queries GIS Data Query: Vector

30
GIS Data Query: Raster Examining raster attributes Unique colors assigned to attribute values Tabulating results # of grid cells in each category For those interested in landscape ecology fragmentation statistics

Similar presentations
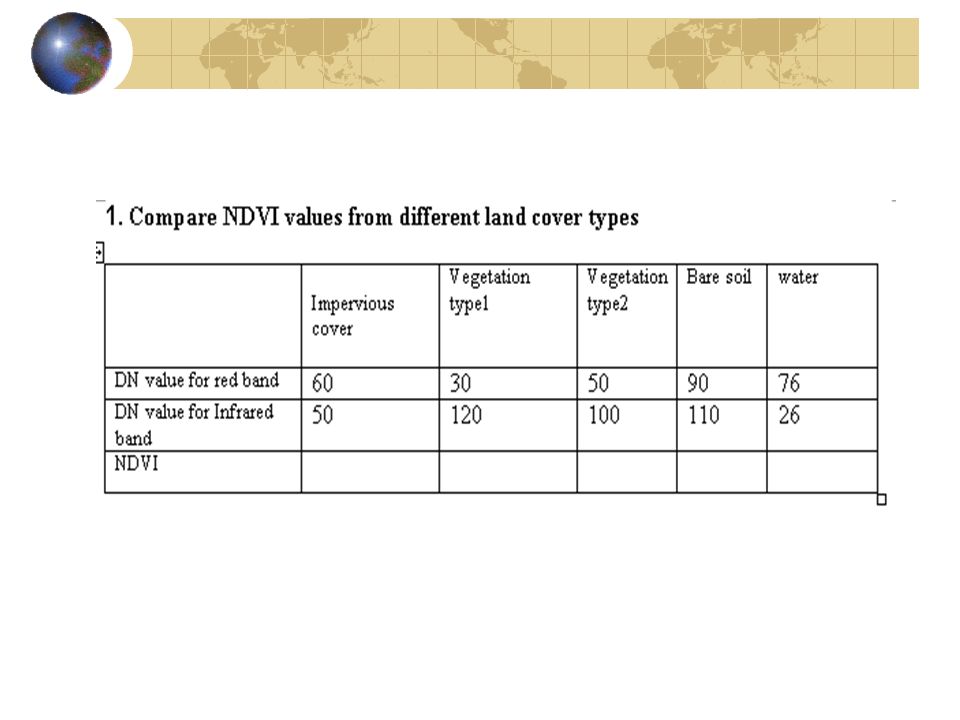
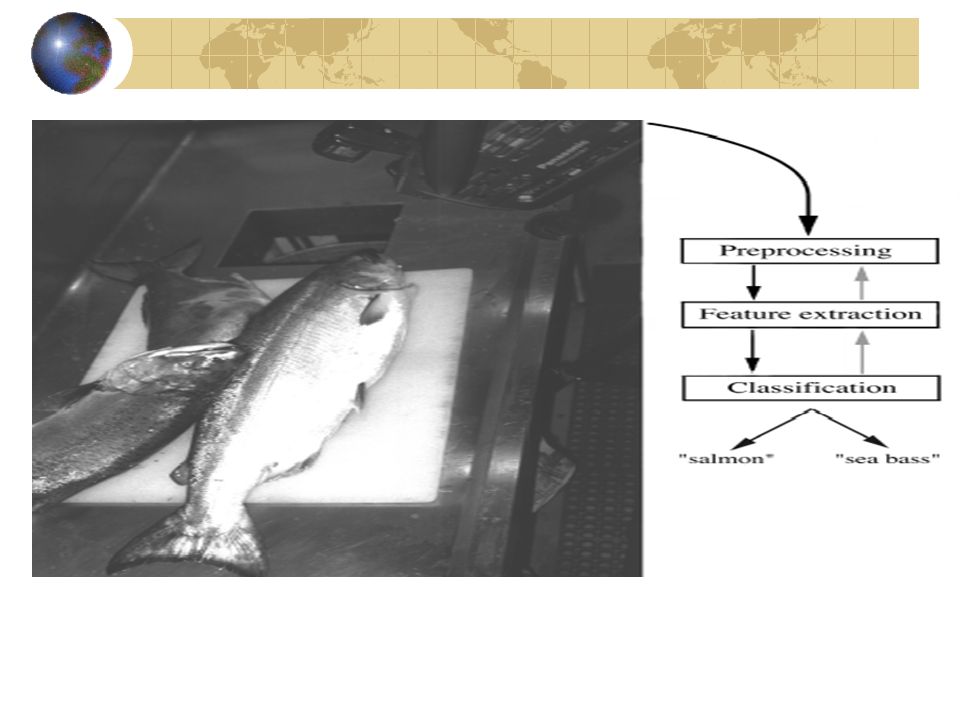
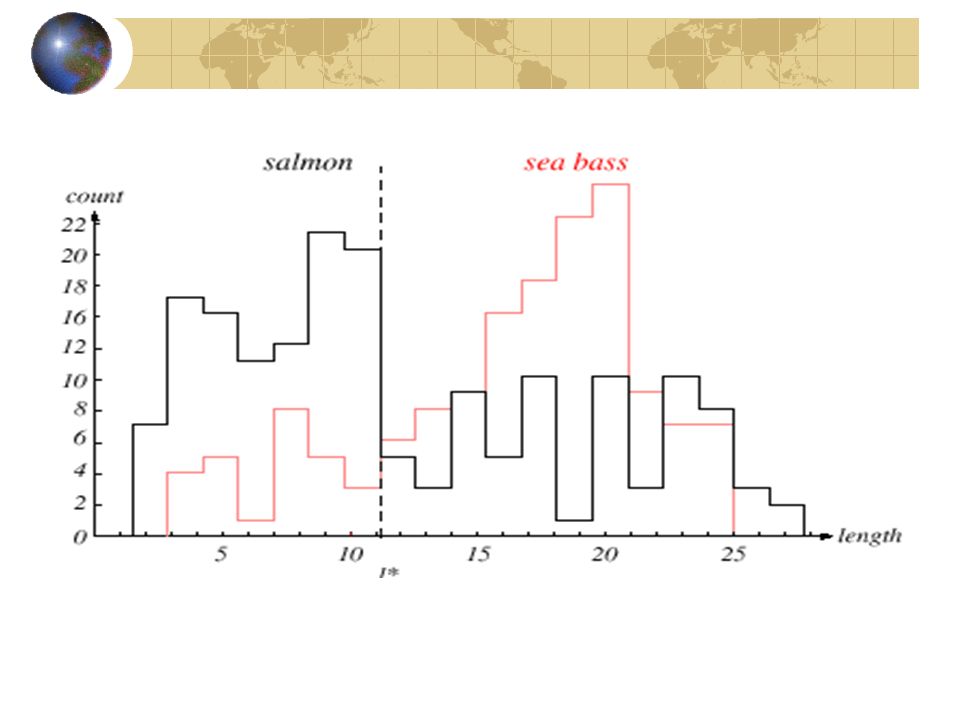
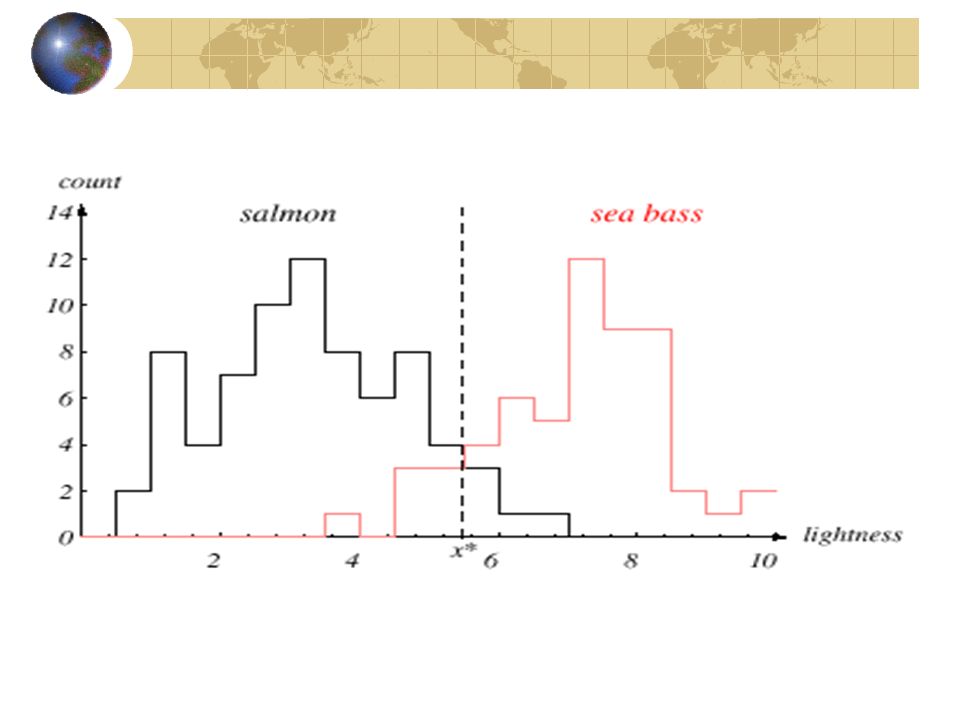
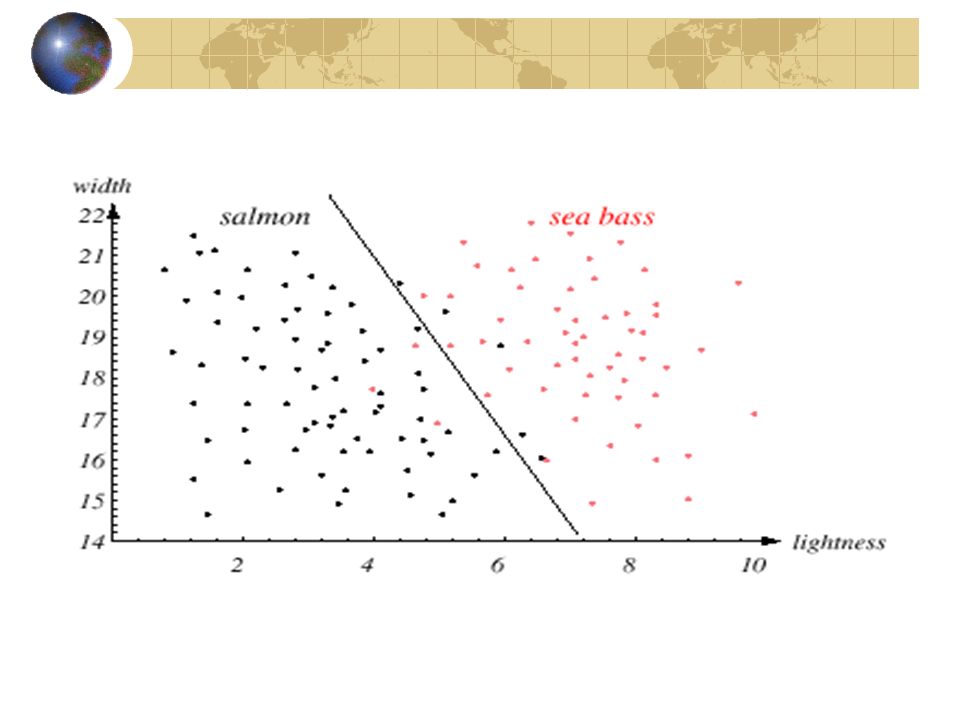
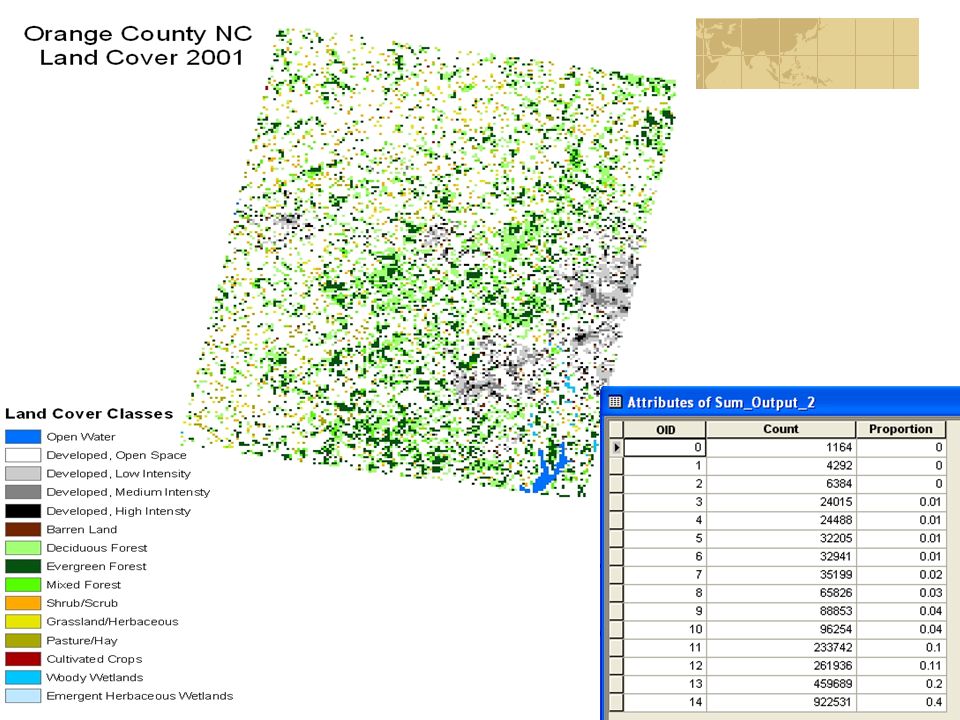


 Image Quality Assessment Radiometric Correction Geometric Correction Image Classification Introduction.>")


 by R. O. Duda, P. E. Hart and D. G. Stork, John.>")


 by R. O. Duda, P. E. Hart and D. G. Stork, John Wiley.>")
