Download presentation
Presentation is loading. Please wait.

1
District Assessment Report 2005-2006 School Year

2
Testing Calendar October: HSPA Retest March: NJASK 3, 4, 5, 6, 7; GEPA, HSPA May: AP

3
Alphabet Soup of Testing No Child Left Behind (NCLB) Proficiency Levels Student Subgroups Adequate Yearly Progress (AYP) AYP Increments Status Reports District Factor Group (DFG)
 Proficiency Levels Student Subgroups Adequate Yearly Progress (AYP) AYP Increments Status Reports District Factor Group (DFG)")
4
Proficiency Levels Partially Proficient (scale score 100-199) Proficient (scale score 200-249) Advanced Proficient (scale score 250-300)
 Proficient (scale score ) Advanced Proficient (scale score )")
5
Student Subgroups Total Students Native American/Alaskan Native Asian/Pacific Islander African American Hispanic White Limited English Proficiency Economically Disadvantaged Students with Disabilities Other

6
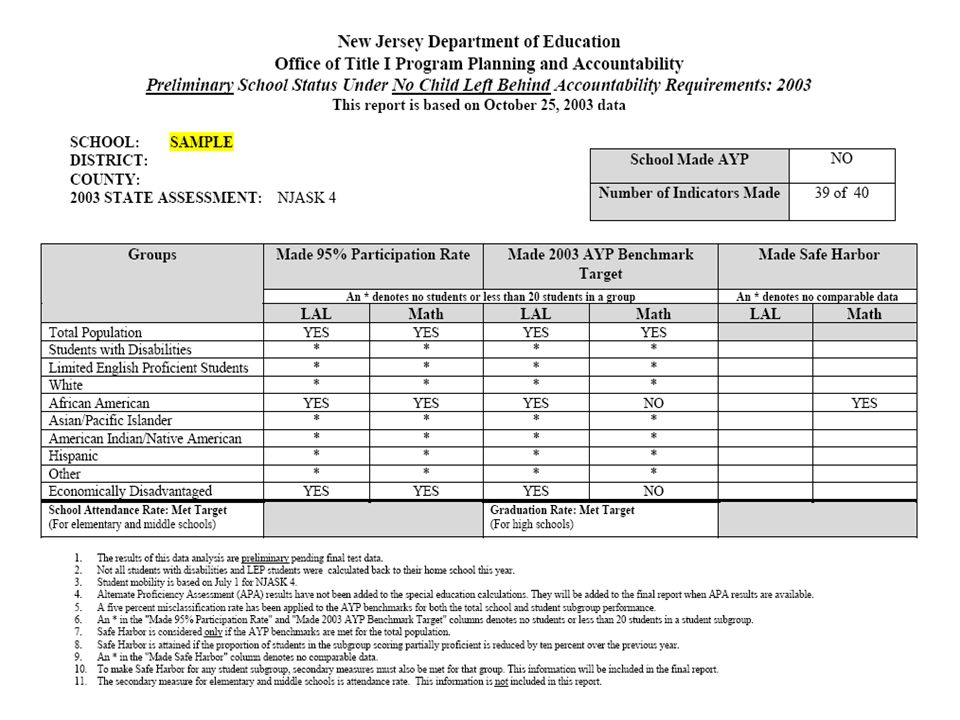
Adequate Yearly Progress To make AYP, each school and district must meet 40 indicators: 95% Participation for 10 student subgroups in Language Arts Literacy (LAL) and Mathematics Meet or Exceed Proficiency: The 10 student subgroups must meet the State's measurable AYP goals regarding the percentage of students scoring proficient or better.
 and Mathematics Meet or Exceed Proficiency: The 10 student subgroups must meet the State s measurable AYP goals regarding the percentage of students scoring proficient or better.")
7
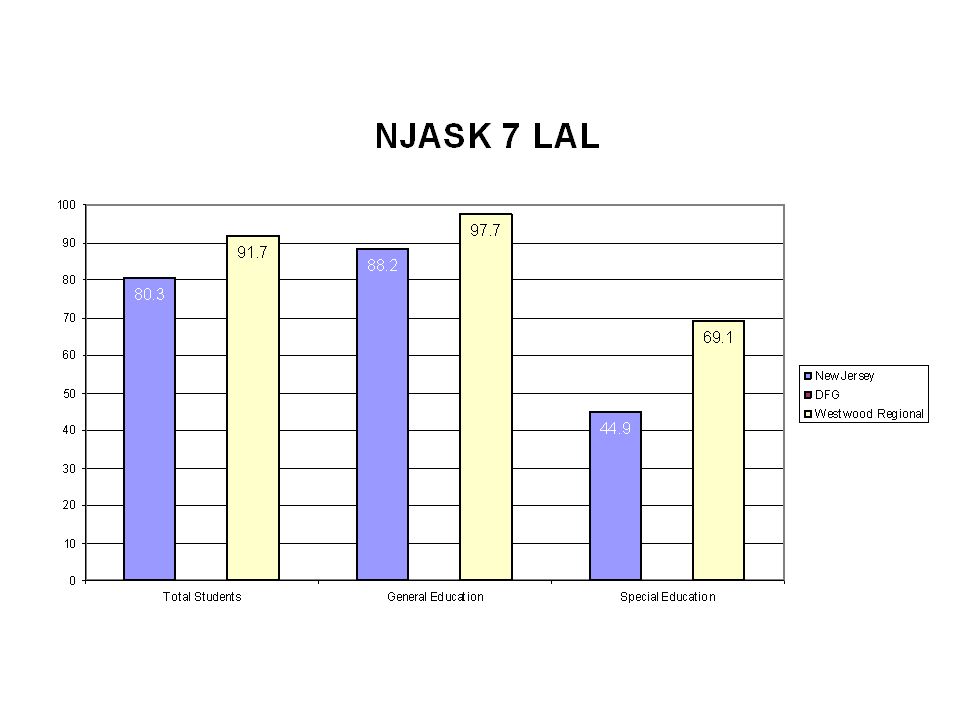
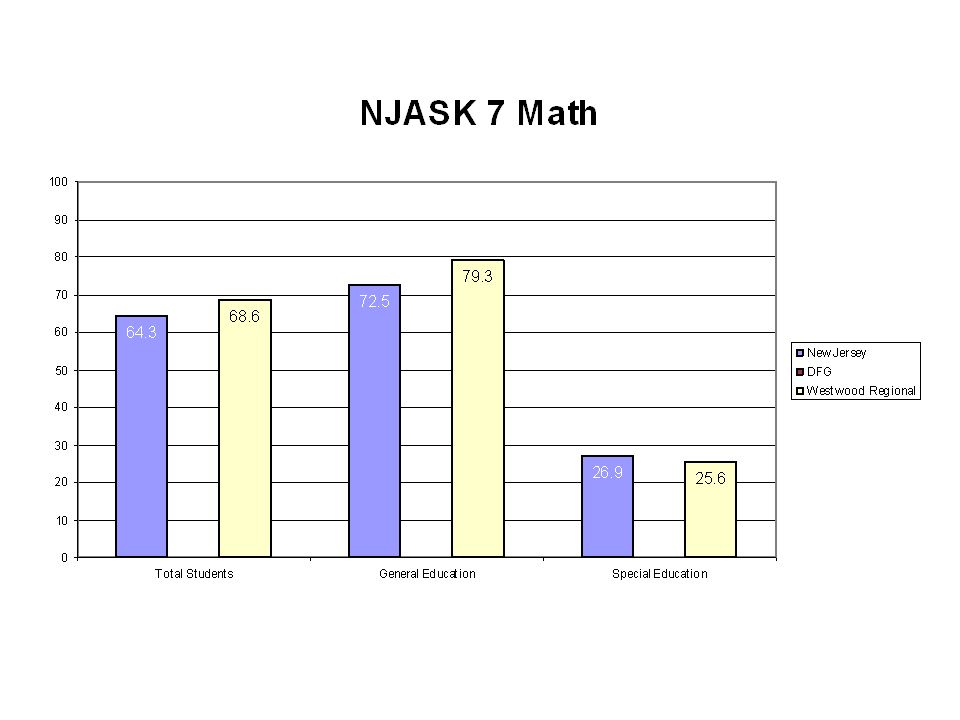
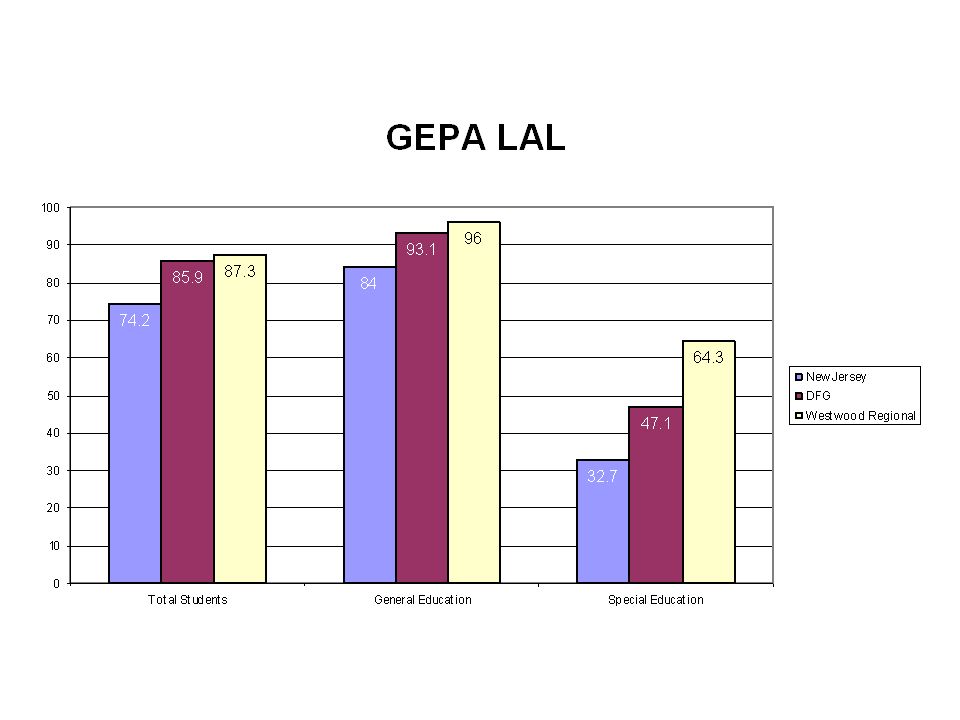
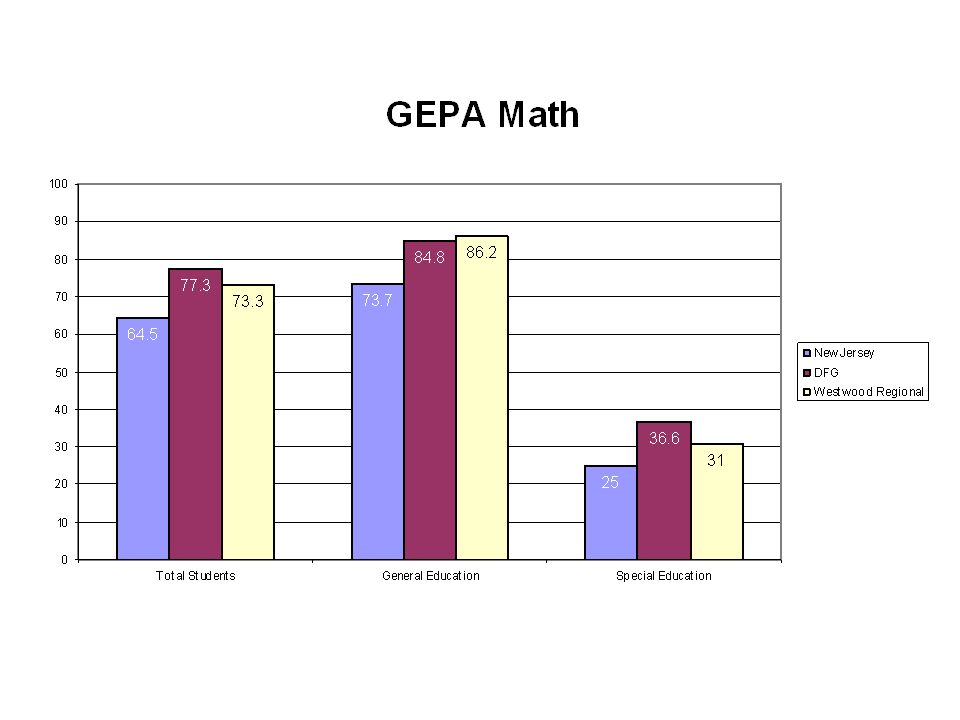
Increments for Demonstrating AYP Content Area Grade2002- 2003 20042005200620072008200920102011201220132013- 2014 LAL468 75 82 91 100 858 66 76 87 100 1273 79 85 92 100 Math453 62 73 85 100 839 49 62 79 100 1255 64 74 86 100

9
What is the District Factor Group? Districts are grouped by socio-economic factors. Our DFG is GH (76 other GH districts statewide). Other Bergen County GH districts include Emerson, Fair Lawn, Hillsdale, Leonia, Midland Park, Northvale, Paramus, Rutherford, Teaneck, and Waldwick.
. Other Bergen County GH districts include Emerson, Fair Lawn, Hillsdale, Leonia, Midland Park, Northvale, Paramus, Rutherford, Teaneck, and Waldwick..")
29
Advanced Placement Westwood Regional High School offers 12 AP courses. Scores of 3, 4, or 5 on AP tests are comparable to an A or B in college. Such scores will generally result in some advantage at the college a student attends.

30
What does that advantage look like? 1. Receive college credit for a particular AP course. 2. Be granted an exemption by the college or university from entry-level courses. 3. Gain tuition savings – up to a year of credit may be given to students with qualifying grades. 4. Have greater flexibility in scheduling and more opportunity to take electives. 5. Gain eligibility for honors and other special programs open to students who have received AP recognition.

31
Advanced Placement Trends May# of test takers # of testsNumber of tests scored at 4 or 5 Number of tests scored at 3 Percent of tests equivalent to a college A or B 200258121523370 % 200372108252244 % 2004107156263338 % 200588117172839 % 200674112353361%

32
2006 Advanced Placement Scholars AP Scholars with DistinctionAP Scholars with HonorAP Scholars Rimida Panzer Anil Fermin Alina EasterbrookGabrielle Canaie Douglas Giombarrese Walter Joseph Kirsten Kuizema Jessica Nelson Kenneth Barney Elina Kremen AP Scholar with Distinction—average grade of 3.5 on all AP exams taken and grades of 3.0 or higher on five or more exams. AP Scholar with Honor—average grade of 3.25 on all AP exams taken and grades of 3.0 or higher on four or more of these exams. AP Scholar—grades of 3 or higher on three or more of the exams.

33
What Do We Do With The Information? District One-Year & Multi-Year Action Plans Principals’ PIPs Building-Level Objectives Teachers’ PIPs Professional Development for Staff Practice SAT/ACT

34
Questions?

Similar presentations


 “No Child Left Behind” (2002) Adequacy Committee February 6,2008.>")


 Accountability “Chief school administrators shall.>")
 Accountability “Chief school administrators shall.>")


 Results Lodi Unified School District Prepared by the Assessment, Research, and Evaluation August 17, 2010 Board Study.>")


 Michigan Department of Education Office of Psychometrics, Accountability, Research, & Evaluation Summer.>")


