Download presentation
Presentation is loading. Please wait.

1
An overview of South African schooling and our role in improving it
SA Principals Association | 14 May 2015

2
Outline Overview of the SA education system
State of education since the transition Teacher content knowledge in South Africa What is the role of school management in addressing the problem? Conclusion

3
Civil service capacity Accountability & Capacity
Things to discuss? Teacher CK Teacher unions Teacher training (in & pre) Civil service capacity Resources Access vs Quality Grade R / ECD Accountability & Capacity LOLT Student performance Teacher absenteeism Learning deficits
 Civil service capacity. Resources. Access vs Quality. Grade R / ECD. Accountability & Capacity. LOLT. Student performance. Teacher absenteeism. Learning deficits.")
4
Civil service capacity Accountability & Capacity
Things to discuss? Teacher CK Teacher unions Teacher training (in & pre) Civil service capacity Resources Access vs Quality Grade R / ECD Accountability & Capacity LOLT Student performance Teacher absenteeism Learning deficits
 Civil service capacity. Resources. Access vs Quality. Grade R / ECD. Accountability & Capacity. LOLT. Student performance. Teacher absenteeism. Learning deficits.")
5
An overview of the South African education system
(1) An overview of the South African education system
 An overview of the South African education system.")
6
Overview of education in SA
12.4m students 4 % of students are in independent schools (i.e. 96% public) 25,826 schools 6% of schools are independent schools (i.e. 94% public) 425,000 teachers 8% of teachers are in independent schools (i.e. 92% public) Near universal access up to Grade 9 (quality?!) Foundation Phase Intermediate Phase Senior Phase FET Phase Gr1-3 Gr 4-6 Gr 7-9 Gr10-12
 25,826 schools. 6% of schools are independent schools (i.e. 94% public) 425,000 teachers. 8% of teachers are in independent schools (i.e. 92% public) Near universal access up to Grade 9 (quality !) Foundation Phase. Intermediate Phase. Senior Phase. FET Phase. Gr1-3. Gr 4-6. Gr 7-9. Gr")
7
Expenditure on education 2010/11
Total government expenditure (31% GDP in 2010/11 – R733.5bn) Government exp on education (19.5% of Gov exp: R143.1bn) 17% 5% Figures from 2012 Public Expenditure Analysis report for UNICEF/DBE (Oxford Policy Management / Stellenbosch Economics) Education exp = 6.1% of GDP Personnel exp = 78% of educ exp Personnel exp = 4.8% of GDP
 Government exp on education. (19.5% of Gov exp: R143.1bn) 17% 5% Figures from 2012 Public Expenditure Analysis report for UNICEF/DBE (Oxford Policy Management / Stellenbosch Economics) Education exp = 6.1% of GDP. Personnel exp = 78% of educ exp. Personnel exp = 4.8% of GDP.")
8
State of SA education since transition
“Although 99.7% of South African children are in school…the outcomes in education are abysmal” (Manuel, 2011) “Without ambiguity or the possibility of misinterpretation, the pieces together reveal the predicament of South African primary education” (Fleisch, 2008: 2) “Our researchers found that what students know and can do is dismal” (Taylor & Vinjevold, 1999) “It is not an overstatement to say that South African education is in crisis.” (Van der Berg & Spaull, 2011) Fleisch, B. (2008). Primary Education in Crisis: Why South African schoolchildren underachieve in reading and mathematics. Cape Town. : Juta & Co. Taylor, N., Muller, J., & Vinjevold, P. (2003). Getting Schools Working. Cape Town: Pearson Education. South African education: the poorest choice [M&G, 8 Apr 2011] (Co-authored with Prof Servaas van der Berg)
 Without ambiguity or the possibility of misinterpretation, the pieces together reveal the predicament of South African primary education (Fleisch, 2008: 2) Our researchers found that what students know and can do is dismal (Taylor & Vinjevold, 1999) It is not an overstatement to say that South African education is in crisis. (Van der Berg & Spaull, 2011) Fleisch, B. (2008). Primary Education in Crisis: Why South African schoolchildren underachieve in reading and mathematics. Cape Town. : Juta & Co. Taylor, N., Muller, J., & Vinjevold, P. (2003). Getting Schools Working. Cape Town: Pearson Education. South African education: the poorest choice [M&G, 8 Apr 2011] (Co-authored with Prof Servaas van der Berg)")
9
Student performance TIMSS (2003) PIRLS (2006) SACMEQ (2007) TIMSS (2011) prePIRLS (2011) TIMSS 2003 (Gr8 Maths & Science) Out of 50 participating countries (including 6 African countries) SA came last Only 10% reached low international benchmark No improvement from TIMSS 1999-TIMSS 2003 See Reddy et al (2006) PIRLS (Gr 4/5 – Reading) Out of 45 participating countries SA came last 87% of gr4 and 78% of Gr 5 learners deemed to be “at serious risk of not learning to read” See Howie et al. (2006) SACMEQ III (Gr6 – Reading & Maths) SA came 10/15 for reading and 8/15 for maths behind countries such as Swaziland, Kenya and Tanzania See Moloi & Chetty (2010) & Spaull (2012) TIMSS (Gr9 – Maths & Science) SA has joint lowest performance of 42 countries Improvement by 1.5 grade levels ( ) 76% of grade nine students in 2011 still had not acquired a basic understanding about whole numbers, decimals, operations or basic graphs, and this is at the improved level of performance See Reddy et al. (2012) & Spaull (2013) prePIRLS2011 (Gr 4 Reading) 29% of SA Gr4 learners completely illiterate (cannot decode text in any langauge) See Howie et al (2012) NSES 2007/8/9 Gr 3/4/5 See Taylor, Van der Berg & Mabogoane (2013) Systemic Evaluations 2007 Gr 3/6 Matric exams Gr 12 The most comprehensive reports for each of these datasets are as follows: SACMEQ (Moloi & Chetty, 2011), TIMSS (Reddy, 2006), PIRLS (Howie, et al., 2008), Systemic Evaluations (Department of Education, 2008), National School Effectiveness Study (Taylor, 2011b),and the Annual National Assessments (Department of Basic Education, 2011).
 Out of 50 participating countries (including 6 African countries) SA came last. Only 10% reached low international benchmark. No improvement from TIMSS 1999-TIMSS See Reddy et al (2006) PIRLS 2006 (Gr 4/5 – Reading) Out of 45 participating countries SA came last. 87% of gr4 and 78% of Gr 5 learners deemed to be at serious risk of not learning to read See Howie et al. (2006) SACMEQ III 2007 (Gr6 – Reading & Maths) SA came 10/15 for reading and 8/15 for maths behind countries such as Swaziland, Kenya and Tanzania. See Moloi & Chetty (2010) & Spaull (2012) TIMSS 2011 (Gr9 – Maths & Science) SA has joint lowest performance of 42 countries. Improvement by 1.5 grade levels ( ) 76% of grade nine students in 2011 still had not acquired a basic understanding about whole numbers, decimals, operations or basic graphs, and this is at the improved level of performance. See Reddy et al. (2012) & Spaull (2013) prePIRLS2011 (Gr 4 Reading) 29% of SA Gr4 learners completely illiterate (cannot decode text in any langauge) See Howie et al (2012) NSES 2007/8/9. Gr 3/4/5. See Taylor, Van der Berg & Mabogoane (2013) Systemic Evaluations Gr 3/6. Matric exams. Gr 12. The most comprehensive reports for each of these datasets are as follows: SACMEQ (Moloi & Chetty, 2011), TIMSS (Reddy, 2006), PIRLS (Howie, et al., 2008), Systemic Evaluations (Department of Education, 2008), National School Effectiveness Study (Taylor, 2011b),and the Annual National Assessments (Department of Basic Education, 2011).")
10
Inequality: Two public schooling systems

11
Bimodality – indisputable fact
PIRLS / TIMSS / SACMEQ / NSES / ANA / Matric… by Wealth / Language / Location / Dept…

12
“But what does this low & unequal performance look like in practice, on the ground, in the classroom?”

13
NSES question 42 NSES followed about students (266 schools) and tested them in Grade 3 (2007), Grade 4 (2008) and Grade 5 (2009). Grade 3 maths curriculum: “Can perform calculations using appropriate symbols to solve problems involving: division of at least 2-digit by 1-digit numbers” Even at the end of Grade 5 most (55%+) quintile 1-4 students cannot answer this simple Grade-3-level problem. “The powerful notions of ratio, rate and proportion are built upon the simpler concepts of whole number, multiplication and division, fraction and rational number, and are themselves the precursors to the development of yet more complex concepts such as triangle similarity, trigonometry, gradient and calculus” (Taylor & Reddi, 2013: 194) Taylor, N., & Reddi, B. (2013). Writing and learning mathematics. In N. Taylor, S. Van der Berg, & T. Mabogoane, Creating Effective Schools. Cape Town: Pearson. (Spaull & Viljoen, 2014)
 quintile 1-4 students cannot answer this simple Grade-3-level problem. The powerful notions of ratio, rate and proportion are built upon the simpler concepts of whole number, multiplication and division, fraction and rational number, and are themselves the precursors to the development of yet more complex concepts such as triangle similarity, trigonometry, gradient and calculus (Taylor & Reddi, 2013: 194) Taylor, N., & Reddi, B. (2013). Writing and learning mathematics. In N. Taylor, S. Van der Berg, & T. Mabogoane, Creating Effective Schools. Cape Town: Pearson. (Spaull & Viljoen, 2014)")
14
Insurmountable learning deficits
Figure 10b: South African mathematics learning trajectories by national socioeconomic quintiles using a variable standard deviation for a year of learning (0.28 in grade 3 to 0.2 in grade 8 with interpolated values for in-between grades (Based on NSES 2007/8/9 for grades 3/4/5, SACMEQ 2007 for grade 6 and TIMSS 2011 for grade 9, including 95% confidence interval Spaull & Viljoen, 2015

15
Matric 2014 (relative to Gr 2 in 2004)
550,000 students drop out before matric 99% do not get a non-matric qualification (Gustafsson, 2011: p11) What happens to them? 50% youth unemployment… Numbers Grade 2 (2004) Grade 9 (2011) Grade 12 (2014) 532860 Passed (2014) 403874 Bachelors (2014) 150752
 What happens to them 50% youth unemployment… Numbers. Grade 2 (2004) Grade 9 (2011) Grade 12 (2014) Passed (2014) Bachelors (2014)")
16
Legislators, managers, assoc professionals
15% Legislators, managers, assoc professionals Semi-Skilled (32%) Clerks, service workers, shop personnel, skilled agric/fishery workers, plant and machinery operators) Unskilled (18%) Elementary occupations & domestic workers Unemployed (Broad - 35%) Labour Market High quality secondaryschool University/FET Type of institution (FET or University) Quality of institution Type of qualification (diploma, degree etc.) Field of study (Engineering, Arts etc.) High SES background (with early childhood development) High productivity jobs and incomes (15%) Mainly professional, managerial & skilled jobs Requires graduates, good quality matric or good vocational skills High quality primary school Minority (20%) Unequal society Big demand for good schools despite fees Some scholarships/bursaries Vocational training Affirmative action (few make this transition) Some motivated, lucky or talented students make the transition Low quality secondary school Majority (80%) Low socioeconomic status background Attainment Quality Type Low productivity jobs & incomes Often manual or low skill jobs Limited or low quality education Low quality primary school The QLFS classifies professions as follows: Highly skilled (legislators, senior officials and managers, professionals, technicians and associate profesionals); Semi-skilled (Clerks, service workers and shop and market personnel, skilled agricultural and fishery workers, craft and related trade workers, plant and machinery operators and assembly), Unskilled (Elementary occupations, domestic workers). Statistics from Quarterly Labour Force Survey (QLFS) 2014 Q4
 Clerks, service workers, shop personnel, skilled agric/fishery workers, plant and machinery operators) Unskilled. (18%) Elementary occupations & domestic workers. Unemployed. (Broad - 35%) Labour Market. High quality secondaryschool. University/FET. Type of institution (FET or University) Quality of institution. Type of qualification (diploma, degree etc.) Field of study (Engineering, Arts etc.) High SES background. (with early childhood development) High productivity jobs and incomes (15%) Mainly professional, managerial & skilled jobs. Requires graduates, good quality matric or good vocational skills. High quality primary school. Minority (20%) Unequal society. Big demand for good schools despite fees. Some scholarships/bursaries. Vocational training. Affirmative action. (few make this transition) Some motivated, lucky or talented students make the transition. Low quality secondary. school. Majority (80%) Low socioeconomic status background. Attainment. Quality. Type. Low productivity jobs & incomes. Often manual or low skill jobs. Limited or low quality education. Low quality primary school. The QLFS classifies professions as follows: Highly skilled (legislators, senior officials and managers, professionals, technicians and associate profesionals); Semi-skilled (Clerks, service workers and shop and market personnel, skilled agricultural and fishery workers, craft and related trade workers, plant and machinery operators and assembly), Unskilled (Elementary occupations, domestic workers). Statistics from Quarterly Labour Force Survey (QLFS) 2014 Q4.")
17
Mathematics content knowledge of SA teachers
(2) Mathematics content knowledge of SA teachers
 Mathematics content knowledge of SA teachers.")
18
New (2014) research on mathematics teacher content knowledge
Using SACMEQ 2007 teacher test, Venkat & Spaull classify the 42 items in the SACMEQ maths teacher test according to content strand and grade level 9 items at Gr4/5 level 19 items at Gr6/7 level 14 items at Gr 8/9 level Classify teachers based on grade-level using a 60% minimum mark requirement for threshold Less than grade 4/5 content knowledge Grades 4 & 5 content knowledge Grades 4, 5, 6 ,7 content knowledge Grades 4, 5, 6, 7, 8 and 9 content knowledge *Given that the test items were structured in MCQ format all responses were corrected using Frary’s correction formula

19
Forthcoming work on primary school mathematics teachers in SA (Spaull & Venkat, 2014)
Figure 1: Proportion of South African grade 6 mathematics teachers by content knowledge (CK) group - SACMEQ 2007 (with 95% confidence interval) [401 Gr6 maths teachers]
 group - SACMEQ 2007 (with 95% confidence interval) [401 Gr6 maths teachers]")
20
Forthcoming work on primary school mathematics teachers in SA (Spaull & Venkat, 2014)
Figure 5: Proportion of Grade 6 mathematics teachers by CK grouping and quintile of school socioeconomic status (SACMEQ 2007) - with 95% confidence intervals [401 Gr6 maths teachers]
 - with 95% confidence intervals [401 Gr6 maths teachers]")
21
Teacher knowledge Teachers cannot teach what they do not know.
Content knowledge – How to do fractions Pedagogical content knowledge– how to teach fractions Student understands and can do fractions Demonizing teachers is popular, but unhelpful “For every increment of performance I demand from you, I have an equal responsibility to provide you with the capacity to meet that expectation. Likewise, for every investment you make in my skill and knowledge, I have a reciprocal responsibility to demonstrate some new increment in performance” (Elmore, 2004b, p. 93). Role for teacher unions in developing these programs Elmore, R. (2004b). School reform from the inside out: Policy, practice and performance. Cambridge, MA: Harvard Education Press.
. Role for teacher unions in developing these programs. Elmore, R. (2004b). School reform from the inside out: Policy, practice and performance. Cambridge, MA: Harvard Education Press.")
22
What is the role of school management in addressing problem areas?
(3) What is the role of school management in addressing problem areas?
 What is the role of school management in addressing problem areas")
23
Role of SMT Utilizing existing capacity better.
There is existing capacity within schools, within groups of schools and within teacher unions that is currently under-utilized. Master-teachers Mentoring new teachers better (Induction? Internships? Shadowing?) Developing a collaborative culture “My classroom, my kingdom” thinking is unhelpful. Develop a culture of teachers observing each other teach – not to catch each other out or to punish but to learn and improve. “Why do you think no one seemed to understand this particular example?” “What works for you?” “How do you teach this?” “How do you think I can do this better?” Some teachers are better at teaching some subjects/topics than others. Teachers can learn from each other. We mustn’t be afraid to differentiate and say “We all agree that this teacher is the best at teaching XYZ topic, let them observe our teaching and help us improve” Publicly recognizing exceptional teachers. At prize-giving or at big sporting days or other prestigious events, recognize master teachers. Instructional leadership Placing learning at the center of EVERYTHING that the school does. Not soccer or sports or anything else. The chief function of the school is learning. Everyone must know this. Leading teacher development – take charge in advocating for improvements to teaching practices Protecting instructional time Setting clear learning goals Understanding what is going on in your classrooms – what are teachers doing? Lesson observations are important, providing constructive feedback on potential improvements
 Developing a collaborative culture. My classroom, my kingdom thinking is unhelpful. Develop a culture of teachers observing each other teach – not to catch each other out or to punish but to learn and improve. Why do you think no one seemed to understand this particular example What works for you How do you teach this How do you think I can do this better Some teachers are better at teaching some subjects/topics than others. Teachers can learn from each other. We mustn’t be afraid to differentiate and say We all agree that this teacher is the best at teaching XYZ topic, let them observe our teaching and help us improve Publicly recognizing exceptional teachers. At prize-giving or at big sporting days or other prestigious events, recognize master teachers. Instructional leadership. Placing learning at the center of EVERYTHING that the school does. Not soccer or sports or anything else. The chief function of the school is learning. Everyone must know this. Leading teacher development – take charge in advocating for improvements to teaching practices. Protecting instructional time. Setting clear learning goals. Understanding what is going on in your classrooms – what are teachers doing Lesson observations are important, providing constructive feedback on potential improvements.")
24
Current situation RE teacher development
Currently there are no in-service training programs that have been rigorously evaluated and shown to improve mathematics teacher content knowledge, at least not at any scale (circuit or higher). This is one of the SCANDALS of higher education post-apartheid Although there are many small University/NGO initiatives, most are not evaluated and it is unclear if the training: Actually works (does what it intends to do) changes classroom behavior, improves student learning Is scalable from capacity, cost and/or program-design perspectives
. This is one of the SCANDALS of higher education post-apartheid. Although there are many small University/NGO initiatives, most are not evaluated and it is unclear if the training: Actually works (does what it intends to do) changes classroom behavior, improves student learning. Is scalable from capacity, cost and/or program-design perspectives.")
25
What can SMTs do going forward?
Stage 1 - Develop well-specified professional development programs which aim to improve mathematics teacher content knowledge (CK) & pedagogical content knowledge (PCK) Stage 2 – Evaluate the best candidates from Stage 1 in a small-scale setting (i.e teachers). (If programs are successful proceed to stage 3) Stage 3 – Determine whether programs that were successful at Stage 2 (i.e. small scale) can be enacted with integrity in different settings and by different professional development providers (i.e teachers) Stage 4 – If programs can have been shown to be effective at raising teachers’ mathematics content knowledge at scale (i.e. Stage 3). Roll out to an entire districts/provinces. Evaluate province-wide interventions. See Borko, H. (2004) Professional development and teacher learning: Mapping the terrain. Educational Researcher, 33(8), 3-15.
 & pedagogical content knowledge (PCK) Stage 2 – Evaluate the best candidates from Stage 1 in a small-scale setting (i.e teachers). (If programs are successful proceed to stage 3) Stage 3 – Determine whether programs that were successful at Stage 2 (i.e. small scale) can be enacted with integrity in different settings and by different professional development providers (i.e teachers) Stage 4 – If programs can have been shown to be effective at raising teachers’ mathematics content knowledge at scale (i.e. Stage 3). Roll out to an entire districts/provinces. Evaluate province-wide interventions. See Borko, H. (2004) Professional development and teacher learning: Mapping the terrain. Educational Researcher, 33(8),")
26
What can SMTs do going forward?
Main contribution of SMTs. Identify master-teachers from existing members, provide time and resources to develop teacher-training programs Stage 1 - Develop well-specified professional development programs which aim to improve mathematics teacher content knowledge (CK) & pedagogical content knowledge (PCK) Stage 2 – Evaluate the best candidates from Stage 1 in a small-scale setting (i.e teachers). (If programs are successful proceed to stage 3) Stage 3 – Determine whether programs that were successful at Stage 2 (i.e. small scale) can be enacted with integrity in different settings and by different professional development providers (i.e teachers) Stage 4 – If programs can have been shown to be effective at raising teachers’ mathematics content knowledge at scale (i.e. Stage 3). Roll out to an entire districts/provinces. Evaluate province-wide interventions. See Borko, H. (2004) Professional development and teacher learning: Mapping the terrain. Educational Researcher, 33(8), 3-15.
 & pedagogical content knowledge (PCK) Stage 2 – Evaluate the best candidates from Stage 1 in a small-scale setting (i.e teachers). (If programs are successful proceed to stage 3) Stage 3 – Determine whether programs that were successful at Stage 2 (i.e. small scale) can be enacted with integrity in different settings and by different professional development providers (i.e teachers) Stage 4 – If programs can have been shown to be effective at raising teachers’ mathematics content knowledge at scale (i.e. Stage 3). Roll out to an entire districts/provinces. Evaluate province-wide interventions. See Borko, H. (2004) Professional development and teacher learning: Mapping the terrain. Educational Researcher, 33(8),")
27
Questions that need to be answered:
How will we identify “master-teachers” in the profession? Teachers who are universally acknowledged to be exceptional teachers and have a desire to help other teachers. Once we have a successful “Stage 3” intervention, how will we identify teachers that lack content knowledge and pedagogical content knowledge and need the training? Testing? Who creates the test? At what level? Cannot be idealistic (i.e everyone must pass matric math exam). Need to be realistic. Voluntary/compulsory? VERY important to stress that these tests are DEVELOPMENTAL, not PUNITIVE Who will provide the funding for these “master-teachers” to develop the professional development program? DBE? Teachers need to be given a reduced teaching load (replacement-time funded by DBE?) so that they can develop and implement the program. Is it possible for the major teacher unions to collaborate?
. Need to be realistic. Voluntary/compulsory VERY important to stress that these tests are DEVELOPMENTAL, not PUNITIVE. Who will provide the funding for these master-teachers to develop the professional development program DBE Teachers need to be given a reduced teaching load (replacement-time funded by DBE ) so that they can develop and implement the program. Is it possible for the major teacher unions to collaborate")
28
Conclusion It is not an exaggeration to say that there is an ongoing crisis in education in South Africa. Severe inequalities in education translate into severe inequalities in society. It is not an exaggeration to say that there is an ongoing crisis in mathematics teacher content knowledge . Teacher unions and SMTs need to act pre-emptively. You know who the best teachers are. You know who should be developing teacher training programs. You cannot just leave it to universities or DBE or NGOs. We need you.

29
Thank you Comments & Questions
Thank you Comments & Questions? This presentation and papers available online at:

30
Instructional leadership
Meta-analysis of 27 published studies of the effect of instructional leadership on student outcomes yielded the following five aspects of school leadership: Establishing goals and expectations “Goals provide a sense of purpose and priority in an environment where a multitude of tasks can seem equally important and overwhelming. Clear goals focus attention and effort and enable individuals, groups and organizations to use feedback to regulate their performance (p. 661)” Resourcing strategically Planning, coordinating and evaluating teaching and the curriculum Promoting and participating in teacher-learning and development “The leader participates in the learning as leader, learner, or both. The contexts for such learning are both formal (staff meetings and professional development) and informal (discussions about specific teaching problems)” (p663) Ensuring an orderly and supportive environment (Robinson, Lloyd and Rowe, 2008 p.635)
 Resourcing strategically. Planning, coordinating and evaluating teaching and the curriculum. Promoting and participating in teacher-learning and development. The leader participates in the learning as leader, learner, or both. The contexts for such learning are both formal (staff meetings and professional development) and informal (discussions about specific teaching problems) (p663) Ensuring an orderly and supportive environment. (Robinson, Lloyd and Rowe, 2008 p.635)")
31
“Managing to Learn” – Hoadley & Ward (2007)
Most SA principals described their main activity in school as administration and the disciplining of learners rather than the managing of teaching and instruction Factors associated with better performance included Curriculum coverage Parental valuing of and support for education Willingness of the SGB to help the school Structuring of the school day for maximum student learning Effective management of learning and teacher support materials Positive relationships between staff members at the school Collaboration between teachers at the school School having a plan to improve students results

32
Instructional leadership
Instructional leadership is about the leadership practices that create the conditions for enhanced teaching and learning, it is about LEADING LEARNING. This is the core function of every principal. “Management in education is not an end in itself. Good management is an essential aspect of any education service, but its central goal is the promotion of effective teaching and learning…The task of management at all levels of in the education service is ultimately the creation and support of conditions under which teachers and their students are able to achieve learning…the extent to which effective learning is achieved therefore becomes the criterion against which the quality of management is to be judged” (Bush & Heysteck, 2007 p.73)
")
33
Accountability & Capacity

34
Accountability without capacity
“Accountability systems and incentive structures, no matter how well designed, are only as effective as the capacity of the organization to respond. The purpose of an accountability system is to focus the resources and capacities of an organization towards a particular end. Accountability systems can’t mobilize resources that schools don’t have...the capacity to improve precedes and shapes schools’ responses to the external demands of accountability systems (Elmore, 2004b, p. 117). “If policy-makers rely on incentives for improving either a school or a student, then the question arises, incentives to do what? What exactly should educators in failing schools do tomorrow - that they do not do today - to produce more learning? What should a failing student do tomorrow that he or she is not doing today?” (Loveless, 2005, pp. 16, 26). “People who are being asked to do things they don’t know how to do, and being rewarded and punished on the basis of what they don’t know, rather than what they are learning, become skilled at subverting the purposes and authority of the systems in which they work. Bad policies produce bad behaviour. Bad behaviour produces value for no one” (Elmore, 2004a, p. 22).
. If policy-makers rely on incentives for improving either a school or a student, then the question arises, incentives to do what What exactly should educators in failing schools do tomorrow - that they do not do today - to produce more learning What should a failing student do tomorrow that he or she is not doing today (Loveless, 2005, pp. 16, 26). People who are being asked to do things they don’t know how to do, and being rewarded and punished on the basis of what they don’t know, rather than what they are learning, become skilled at subverting the purposes and authority of the systems in which they work. Bad policies produce bad behaviour. Bad behaviour produces value for no one (Elmore, 2004a, p. 22).")
35
Capacity without accountability
“In the absence of accountability sub-systems, support measures are very much a hit and miss affair. Accountability measures provide motivation for and direction to support measures, by identifying capacity shortcomings, establishing outcome targets, and setting in place incentives and sanctions which motivate and constrain teachers and managers throughout the system to apply the lessons learned on training courses in their daily work practices. Without these, support measures are like trying to push a piece of string: with the best will in the world, it has nowhere to go. Conversely, the performance gains achieved by accountability measures, however efficiently implemented, will reach a ceiling when the lack of leadership and technical skills on the part of managers, and curricular knowledge on the part of teachers, places a limit on improved performance. Thus, the third step in improving the quality of schooling is to provide targeted training programs to managers and teachers. To achieve optimal effects, these will need to connect up with and be steered by accountability measures” (Taylor, 2002, p. 17).
.")
36
Good description of human behaviour
“The traditions of school effectiveness research and the economics of education bring complementary perspectives to bear. While the former assumes that individual actors, and in particular school principals and teachers, are motivated by altruism and the desire to do the best for the learners in their care, economists assume that actors are motivated largely by self-interest. Taken together, these views sound like a good description of human behaviour” (Taylor, Van der Berg & Mabogoane, 2013: 24)
")
37
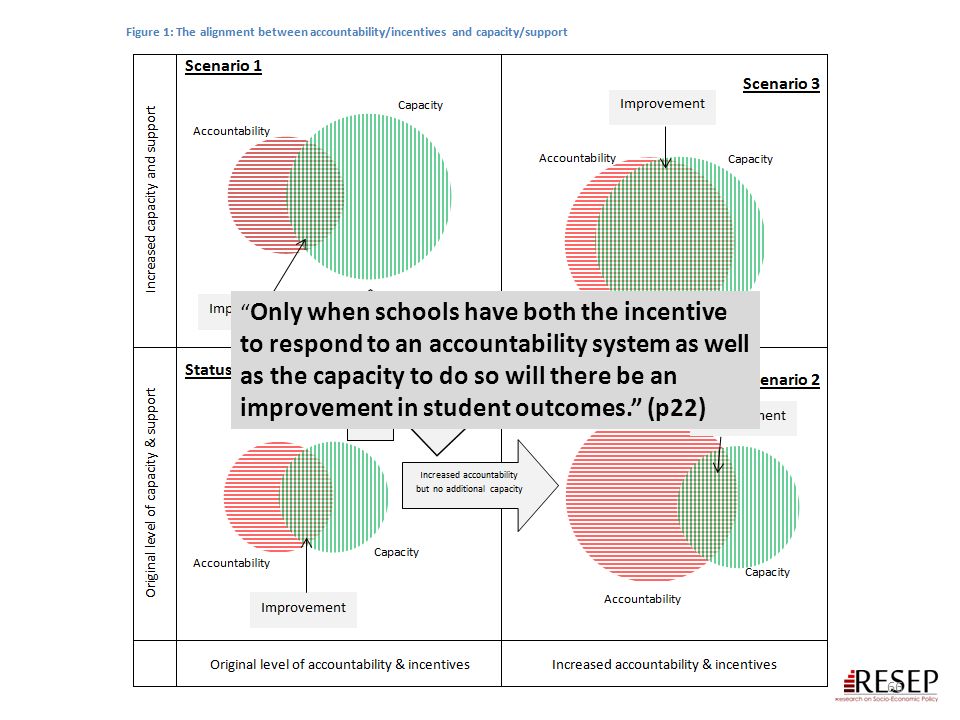
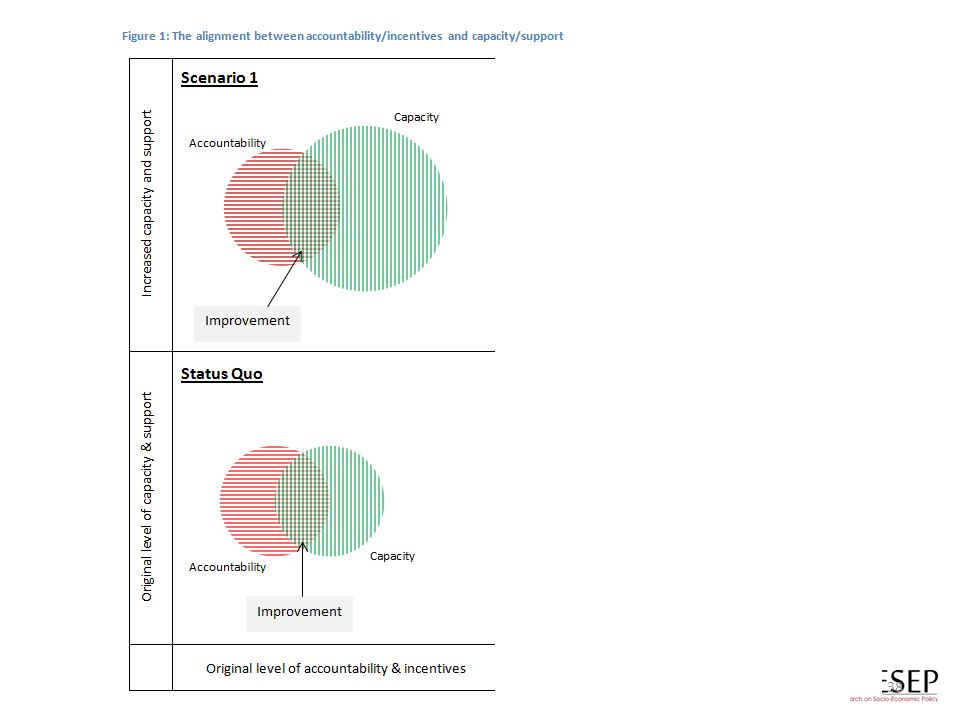
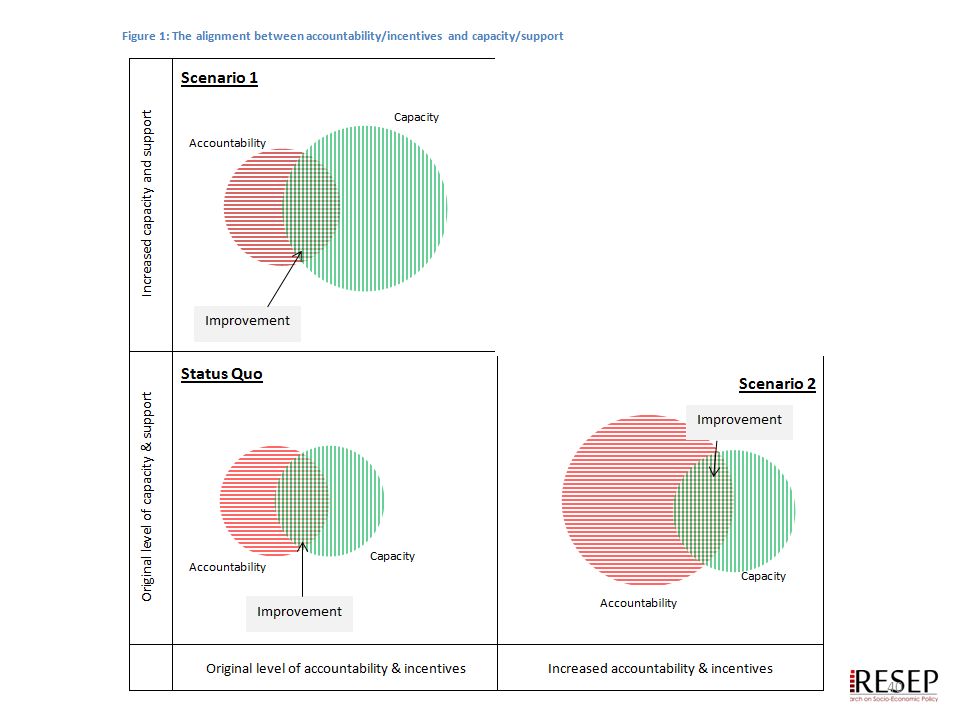
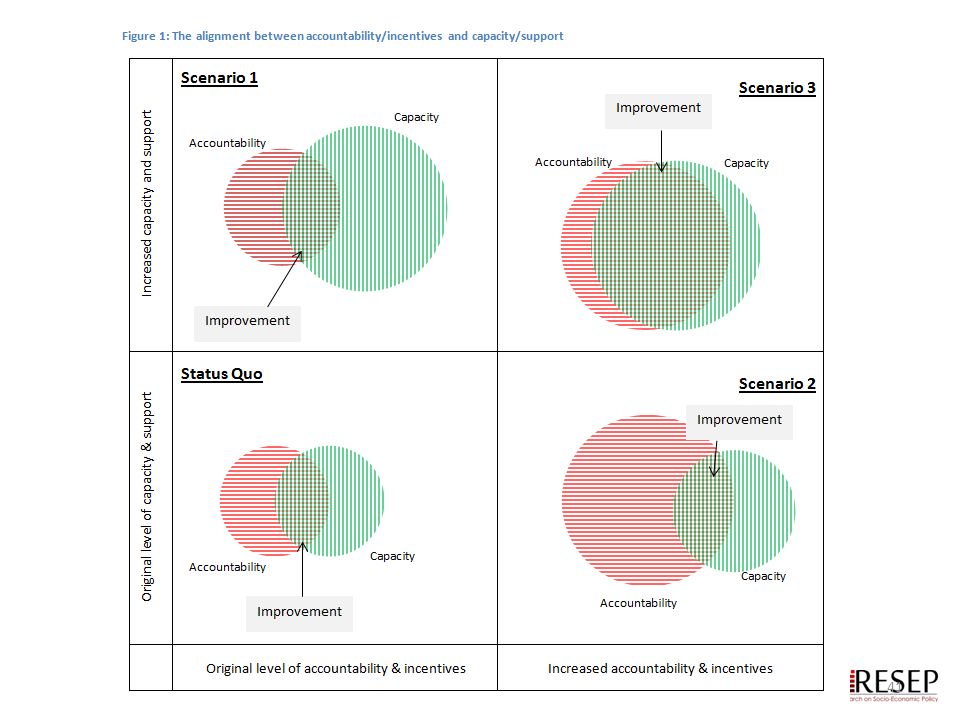
From a forthcoming report on accountability on the

43
“Only when schools have both the incentive to respond to an accountability system as well as the capacity to do so will there be an improvement in student outcomes.” (p22)
")
44
Teacher union membership in SA (as at 31 December 2012)
There are two sources for the data: the main one is the PSCBC – Public Service Co-ordinating Bargaining Council (this is the forum where all of the public sector unions, including educator unions, bargain with the State on matters of mutual interest) And secondly the ELRC – Education Labour Relations Council (this is specifically for educator unions and the DBE to negotiate on matters not part of the PSCBC). Both conduct audits on an annual basis. These are not without errors! I tried to correct one or two of the significant figures and as indicated added in the Ind Sch and SGB members for NAPTOSA. SAOU may have about 2000 such members in addition to their State employed members (not certain of this though). Breakdown as at 31 December 2012 (Audited stats for December 2013 will be availabkle mid-year) These Stats include educators and a small numebr of support staff Union EC GP FS KZN LP MP NC NW WP TOTAL SADTU 45968 29307 13853 57086 43706 25750 5826 18572 12944 253012 NAPTOSA 12508 14805 4171 7346 687 2701 934 3335 9651 56138 SAOU 2957 8090 4925 1244 1174 2452 1581 2242 4197 28862 PEU 380 2807 71 193 7824 1728 128 1210 14341 NATU 580 416 25424 55 1334 284 28473 TOTALS 16225 26282 9583 34207 9740 8215 2643 7071 13848 127814 Thanks to Mike Myburgh (NAPTOSA) for supplying data
 And secondly the ELRC – Education Labour Relations Council (this is specifically for educator unions and the DBE to negotiate on matters not part of the PSCBC). Both conduct audits on an annual basis. These are not without errors! I tried to correct one or two of the significant figures and as indicated added in the Ind Sch and SGB members for NAPTOSA. SAOU may have about 2000 such members in addition to their State employed members (not certain of this though). Breakdown as at 31 December 2012 (Audited stats for December 2013 will be availabkle mid-year) These Stats include educators and a small numebr of support staff. Union. EC. GP. FS. KZN. LP. MP. NC. NW. WP. TOTAL. SADTU NAPTOSA SAOU PEU NATU TOTALS Thanks to Mike Myburgh (NAPTOSA) for supplying data.")
45
SADTU membership

46
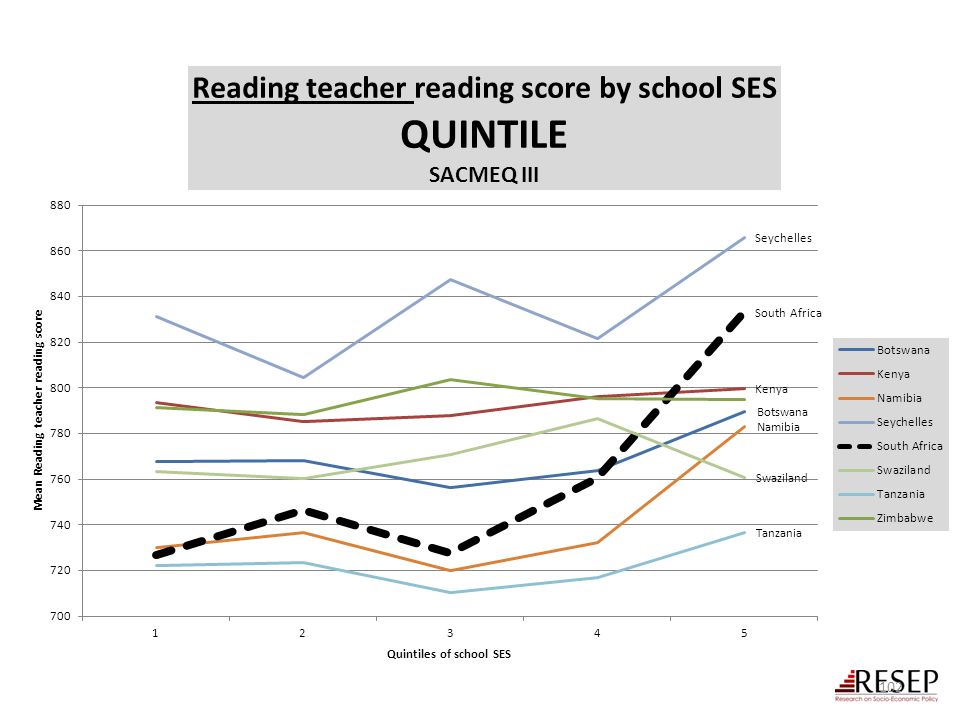
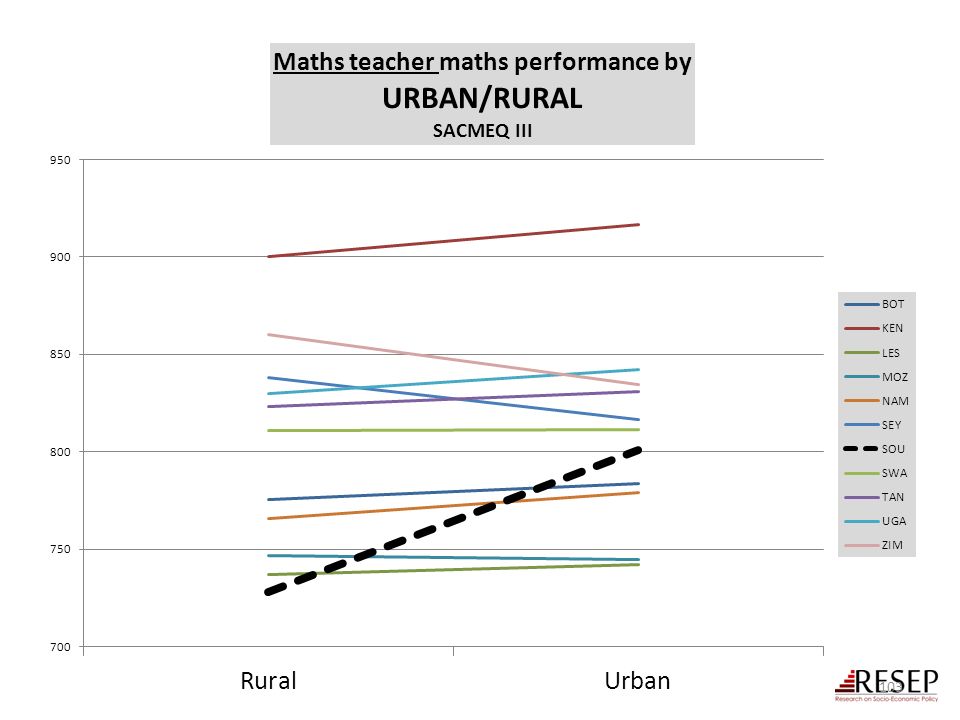
Accountability: teacher absenteeism (SACMEQ III – 2007 – 996 teachers)
Absenteeism here is average between both maths and reading teachers

47
Accountability: teacher absenteeism (SACMEQ III – 2007 – 996 teachers)
4th/15 Absenteeism here is average between both maths and reading teachers

48
Accountability: teacher absenteeism (SACMEQ III – 2007 – 996 teachers)
Yes, BUT…2007 was a bad year 15th/15 Absenteeism here is average between both maths and reading teachers

49
Accountability: teacher absenteeism
Teacher absenteeism is regularly found to be an issue in many studies 2007: SACMEQ III conducted – 20 days average in 2007 (Spaull, 2011) 2008: Khulisa Consortium audit – HSRC (2010) estimates that days of regular instructional time were lost due to leave in 2008 2010: “An estimated 20 teaching days per teacher were lost during the 2010 teachers’ strike” (DBE, 2011: 18) Importantly this does not include time lost where teachers were at school but not teaching scheduled lessons A recent study observing 58 schools in the North West concluded that “Teachers did not teach 60% of the lessos they were scheduled to teach in North West” (Carnoy & Chisholm et al, 2012) Also see Chisholm (2005) and Shisana et al (2005) quoted in HSRC (2010)
 2008: Khulisa Consortium audit – HSRC (2010) estimates that days of regular instructional time were lost due to leave in : An estimated 20 teaching days per teacher were lost during the 2010 teachers’ strike (DBE, 2011: 18) Importantly this does not include time lost where teachers were at school but not teaching scheduled lessons. A recent study observing 58 schools in the North West concluded that Teachers did not teach 60% of the lessos they were scheduled to teach in North West (Carnoy & Chisholm et al, 2012) Also see Chisholm (2005) and Shisana et al (2005) quoted in HSRC (2010)")
50
Accountability: teacher absenteeism (SACMEQ III – 2007 – 996 teachers)
Western Cape Eastern Cape Limpopo KwaZulu-Natal % absent > 1 week striking 32% 81% 97% 82% Given that SACMEQ was done in September 2007, a maximum of 159 school days could have passed, hence 3 months = 1.3 days a week % absent > 1 month (20 days) 22% 62% 48% 73% % absent > 2 months (40 days) 12% 0% 10% 5% 1.3 days a week
 22% 62% 48% 73% % absent > 2 months (40 days) 12% 0% 10% 5% 1.3 days a week.")
51
Teacher absenteeism SACMEQ III (2007)
What is the distribution of teacher absenteeism across school SES quintiles?

52
By Gr 3 all children should be able to read, Gr 4 children should be transitioning from “learning to read” to “reading to learn” Red sections here show the proportion of children that are completely illiterate in Grade 4 , i.e. they cannot read in any language If we consider the performance of the learners per test language, the following observations are made: Overall 29% of learners in SA don’t meet the low benchmark However, in Afrikaans and English, there are only 12 and 10% who do not meet the low benchmark Of serious concern is that more than half the learners tested in Sepedi and Tshivenda do not reach the low benchmark putting them at risk educationally. More than 15% of learners in Afrikaans and English reach the advanced level in contrast to less than 1% in African languages.

53
Figure 2: Average Grade Eight mathematics test scores for middle-income countries participating in TIMSS 2011 (+95% confidence intervals around the mean) TIMSS Maths (2011)
")
54
How do SA’s wealthiest 20% of school perform?
RE Max DuPreez’s comments yesterday that our Model-C schools are “good”, even by international stds Important to remember size of SA schooling system (25,000 schools, the top 2% =500 schools!) Top 1% probably, not top 15% Graph via Stephen Taylor (TIMSS 2003)
 Top 1% probably, not top 15% Graph via Stephen Taylor (TIMSS 2003)")
56
Dropout between Gr8 and Gr12
Of 100 Gr8 quintile 1 students in 2009, 36 passed matric and 10 qualified for university Of 100 Gr8 quintile 5 students in 2009, 68 passed matric and 39 qualified for university “Contrary to what some would like the nation and the public to believe that our results hide inequalities, the facts and evidence show that the two top provinces (Free State and North West) are rural and poor.” (Motshekga, 2014)
 are rural and poor. (Motshekga, 2014)")
57
Qualifications by age (birth cohort), 2011 (Van der Berg, 2013)
, 2011 (Van der Berg, 2013)")
58
Links between education & the labour-market
Intervening in the labour-market (BBBEE) is too late Need to do this but MORE focus on (pre) school. Social grants important to reduce abject poverty but cannot change inequality much Wages account for 80% of total inequality Unless you can increase the wages of black labour-market entrants cannot change structure of SA income distribution (4) not possible without improving quality of education.
 is too late. Need to do this but MORE focus on (pre) school. Social grants important to reduce abject poverty but cannot change inequality much. Wages account for 80% of total inequality. Unless you can increase the wages of black labour-market entrants cannot change structure of SA income distribution. (4) not possible without improving quality of education.")
59
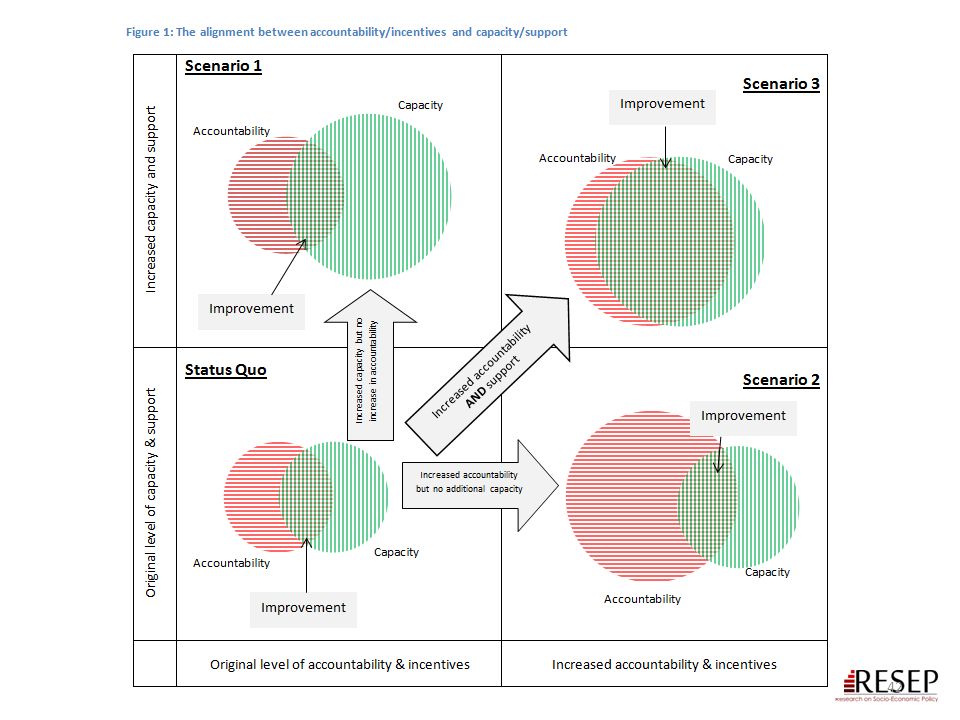
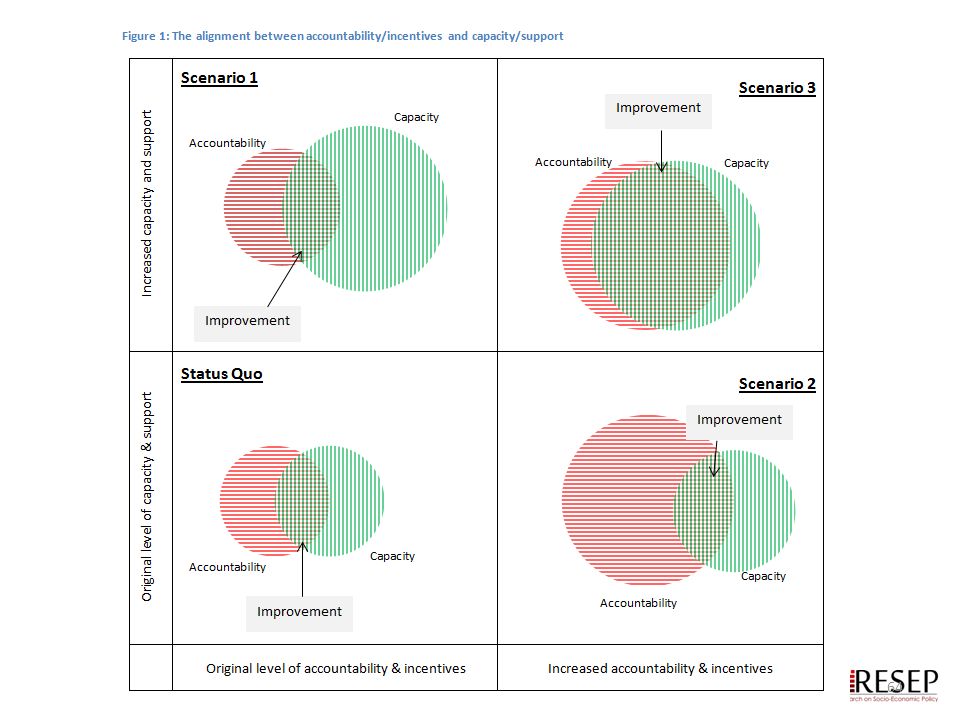
Accountability AND Capacity
SOLUTION? Accountability AND Capacity

60
From: http://ijr.org.za/publications/pdfs/TA%202013%20text%20and%20cover%20web.pdf

66
“Only when schools have both the incentive to respond to an accountability system as well as the capacity to do so will there be an improvement in student outcomes.” (p22)
67
There are signs of hope…
The DBE has begun to focus on the basics CAPS curriculum Workbooks (numeracy and literacy) ANAs (not without problems) Some improvement in Gr9 student outcomes between TIMSS 2003 and TIMSS 2011 1.5 Grade levels (but post-improvement still exceedingly low)
 ANAs (not without problems) Some improvement in Gr9 student outcomes between TIMSS 2003 and TIMSS Grade levels (but post-improvement still exceedingly low)")
68
Way forward? Acknowledge the extent of the problem Focus on the basics
Low quality education is one of the three largest crises facing our country (along with HIV/AIDS and unemployment). Need the political will and public support for widespread reform. Focus on the basics Every child MUST master the basics of foundational numeracy and literacy these are the building blocks of further education – weak foundations = recipe for disaster. Read by 10 goal! Teachers need to be in school teaching (re-introduce inspectorate?) Every teacher needs a minimum competency (basic) in the subjects they teach Every child (teacher) needs access to adequate learning (teaching) materials Use every school day and every school period – maximise instructional time Have to make sure we don’t make the same mistakes with Grade R as we have with the rest of schooling Increase information, accountability & transparency At ALL levels – DBE, district, school, classroom, learner Strengthen ANA. Get psychometrics right (so comparable across years), externally 1 grade Set realistic goals for improvement and hold people accountable Focus on teachers Have to find a way of raising the quality of both (1) new, but especially (2) existing teachers Q&A - Prof Muller (UCT): What do you think is the most under-researched area in South African education? “We have no idea what it will take to make knowledgeable teachers out of clueless ones, at least not while they are actually on-the-job.”
. Need the political will and public support for widespread reform. Focus on the basics. Every child MUST master the basics of foundational numeracy and literacy these are the building blocks of further education – weak foundations = recipe for disaster. Read by 10 goal! Teachers need to be in school teaching (re-introduce inspectorate ) Every teacher needs a minimum competency (basic) in the subjects they teach. Every child (teacher) needs access to adequate learning (teaching) materials. Use every school day and every school period – maximise instructional time. Have to make sure we don’t make the same mistakes with Grade R as we have with the rest of schooling. Increase information, accountability & transparency. At ALL levels – DBE, district, school, classroom, learner. Strengthen ANA. Get psychometrics right (so comparable across years), externally 1 grade. Set realistic goals for improvement and hold people accountable. Focus on teachers. Have to find a way of raising the quality of both (1) new, but especially (2) existing teachers. Q&A - Prof Muller (UCT): What do you think is the most under-researched area in South African education We have no idea what it will take to make knowledgeable teachers out of clueless ones, at least not while they are actually on-the-job.")
69
5 “Take-Home” points Many things we have not discussed – Grade-R/ECD, teacher unions and politics, civil service capacity constraints, LOLT, teacher training (in- and pre-), RCTs, resources, etc. South Africa performs extremely poorly on local and international assessments of educational achievement. In SA we have two public schooling systems not one. Teacher content knowledge in South Africa is extremely low In large parts of the schooling system there is very little learning taking place. Strategies for improvement need to focus on 1) accountability, 2) capacity, 3) alignment. Low quality education Low social mobility Hereditary poverty
, RCTs, resources, etc. South Africa performs extremely poorly on local and international assessments of educational achievement. In SA we have two public schooling systems not one. Teacher content knowledge in South Africa is extremely low. In large parts of the schooling system there is very little learning taking place. Strategies for improvement need to focus on 1) accountability, 2) capacity, 3) alignment. Low quality education. Low social mobility. Hereditary poverty.")
70
Further issues we can discuss
Solution: Identifying binding constraints Grade R in SA – not more of the same Resources New and existing RESEP projects What proportion of SA kids make it to uni? What can businesses do to help? Warm-glow effect or turning the ship?

71
Thank you Comments & Questions
Thank you Comments & Questions? This presentation and papers available online at:

72
References & further reading
For work on poverty and inequality – SALDRU/RESEP websites & working papers good start. Fiske, E., & Ladd, H. (2004). Elusive Equity: Education Reform in Post-apartheid South Africa. Washington: Brookings Institution Press / HSRC Press. Fleisch, B. (2008). Primary Education in Crisis: Why South African schoolchildren underachieve in reading and mathematics. Cape Town. : Juta & Co. Donalson, A. (1992). Content, Quality and Flexibility: The Economics of Education System Change. Spotlight 5/92. Johannesburg: South African Institute of Race Relations. Taylor, S., & Yu, D. (2009). The Importance of Socioeconomic Status in Determining Educational Achievement in South Africa. Stellenbosch Economic Working Papers. Van der Berg, S., Burger, C., Burger, R., de Vos, M., du Rand, G., Gustafsson, M., Shepherd, D., Spaull, N., Taylor, S., van Broekhuizen, H., and von Fintel, D. (2011). Low quality education as a poverty trap. Stellenbosch: University of Stellenbosch, Department of Economics. Research report for the PSPPD project for Presidency. Spaull, N Poverty & Privilege: Primary School Inequality in South Africa. International Journal of Educational Development. 33 (2013) pp (WP here) Spaull, N South Africa’s Education Crisis: The Quality of Education in South Africa Centre for Development and Enterprise.
. Elusive Equity: Education Reform in Post-apartheid South Africa. Washington: Brookings Institution Press / HSRC Press. Fleisch, B. (2008). Primary Education in Crisis: Why South African schoolchildren underachieve in reading and mathematics. Cape Town. : Juta & Co. Donalson, A. (1992). Content, Quality and Flexibility: The Economics of Education System Change. Spotlight 5/92. Johannesburg: South African Institute of Race Relations. Taylor, S., & Yu, D. (2009). The Importance of Socioeconomic Status in Determining Educational Achievement in South Africa. Stellenbosch Economic Working Papers. Van der Berg, S., Burger, C., Burger, R., de Vos, M., du Rand, G., Gustafsson, M., Shepherd, D., Spaull, N., Taylor, S., van Broekhuizen, H., and von Fintel, D. (2011). Low quality education as a poverty trap. Stellenbosch: University of Stellenbosch, Department of Economics. Research report for the PSPPD project for Presidency. Spaull, N Poverty & Privilege: Primary School Inequality in South Africa. International Journal of Educational Development. 33 (2013) pp (WP here) Spaull, N South Africa’s Education Crisis: The Quality of Education in South Africa Centre for Development and Enterprise.")
73
Current concerns of DBE
(according to me) Teacher content knowledge - Extremely low - Politically sensitive given strength of teacher unions -Testing & training?! Grade R & ECD - Funding: Current exp on Grade R pupil (R3K) 1/3 of ordinary school child (R10K) -Training/qualifications and $ of ECD teachers? Min Norms/Stds - Eradicating infrastructure backlogs & providing basics (and then non-basics) - Legal implications of MN&S (provinces held to acc) Teacher Salaries – Make up 80% of Educ Exp ating infrastructure backlogs FP Numeracy & literacy and ANAS - Ensuring they are comparable across years - Using them to raise numeracy & literacy outcomes - Elections & Relations with teacher unions - Teacher unions (esp SADTU) wield considerable power) -Appointments (DBE/district/principal/teacher) politicised, competence not primary concern -Over/under supply in certain schools (esp ECA) Post-provisioning -limiting the salary bill - Ghost teachers
 Teacher content knowledge. - Extremely low. - Politically sensitive given strength of teacher unions. -Testing & training ! Grade R & ECD. - Funding: Current exp on Grade R pupil (R3K) 1/3 of ordinary school child (R10K) -Training/qualifications and $ of ECD teachers Min Norms/Stds. - Eradicating infrastructure backlogs & providing basics (and then non-basics) - Legal implications of MN&S (provinces held to acc) Teacher Salaries. – Make up 80% of Educ Exp ating infrastructure backlogs. FP Numeracy & literacy and ANAS. - Ensuring they are comparable across years. - Using them to raise numeracy & literacy outcomes. - Elections & Relations with teacher unions. - Teacher unions (esp SADTU) wield considerable power) -Appointments (DBE/district/principal/teacher) politicised, competence not primary concern. -Over/under supply in certain schools (esp ECA) Post-provisioning. -limiting the salary bill. - Ghost teachers.")
74
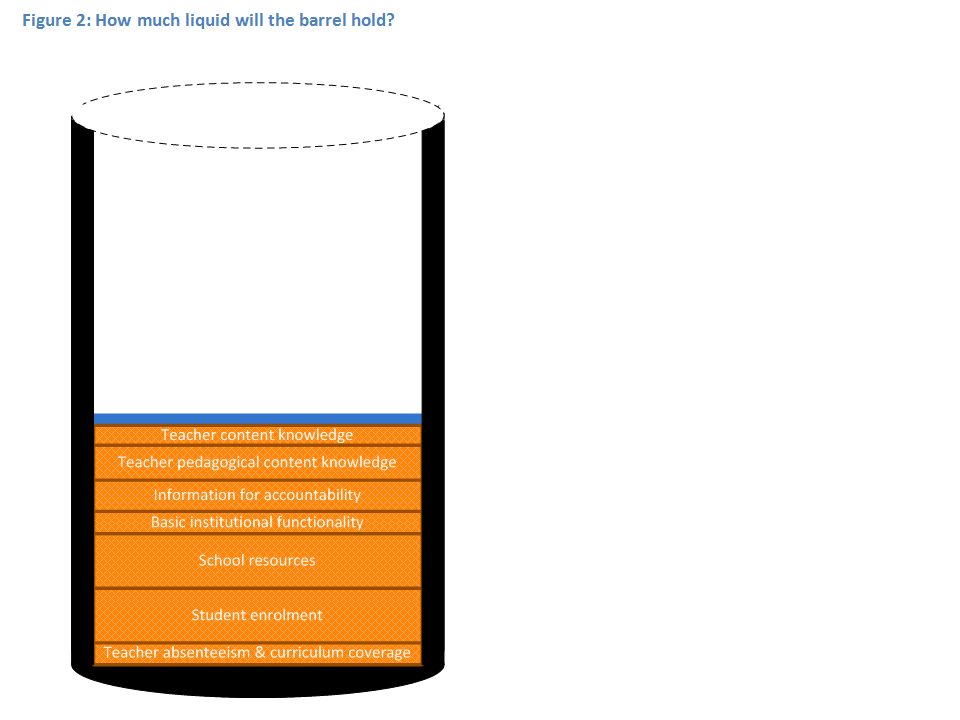
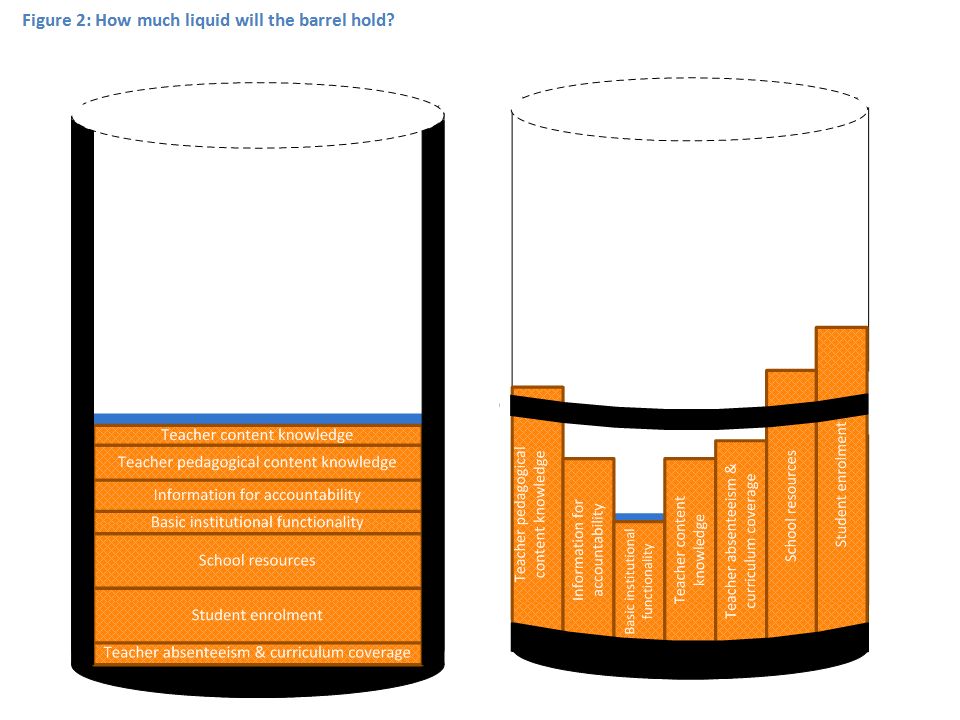
Binding constraints approach

78
“The left hand barrel has horizontal wooden slabs, while the right hand side barrel has vertical slabs. The volume in the first barrel depends on the sum of the width of all slabs. Increasing the width of any slab will increase the volume of the barrel. So a strategy on improving anything you can, when you can, while you can, would be effective. The volume in the second barrel is determined by the length of the shortest slab. Two implications of the second barrel are that the impact of a change in a slab on the volume of the barrel depends on whether it is the binding constraint or not. If not, the impact is zero. If it is the binding constraint, the impact will depend on the distance between the shortest slab and the next shortest slab” (Hausmann, Klinger, & Wagner, 2008, p. 17). Hausmann, R., Klinger, G., & Wagner, R. (2008). Doing Growth Diagnostics in Practice: A 'Mindbook'. CID Workinf Paper No Center for International Development at Harvard University.
. Doing Growth Diagnostics in Practice: A Mindbook . CID Workinf Paper No Center for International Development at Harvard University.")
79
Grade R/ECD issues needing to be fleshed out?
Qualitatively/practically, when is enrolment considered “Grade R” and when just child-minding? Where should Grade R teachers be trained? Universities? More of the same? FET colleges? Quality problems? Status? Practically, how does one monitor quality of ECD? What instruments? What surveys? What should Grade R teachers be paid? Teacher salaries (and class sizes) obviously major cost-drivers
 obviously major cost-drivers.")
81
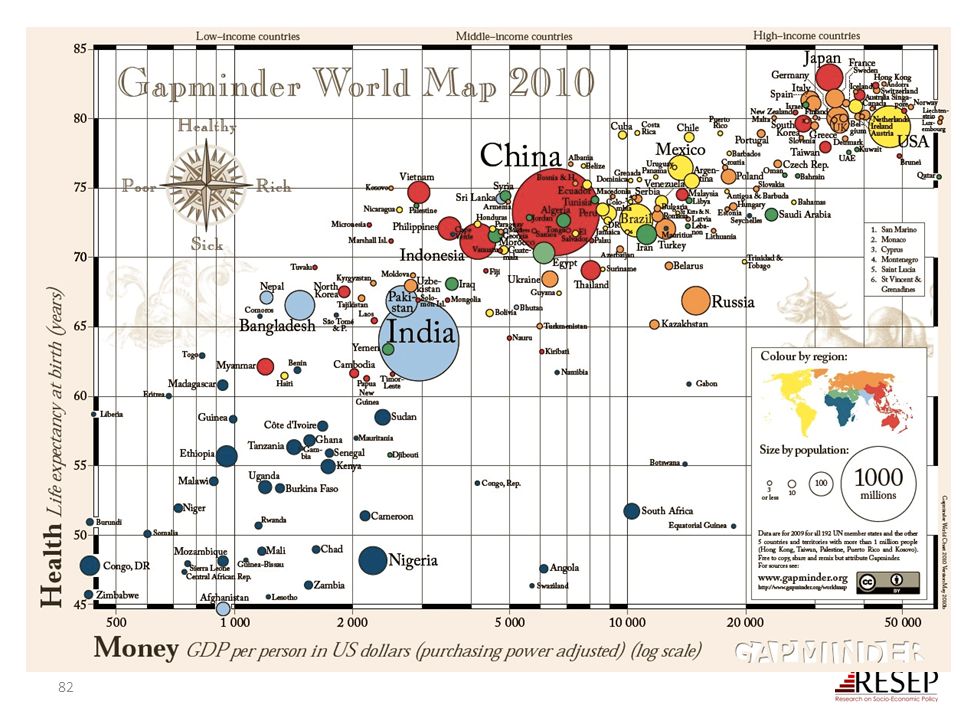
Size of South African economy/population

83
Geographic distribution of poverty

84
Sources of deprivation?

85
$ Benefits of education Economy Health Society Ed H S Ec
Improved human rights Empowerment of women Reduced societal violence Promotion of a national (as opposed to regional or ethnic) identity Increased social cohesion Lower fertility Improved child health Preventative health care Demographic transition Improvements in productivity Economic growth Reduction of inter-generational cycles of poverty Reductions in inequality $ Economy Health Society Specific references: lower fertility (Glewwe, 2002), improved child health (Currie, 2009), reduced societal violence (Salmi, 2006), promotion of a national - as opposed to a regional or ethnic - identity (Glewwe, 2002), improved human rights (Salmi, 2006), increased social cohesion (Heyneman, 2003), Economic growth – see any decent Macro textbook, specifically for cognitive skills see (Hanushek & Woessman 2008)
 identity. Increased social cohesion. Lower fertility. Improved child health. Preventative health care. Demographic transition. Improvements in productivity. Economic growth. Reduction of inter-generational cycles of poverty. Reductions in inequality. $ Economy. Health. Society. Specific references: lower fertility (Glewwe, 2002), improved child health (Currie, 2009), reduced societal violence (Salmi, 2006), promotion of a national - as opposed to a regional or ethnic - identity (Glewwe, 2002), improved human rights (Salmi, 2006), increased social cohesion (Heyneman, 2003), Economic growth – see any decent Macro textbook, specifically for cognitive skills see (Hanushek & Woessman 2008)")
86
Possible solution… The DBE cannot afford to be idealistic in its implementation of teacher training and testing Aspirational planning approach: All primary school mathematics teachers should be able to pass the matric mathematics exam (benchmark = desirable teacher CK) Realistic approach: (e.g.) minimum proficiency benchmark where teachers have to achieve at least 90% in the ANA of the grades in which they teach, and 70% in Grade 9 ANA (benchmark = basic teacher CK) First we need to figure out what works! Pilot the system with one district. Imperative to evaluate which teacher training option (of hundreds) works best in urban/rural for example. Rigorous impact evaluations are needed before selecting a program and then rolling it out Tests are primarily for diagnostic purposes not punitive purposes Implement a nation-wide system of minimum-proficiency diagnostic teacher testing and capacitation for numeracy and literacy starting with the Foundation Phase. “The existing body of evidence suggests that a large proportion of South African teachers have below-basic content knowledge in the subjects that they teach – largely as a result of inadequate apartheid-era teacher training and the ineffectiveness of in-service teacher training initiatives. In light of this, and following the premise that teachers cannot teach what they do not know, it is a logical imperative that a system of identifying which teachers need what help is urgently required. Given the current state of teacher content knowledge in poor and rural schools, the Department cannot afford to be idealistic in its implementation of this system of teacher testing and training. Rather than ascribing to the aspirational planning approach that has become characteristic of South African policy - where one might set an impractically high benchmark for desirable teacher content knowledge - one should first aim to ensure that every teacher in the system has the basic content knowledge required to cover the curriculum that they currently teach. For example, rather than decreeing that every primary school mathematics teacher should be able to pass the matric mathematics exam, it would be far more realistic to take an incremental approach and set the minimum-proficiency benchmark at a 70% mark on the grade nine annual national assessment, combined with at least a 90% mark in the ANA of the grade which they are currently teaching. If a grade six mathematics teacher cannot achieve 70% on the grade nine ANA for mathematics, and achieve 90% for the grade six mathematics ANA, one can say that they do not currently possess the requisite content knowledge to teach grade six mathematics. As a matter of urgency, they should be required to undergo minimum-proficiency teacher training for the subjects which they teach and then re-assessed at the end of the training. Before trying to get every teacher to a desirable level, first ensure that all teachers have the basic content knowledge in the subjects that they teach. Given the logistics involved with implementing a testing and training operation of this scale, it is advisable to pilot the system with one district and then to roll out the system nationally in a progressive way. For example the Department could start with Foundation Phase (FP) mathematics teachers in a particular district and require all FP maths teachers to register and write the minimum proficiency test within six months. Teachers who do not meet the minimum-proficiency benchmark for the subjects that they teach should be given six months to complete the minimum-proficiency training which should be free of charge and accessible. Importantly, the training provided should be dignified, highly practical, structured and sequenced, with formative testing built into each module to assess whether or not the teacher has acquired the necessary knowledge and skills. In order to get teacher and union buy in, it will need to be made explicit that these tests are primarily for diagnostic rather than punitive purposes. Through a variety of mechanisms (such as contracts and confidentiality clauses) it is possible to reassure all parties involved that these tests are truly developmental in nature. The ultimate aim of such a system should not be to vilify and demean teachers and the teaching profession, but to increase the capacity and dignity of teachers. Elmore (2004b, p. 93) provides a useful description of the interplay between accountability and capacitation: “For every increment of performance I demand from you, I have an equal responsibility to provide you with the capacity to meet that expectation. Likewise, for every investment you make in my skill and knowledge, I have a reciprocal responsibility to demonstrate some new increment in performance.” Spaull 2013 CDE Report
 Realistic approach: (e.g.) minimum proficiency benchmark where teachers have to achieve at least 90% in the ANA of the grades in which they teach, and 70% in Grade 9 ANA. (benchmark = basic teacher CK) First we need to figure out what works! Pilot the system with one district. Imperative to evaluate which teacher training option (of hundreds) works best in urban/rural for example. Rigorous impact evaluations are needed before selecting a program and then rolling it out. Tests are primarily for diagnostic purposes not punitive purposes. Implement a nation-wide system of minimum-proficiency diagnostic teacher testing and capacitation for numeracy and literacy starting with the Foundation Phase. The existing body of evidence suggests that a large proportion of South African teachers have below-basic content knowledge in the subjects that they teach – largely as a result of inadequate apartheid-era teacher training and the ineffectiveness of in-service teacher training initiatives. In light of this, and following the premise that teachers cannot teach what they do not know, it is a logical imperative that a system of identifying which teachers need what help is urgently required. Given the current state of teacher content knowledge in poor and rural schools, the Department cannot afford to be idealistic in its implementation of this system of teacher testing and training. Rather than ascribing to the aspirational planning approach that has become characteristic of South African policy - where one might set an impractically high benchmark for desirable teacher content knowledge - one should first aim to ensure that every teacher in the system has the basic content knowledge required to cover the curriculum that they currently teach. For example, rather than decreeing that every primary school mathematics teacher should be able to pass the matric mathematics exam, it would be far more realistic to take an incremental approach and set the minimum-proficiency benchmark at a 70% mark on the grade nine annual national assessment, combined with at least a 90% mark in the ANA of the grade which they are currently teaching. If a grade six mathematics teacher cannot achieve 70% on the grade nine ANA for mathematics, and achieve 90% for the grade six mathematics ANA, one can say that they do not currently possess the requisite content knowledge to teach grade six mathematics. As a matter of urgency, they should be required to undergo minimum-proficiency teacher training for the subjects which they teach and then re-assessed at the end of the training. Before trying to get every teacher to a desirable level, first ensure that all teachers have the basic content knowledge in the subjects that they teach. Given the logistics involved with implementing a testing and training operation of this scale, it is advisable to pilot the system with one district and then to roll out the system nationally in a progressive way. For example the Department could start with Foundation Phase (FP) mathematics teachers in a particular district and require all FP maths teachers to register and write the minimum proficiency test within six months. Teachers who do not meet the minimum-proficiency benchmark for the subjects that they teach should be given six months to complete the minimum-proficiency training which should be free of charge and accessible. Importantly, the training provided should be dignified, highly practical, structured and sequenced, with formative testing built into each module to assess whether or not the teacher has acquired the necessary knowledge and skills. In order to get teacher and union buy in, it will need to be made explicit that these tests are primarily for diagnostic rather than punitive purposes. Through a variety of mechanisms (such as contracts and confidentiality clauses) it is possible to reassure all parties involved that these tests are truly developmental in nature. The ultimate aim of such a system should not be to vilify and demean teachers and the teaching profession, but to increase the capacity and dignity of teachers. Elmore (2004b, p. 93) provides a useful description of the interplay between accountability and capacitation: For every increment of performance I demand from you, I have an equal responsibility to provide you with the capacity to meet that expectation. Likewise, for every investment you make in my skill and knowledge, I have a reciprocal responsibility to demonstrate some new increment in performance. Spaull 2013 CDE Report.")
87
Accountability stages...
SA is a few decades behind many OECD countries. Predictable outcomes as we move from stage to stage. Loveless (2005: 7) explains the historical sequence of accountability movements for students – similar movements for teachers? Stage 1 – Setting standards (defining what students should learn), CAPS Stage 2 - Measuring achievement (testing to see what students have learned), ANA Stage 3 - Holding educators & students accountable (making results count). Western Cape performance agreements? Stages in accountability movements: 3) Holding accountable 2) Measuring achievement 1) Setting standards TRAINING “For every increment of performance I demand from you, I have an equal responsibility to provide you with the capacity to meet that expectation. Likewise, for every investment you make in my skill and knowledge, I have a reciprocal responsibility to demonstrate some new increment in performance” (Elmore, 2004b, p. 93).
 explains the historical sequence of accountability movements for students – similar movements for teachers Stage 1 – Setting standards. (defining what students should learn), CAPS. Stage 2 - Measuring achievement. (testing to see what students have learned), ANA. Stage 3 - Holding educators & students accountable. (making results count). Western Cape performance agreements Stages in accountability movements: 3) Holding accountable. 2) Measuring achievement. 1) Setting standards. TRAINING. For every increment of performance I demand from you, I have an equal responsibility to provide you with the capacity to meet that expectation. Likewise, for every investment you make in my skill and knowledge, I have a reciprocal responsibility to demonstrate some new increment in performance (Elmore, 2004b, p. 93).")
88
What are the root causes of low and unequal achievement?
Matric pass rate Subject choice Throughput No. endorsements Media sees only this MATRIC Quality? What are the root causes of low and unequal achievement? Pre-MATRIC 50% dropout Low curric coverage Vested interests Weak culture of T&L Low accountability Low time-on-task No early cognitive stimulation Low quality teachers HUGE learning deficits…

89
Basic overview of matric 2013
The good… Matric pass rate increased to 78% Bachelor pass rate increased to 31% More students passing mathematics The bad… Some questioning quality of matric pass Public starting to ask questions about why uni’s are using NBTs Concerns over “culling” and whether this lead to increases in NWP and FST The ugly… Grade 812 dropout is 2x as high (50%) in Q1 rel to Q5 (25%) Because of differences in average quality of education, a white child is 7 times more likely than a black child to obtain a Maths D+ and 38 times as likely to get an A- aggregate (using earlier matric data)
 in Q1 rel to Q5 (25%) Because of differences in average quality of education, a white child is 7 times more likely than a black child to obtain a Maths D+ and 38 times as likely to get an A- aggregate (using earlier matric data)")
90
Focus on mathematics – things are improving
Number of students taking mathematics (as opposed to maths-lit) has declined since 2008, but proportion passing has risen Not necessarily a bad thing since many of those students shouldn’t have been taking mathematics in the first place Source: Taylor (2014)
 has declined since 2008, but proportion passing has risen. Not necessarily a bad thing since many of those students shouldn’t have been taking mathematics in the first place. Source: Taylor (2014)")
91
What proportion of matrics take and pass mathematics?
Important statistic is the number passing which was declining from 2008 2011 but has increased between 2011 2013 Source: Taylor (2014)
")
92
Matric mathematics statistics (Taylor 2014)
Numbers wrote maths Number passed maths Maths pass rate Proportion taking maths Proportion passing maths 2008 298821 136503 45.70% 56.10% 25.60% 2009 290407 133505 46.00% 52.60% 24.20% 2010 263034 124749 47.40% 48.80% 23.20% 2011 224635 104033 46.30% 45.30% 21.00% 2012 225874 121970 54.00% 44.19% 23.86% 2013 241509 142666 59.10% 42.96% 25.38% Source: Taylor (2014) NOTE: All of the above is under the proviso that that quality of the mathematics exam has remained constant over the period. If not then we can’t say much.
 NOTE: All of the above is under the proviso that that quality of the mathematics exam has remained constant over the period. If not then we can’t say much.")
93
Are things improving? What should we be using to measure changes over time? DEFINITELY *NOT* ANAs Not psychometrically calibrated to be comparable year-on-year No anchor items No Item Response Theory Not externally evaluated and independently marked No, no, no. Need a broader discussion of the potential perils of ANAs. Under-appreciated at the moment. ANA Fridays?! Matric – sort of yes Considerable institutional memory (decades of expertise and precedent) Excludes half the cohort so not a good reflection of total education system Can be tricky to tease out *real* trends. Things like subject combinations, culling, pass thresholds and clumping around the threshold etc. Cross-national assessments – yes. Best way of determining if there are changes over long periods of tims TIMSS, PIRLS/prePIRLS/SACMEQ/ (perhaps PISA in SA soon) Education and schooling (the main vehicle we use to “do/get it”) cannot be reduced to test scores or particular subjects (numeracy and literacy). However, that does *NOT* mean that there is no place for testing. Many educational outcomes are measurable and providing feedback to everyone (DBE, principals, parents, students) is an important form of accountability.
 Excludes half the cohort so not a good reflection of total education system. Can be tricky to tease out *real* trends. Things like subject combinations, culling, pass thresholds and clumping around the threshold etc. Cross-national assessments – yes. Best way of determining if there are changes over long periods of tims. TIMSS, PIRLS/prePIRLS/SACMEQ/ (perhaps PISA in SA soon) Education and schooling (the main vehicle we use to do/get it ) cannot be reduced to test scores or particular subjects (numeracy and literacy). However, that does *NOT* mean that there is no place for testing. Many educational outcomes are measurable and providing feedback to everyone (DBE, principals, parents, students) is an important form of accountability.")
94
Higher education in perspective
When speaking about higher education it’s important to remember that this is only a very small proportion of the population Source: DBE (2013) Internal Efficiency of the schooling System
 Internal Efficiency of the schooling System")
95
Gustafsson, 2011 – When & how WP
“What do the magnitudes from Figure 4 mean in terms of the holding of qualifications? In particular, what widely recognised qualifications do the 60% of youths who do not obtain a Matric hold? …Only around 1% of youths hold no Matric but do hold some other non-school certificate or diploma issued by, for instance, an FET college” (Gustafsson, 2011: p.11) 10%
 10%")
96
How does SA fair internationally?
Gustafsson (2011) “The when and how of leaving school”
 The when and how of leaving school")
97
TIMSS 1995 2011 Figure 1: South African mathematics and science performance in the Trends in International Mathematics and Science Study (TIMSS ) with 95% confidence intervals around the mean
 with 95% confidence intervals around the mean.")
98
Accountability: teacher absenteeism
Teacher absenteeism is regularly found to be an issue in many studies 2007: SACMEQ III conducted – 20 days average in 2007 2008: Khulisa Consortium audit – HSRC (2010) estimates that days of regular instructional time were lost due to leave in 2008 2010: “An estimated 20 teaching days per teacher were lost during the 2010 teachers’ strike” (DBE, 2011: 18) Importantly this does not include time lost where teachers were at school but not teaching scheduled lessons A recent study observing 58 schools in the North West concluded that “Teachers did not teach 60% of the lessos they were scheduled to teach in North West” (Carnoy & Chisholm et al, 2012) Also see Chisholm (2005) and Shisana et al (2005) quoted in HSRC (2010)
 estimates that days of regular instructional time were lost due to leave in : An estimated 20 teaching days per teacher were lost during the 2010 teachers’ strike (DBE, 2011: 18) Importantly this does not include time lost where teachers were at school but not teaching scheduled lessons. A recent study observing 58 schools in the North West concluded that Teachers did not teach 60% of the lessos they were scheduled to teach in North West (Carnoy & Chisholm et al, 2012) Also see Chisholm (2005) and Shisana et al (2005) quoted in HSRC (2010)")
99
2 education systems Dysfunctional Schools (75% of schools)
Weak accountability Strong accountability Incompetent school management Good school management Lack of culture of learning, discipline and order Culture of learning, discipline and order Inadequate LTSM Adequate LTSM Weak teacher content knowledge Adequate teacher content knowledge High teacher absenteeism (1 month/yr) Low teacher absenteeism (2 week/yr) Slow curriculum coverage, little homework or testing Covers the curriculum, weekly homework, frequent testing High repetition & dropout (Gr10-12) Low repetition & dropout (Gr10-12) Extremely weak learning: most students fail standardised tests Adequate learner performance (primary and matric)
 Low teacher absenteeism (2 week/yr) Slow curriculum coverage, little homework or testing. Covers the curriculum, weekly homework, frequent testing. High repetition & dropout (Gr10-12) Low repetition & dropout (Gr10-12) Extremely weak learning: most students fail standardised tests. Adequate learner performance (primary and matric)")
100
Implications for reporting and modeling??

Similar presentations


 Assessment and the Curriculum for Excellence: Fife’s perspective Stuart Booker Statistician.>")
 Primary Education Year Three School Based Training Briefing 2014-2015.>")


 Nicholas Spaull nicspaull.com/research>")


 Nicholas Spaull nicspaull.com/research 30 th AEAA Conference.>")
