Download presentation
Presentation is loading. Please wait.

1
Tutorial I: Missing Value Analysis
Pekka Malo 30E00500 – Quantitative Empirical Research Spring 2016

2
Step 1: Type of Missing Data
Go to Step 2 Missing Value Analysis

3
Step 2: Extent of Missing Data
Go to Step 3 Go to Step 4 Missing Value Analysis

4
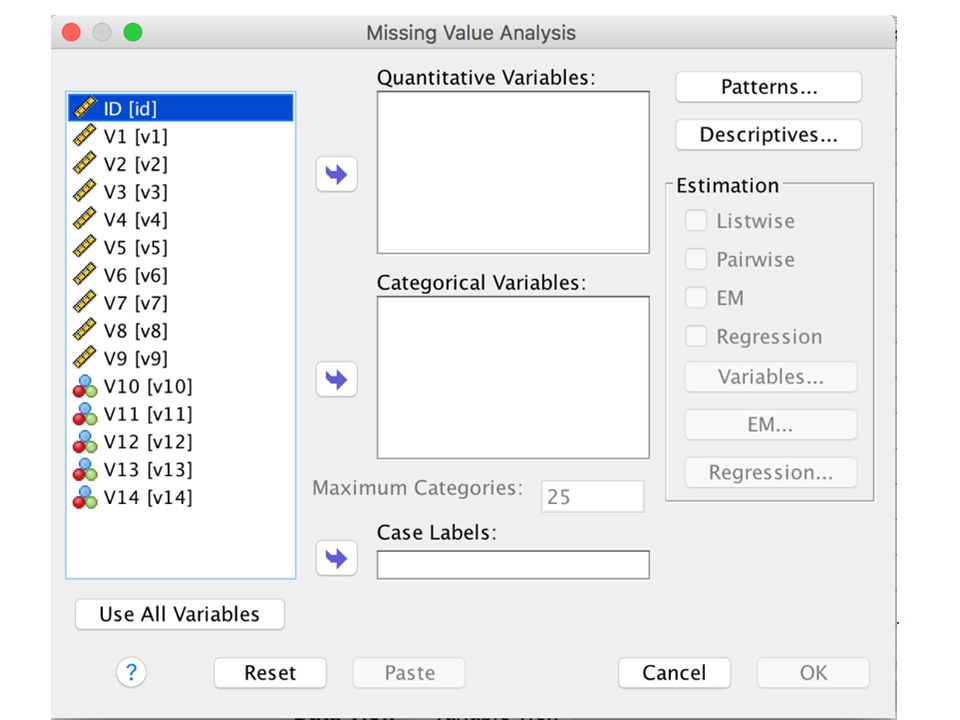
Missing Value Analysis –procedure in SPSS
5
Missing Value Analysis
6
Univariate statistics
Output: Univariate statistics Check for variables with large amount of missingness to identify candidates for deletion Missing Value Analysis

7
Display patterns over cases
Output: “Tabulated patterns” Output: “Missing patterns” Missing Value Analysis

8
Output: Tabulated patterns
Represents the generality (number of cases) with each missing data pattern Maybe helpful when deciding if variables would need to be removed Output: Missing patterns Examine the amount of missing data per case Beware for cases with large percent of missing data (e.g., cases with 50% are candidates for deletion) Missing Value Analysis
 with each missing data pattern. Maybe helpful when deciding if variables would need to be removed. Output: Missing patterns. Examine the amount of missing data per case. Beware for cases with large percent of missing data (e.g., cases with 50% are candidates for deletion) Missing Value Analysis")
9
To delete or not to delete?
Should we delete variables? Should we delete cases? Watch out for inadequate sample size needed for multivariate analysis later Missing Value Analysis

10
Step 3: Diagnosing the process
MCAR = missing completely at random The distribution of missing data is unpredictable (i.e. the cases with missing data are indistinguishable from cases with complete data) MAR = missing at random (a.k.a. ignorable non- response) The pattern is predictable from other variables in the data MNAR = missing not at random or non-ignorable The pattern is related to the dependent variable and cannot be ignored MCAR (The Good) MAR (The Bad) MNAR (The Ugly) Missing Value Analysis
 MAR = missing at random (a.k.a. ignorable non- response) The pattern is predictable from other variables in the data. MNAR = missing not at random or non-ignorable. The pattern is related to the dependent variable and cannot be ignored. MCAR (The Good) MAR (The Bad) MNAR (The Ugly) Missing Value Analysis")
11
Group comparisons of Observations with Missing vs. Valid Data
Output: “Separate variance t-tests” Missing Value Analysis

12
Separate-variance t tests
The separate-variance t tests table can help to identify variables whose pattern of missing values may be influencing the quantitative (scale) variables [starting point for remedies in case of non random pattern] The t test is computed for comparison of the means of the column variable across the groups formed between Group A (cases with valid data on row variable) Group B (cases with missing data on row variable) Objective is to identify any systematic missing data process that would be reflected in patterns of significant differences! Missing Value Analysis
 variables [starting point for remedies in case of non random pattern] The t test is computed for comparison of the means of the column variable across the groups formed between. Group A (cases with valid data on row variable) Group B (cases with missing data on row variable) Objective is to identify any systematic missing data process that would be reflected in patterns of significant differences! Missing Value Analysis")
13
Overall test for MCAR To get Little’s test for MCAR in SPSS, choose EM as estimation procedure H0: MCAR; H1: not MCAR Missing Value Analysis

14
Little’s Chi-square statistic
Roderick J. A. Little's chi-square statistic for testing whether values are missing completely at random (MCAR) is printed as a footnote to the EM matrices. For this test, the null hypothesis is that the data are missing completely at random, and the p value is significant at the 0.05 level. If the value is less than 0.05, the data are not missing completely at random. The data may be missing at random (MAR) or not missing at random (MNAR). You cannot assume one or the other and need to analyze the data to determine how the data are missing. Missing Value Analysis
 is printed as a footnote to the EM matrices. For this test, the null hypothesis is that the data are missing completely at random, and the p value is significant at the 0.05 level. If the value is less than 0.05, the data are not missing completely at random. The data may be missing at random (MAR) or not missing at random (MNAR). You cannot assume one or the other and need to analyze the data to determine how the data are missing. Missing Value Analysis")
15
Step 4: Choose Imputation Method
Missing Value Analysis

16
Choice of method should be based on
Type of missing data process (MCAR vs. others) Extent of missing data (should you use regression or EM or perhaps a model based approach) Note: imputed correlations can differ across techniques Compare estimates produced by different methods Presence of several acceptable methods also enables combining estimates to mitigate effects due to one specific method Missing Value Analysis
 Extent of missing data (should you use regression or EM or perhaps a model based approach) Note: imputed correlations can differ across techniques. Compare estimates produced by different methods. Presence of several acceptable methods also enables combining estimates to mitigate effects due to one specific method. Missing Value Analysis")
17
EM estimation EM is an iterative two-stage method in which
E stage: estimates expected values based on all complete data M stage: imputes the expected values from the E-step and then maximizes the likelihood function to obtain new parameter estimates Iterate until convergence Produces estimates that have only small amounts of bias for MAR and no bias for MCAR Missing Value Analysis

18
EM estimation options in SPSS
Distribution: Normal (default) Student’s t-distribution: use this if you assume longer tails Mixed normal: Enables longer tails Requires ratio of standard deviations and mixing proportion Means are assumed to be same! Maximum iterations may need to increased when convergence is not achieved Missing Value Analysis
 Student’s t-distribution: use this if you assume longer tails. Mixed normal: Enables longer tails. Requires ratio of standard deviations and mixing proportion. Means are assumed to be same! Maximum iterations may need to increased when convergence is not achieved. Missing Value Analysis")
19
Regression estimation
Estimates missing values using multiple linear regression: means, covariance matrix, and correlation matrix Estimation adjustment: add a random component to regression estimates: Residuals. Error terms are chosen randomly from the observed residuals of complete cases to be added to the regression estimates. Normal Variates. Error terms are randomly drawn from a distribution with the expected value 0 and the standard deviation equal to the square root of the mean squared error term of the regression. [Use this in case you have large number of missing values!] Student's t Variates. Error terms are randomly drawn from a t distribution with the specified degrees of freedom, and scaled by the root mean squared error (RMSE) Missing Value Analysis
 Missing Value Analysis")
20
Use Normal variates or Student’s t variates in case you have large number of missing values!
Missing Value Analysis

21
Compare outputs for consistency
Missing Value Analysis

22
Optional: Multiple Imputation
One of the most attractive general-purpose methods for handling missing data Basic idea by Rubin (1977): Impute missing values using an appropriate model (with random variation) Repeat imputation M times (usually 3-5) to obtain M complete datasets Perform the desired analysis on each dataset using standard complete data methods Average the values of the parameters across M samples to get a single point estimate Calculate standard errors by Averaging the squared standard errors of M estimates Calculating the variance of M parameter estimates across samples Combining (a) and (b) using an appropriate formula Missing Value Analysis
: Impute missing values using an appropriate model (with random variation) Repeat imputation M times (usually 3-5) to obtain M complete datasets. Perform the desired analysis on each dataset using standard complete data methods. Average the values of the parameters across M samples to get a single point estimate. Calculate standard errors by. Averaging the squared standard errors of M estimates. Calculating the variance of M parameter estimates across samples. Combining (a) and (b) using an appropriate formula. Missing Value Analysis")
23
Multiple Imputation (cont’d)
Source: Statistics and Data Analysis for Nursing Research, 2nd ed Missing Value Analysis

24
Multiple Imputation (cont’d)
Assumes MAR Model needs to be correct in “some sense” Repeated imputation allows good estimates of standard errors (addresses the uncertainty of a single estimate) Introducing appropriate random error into imputation leads to approximately unbiased estimates of all parameters; no deterministic method can do this in general settings Note by Schafer (1997): To get unbiased estimates in regression analysis, it is essential to use the dependent variable to impute values for missing data on predictor variables Missing Value Analysis
 Introducing appropriate random error into imputation leads to approximately unbiased estimates of all parameters; no deterministic method can do this in general settings. Note by Schafer (1997): To get unbiased estimates in regression analysis, it is essential to use the dependent variable to impute values for missing data on predictor variables. Missing Value Analysis")
25
Multiple Imputation in SPSS
Missing Value Analysis

26
Automatic method scans the data and uses the monotone method if the data show a monotone pattern of missing values; otherwise, fully conditional specification is used When the imputation method is chosen automatically, the imputation model for each variable includes a constant term and main effects for predictor variables. When choosing a specific method, you can optionally include all possible two-way interactions among categorical predictor variables Fully conditional specification. This is an iterative Markov chain Monte Carlo (MCMC) method that can be used when the pattern of missing data is arbitrary (monotone or non-monotone). For each iteration and for each variable in the order specified in the variable list, the fully conditional specification (FCS) method fits a univariate (single dependent variable) model using all other available variables in the model as predictors, then imputes missing values for the variable being fit. The method continues until the maximum number of iterations is reached, and the imputed values at the maximum iteration are saved to the imputed dataset. Missing Value Analysis
 method that can be used when the pattern of missing data is arbitrary (monotone or non-monotone). For each iteration and for each variable in the order specified in the variable list, the fully conditional specification (FCS) method fits a univariate (single dependent variable) model using all other available variables in the model as predictors, then imputes missing values for the variable being fit. The method continues until the maximum number of iterations is reached, and the imputed values at the maximum iteration are saved to the imputed dataset. Missing Value Analysis")
27
Multivariate analysis methods supporting MI
Methods in SPSS that support multiple imputation data are marked with special symbols Missing Value Analysis

28
Thank you!

Similar presentations


-the General Linear Model (GLM)>")


 R-squared statistic (10.4.1) Residual plots (11.2) Influential observations (11.3, 11.4.3.>")
>")


