Download presentation
Presentation is loading. Please wait.

1
Flexicurity in international comparison Flexicurity models of EU 25

2
European Social Model Effective regulation of economic competition Trade unions and interest coordination (mostly on branch level) Workers protection Social cohesion
 Workers protection Social cohesion")
3
High unemployment compared with US Employment is not increasing Demographic situation is bad Service sector underdeveloped Immobile labour force Rigid labour market Labour market in Europe

4
Lisbon agenda Lisbon strategy: 1) Knowledge based economy, new technologies, R&D 2) New social model of Europe, investments to human capital. 3) Macroeconomic policy to support economic growth
 Macroeconomic policy to support economic growth.")
5
Lisbon agenda Recent developments in concept: key question is how to increase competitiveness of labour markets (more employment, flexibilisation of labour markets) and how to keep current social protection system (modernisation of European social model)
 and how to keep current social protection system (modernisation of European social model)")
6
Labour market fexibilty Labour market flexibility shows how fast labour market reacts to the changing macroeconomic condition (adjustment speed of to the external shocks)
")
7
Labour market flexibility Numerical flexibility is the employers’ ability to adjust the number of employees to the current needs of production. Working time flexibility is the employers’ ability to modify the number and distribution of working hours with no change in the number of employees. Functional flexibility is the employers’ ability to move their employees from one task or department to another, or to change the content of their work. Wage flexibility enables employers to alter wages in response to the changing labour market and competitive conditions.

8
Labour market SECURITY Employment protection Income protection Combined protection (reconciling family and work)
")
9
Solution is FLEXICURITY Initial idea: shift from job security to employment security (Dutch professor H. Adriaansens, 1995 We need to find balance between social security and labour market flexibility Flexicurity

10
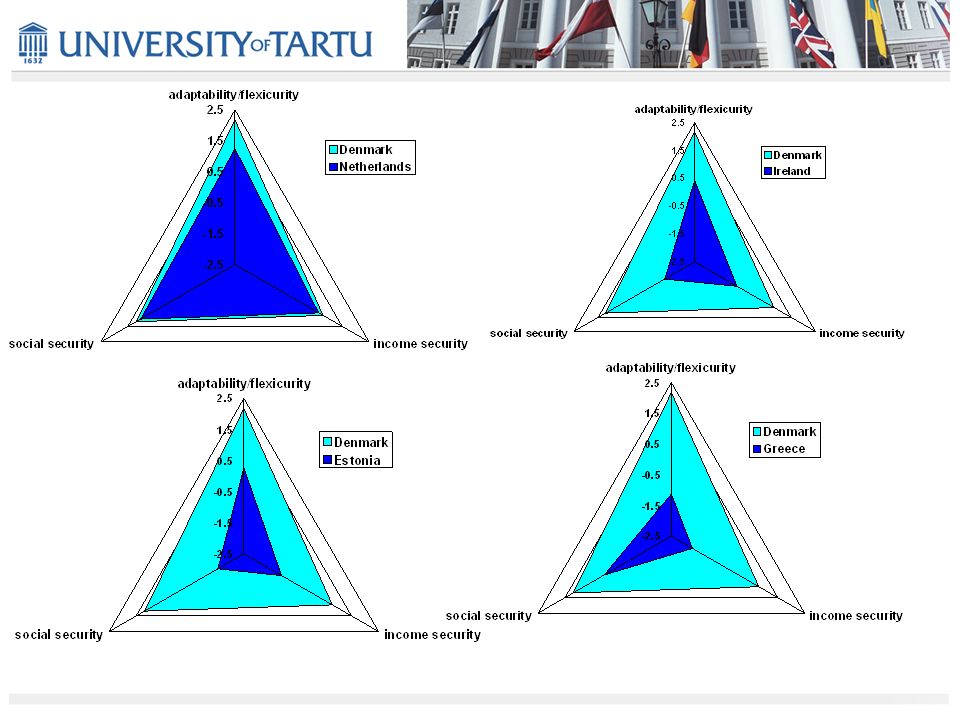
Baltic States versus Denmark Labour market flexibility Social protectionActive labour market policy Danish model Baltic States

11
Indicators Data (available for all EU 25 countries) Mainly data from Eurostat (year 2003) Number of indicators in the analysis was limited (only 25 countries) We used statistical criteria for choosing indicators into the model + previous studies (literature overview) + intuition
 Mainly data from Eurostat (year 2003) Number of indicators in the analysis was limited (only 25 countries) We used statistical criteria for choosing indicators into the model + previous studies (literature overview) + intuition")
12
VariableAdaptability/ flexibility Income security Social security Total expenditure on social protection (% of GDP)0.9759 Total expenditure on social protection per head0.7952 Tenure0.6571 Unemployment insurance0.4116 Easiness of finding new job0.8275 Mobility0.7891 Training0.6183 Life-long learning0.6606 Part-time workers0.5423 Long-term unemployment rate-0.7974 Unemployment rate of the young-0.5800 Employment rate of 55-64 years old0.9311 Ratio of 80/20 income quantiles0.9894 Gini coefficient0.9328 pov_400.8590 At-risk-of-poverty rate after social transfers0.8901
 Total expenditure on social protection per head Tenure Unemployment insurance Easiness of finding new job Mobility Training Life-long learning Part-time workers Long-term unemployment rate Unemployment rate of the young Employment rate of years old Ratio of 80/20 income quantiles Gini coefficient pov_ At-risk-of-poverty rate after social transfers0.8901")
13
LV EE LT HU CZ SK PL MT CY IE PT UK ES IT EL BE DK NL SE FI LU DE FR SI AT R 2 = 0,11

15
Cluster analysis … purpose is to group objects based on their characteristics. Objects are classified so that –there is high within-cluster homogeneity and –high between-cluster heterogeneity.

16
Clusters EL, IT, PT, SK AT, BE, FR, DE, LU, FI MT, PL, ES CZ, HU, SI DK, SE, UK, NL EE, LV, LT, CY, IE

17
EL, IT, PT, SK AT, BE, FR, DE, LU, FI MT, PL, ES CZ, HU, SI DK, SE, UK, NL EE, LV, LT, CY, IE Total expenditure on social protection (% of GDP) 23.728.219.622.229.314.7 Total expenditure on social protection per head 397677122628275483062165 Tenure 16.52116.718.716.312.6 Unemployment insurance 1334.517.714.735.518 Easiness of finding new job 8.517.811.714.734.327.2 Mobility 4.89.26.3520.86.8 Training 1527.82020.741.323.2 Life-long learning 41158.824.87.3 Part-time workers 6.717.39.35.228.810.8 Long-term unemployment rate 53.335.743.747.721.838.5 Unemployment rate of the young 24.616.427.916.410.316.3 Employment rate of 55-64 years old 3735.833.431.657.148.1 Ratio of 80/20 income quantiles 6.33.954.93.34.15.1 Gini coefficient 34.328.330.724.727.331.4 pov_50 9.83.752.345.4 At-risk-of-poverty rate after social transfers 20.112.516.79.812.917.2
 Total expenditure on social protection per head Tenure Unemployment insurance Easiness of finding new job Mobility Training Life-long learning Part-time workers Long-term unemployment rate Unemployment rate of the young Employment rate of years old Ratio of 80/20 income quantiles Gini coefficient pov_ At-risk-of-poverty rate after social transfers")
18
-2.0 -1.5 -0.5 0.0 0.5 1.0 1.5 2.0 -2.0-1.5-0.50.00.51.01.52.02.5 Adaptability Social security Baltic Flexicurity Old Europe ? Mixed

Similar presentations


 Eurostat.>")

