Download presentation
Presentation is loading. Please wait.

1
BIOSTATISTICS Lecture 2

4
The role of Biostatisticians Biostatisticians play essential roles in designing studies, analyzing data and creating methods to attack research problems as diverse as n determination of major risk factors for heart disease, lung disease and cancer n testing of new drugs to combat AIDS n evaluation of potential environmental factors harmful to human health, such as tobacco smoke, asbestos or pollutants

6
Applications of Biostatistics n Public health, including epidemiology, health services research, nutrition, and environmental health n Design and analysis of clinical trials in medicine n Genomics, population genetics, and statistical genetics in populations in order to link variation in genotype with a variation in phenotype. This has been used in agriculture to improve crops and farm animals. In biomedical research, this work can assist in finding candidates for gene alleles that can cause or influence predisposition to disease in human genetics n Ecology n Biological sequence analysis

9
Applications of Biostatistics Statistical methods are beginning to be integrated into n medical informatics n public health informatics n bioinformatics

12
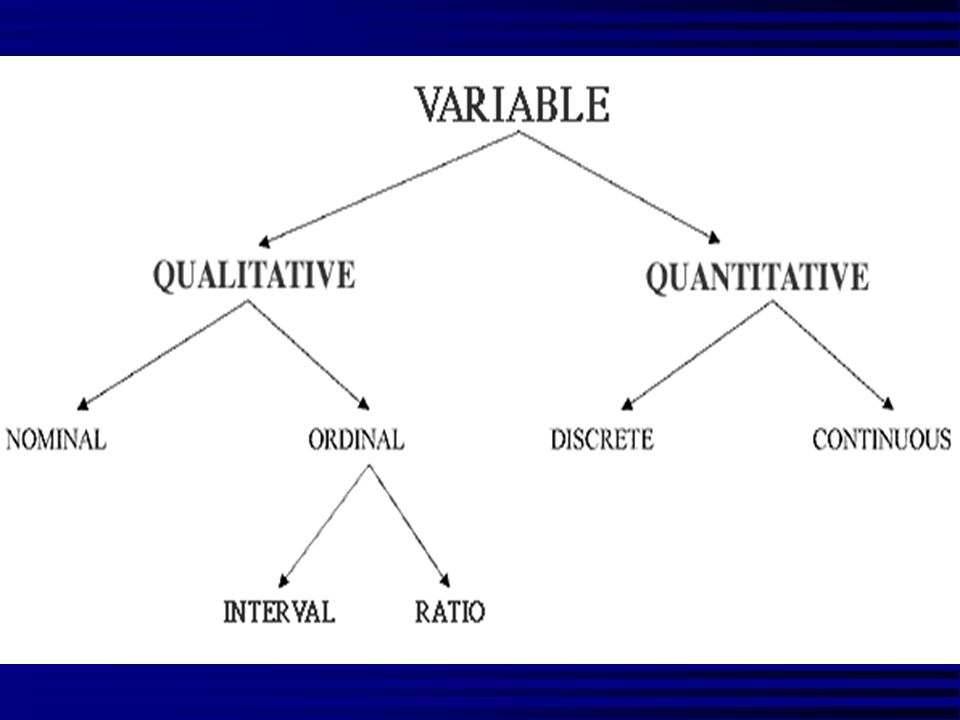
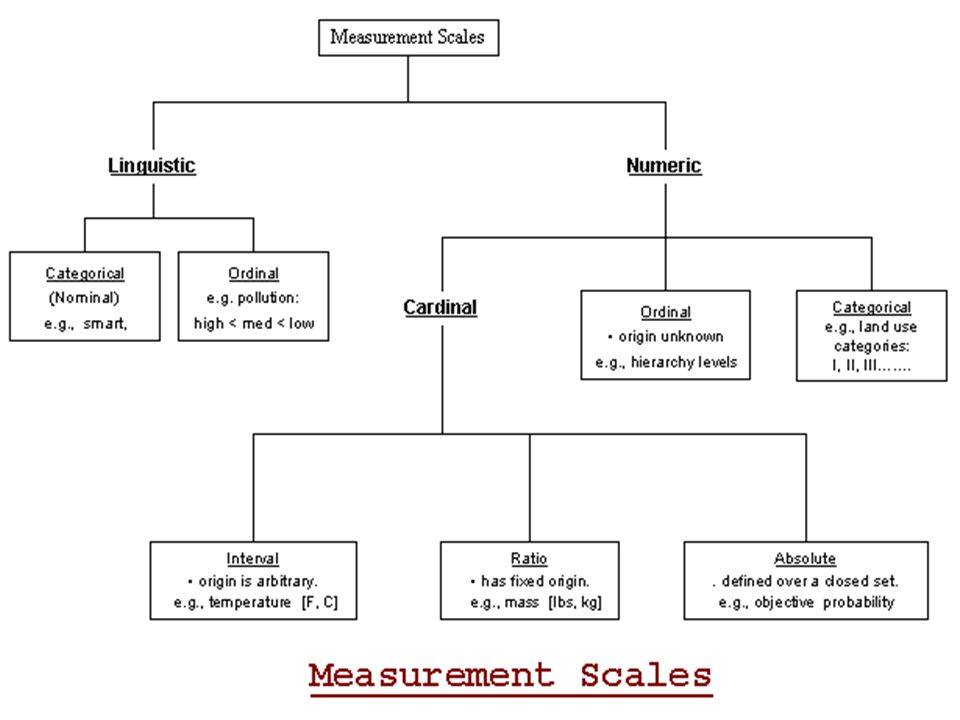
Types of Data n Categorical data: values belong to categories -Nominal data: there is no natural order to the categories e.g. blood groups -Ordinal data: there is natural order e.g. Adverse Events (Mild/Moderate/Severe/Life Threatening) -Binary data: there are only two possible categories e.g. alive/dead n Numerical data: the value is a number (either measured or counted) -Continuous data: measurement is on a continuum e.g. height, age, haemoglobin -Discrete data: a “count” of events e.g. number of pregnancies
 -Binary data: there are only two possible categories e.g. alive/dead n Numerical data: the value is a number (either measured or counted) -Continuous data: measurement is on a continuum e.g. height, age, haemoglobin -Discrete data: a count of events e.g. number of pregnancies.")
14
Measures of Frequency of Events n Incidence -The number of new events (e.g. death or a particular disease) that occur during a specified period of time in a population at risk for developing the events. n Incidence Rate -A term related to incidence that reports the number of new events that occur over the sum of time individuals in the population were at risk for having the event (e.g. events/person-years). n Prevalence -The number of persons in the population affected by a disease at a specific time divided by the number of persons in the population at the time.
 that occur during a specified period of time in a population at risk for developing the events. n Incidence Rate -A term related to incidence that reports the number of new events that occur over the sum of time individuals in the population were at risk for having the event (e.g. events/person-years). n Prevalence -The number of persons in the population affected by a disease at a specific time divided by the number of persons in the population at the time..")
18
Measures of Association n Relative risk and cohort studies -The relative risk (or risk ratio) is defined as the ratio of the incidence of disease in the exposed group divided by the corresponding incidence of disease in the unexposed group. n Odds ratio and case-control studies -The odds ratio is defined as the odds of exposure in the group with disease divided by the odds of exposure in the control group.

21
Measures of Association

22
n Absolute risk -The relative risk and odds ratio provide a measure of risk compared with a standard. n Attributable risk or Risk difference is a measure of absolute risk. It represents the excess risk of disease in those exposed taking into account the background rate of disease. The attributable risk is defined as the difference between the incidence rates in the exposed and non-exposed groups. n Population Attributable Risk is used to describe the excess rate of disease in the total study population of exposed and non-exposed individuals that is attributable to the exposure. n Number needed to treat (NNT) -The number of patients who would need to be treated to prevent one adverse outcome is often used to present the results of randomized trials.
 -The number of patients who would need to be treated to prevent one adverse outcome is often used to present the results of randomized trials..")
24
Terms Used To Describe The Quality Of Measurements n Reliability is variability between subjects divided by inter-subject variability plus measurement error. n Validity refers to the extent to which a test or surrogate is measuring what we think it is measuring.

26
Measures Of Diagnostic Test Accuracy n Sensitivity is defined as the ability of the test to identify correctly those who have the disease. n Specificity is defined as the ability of the test to identify correctly those who do not have the disease. n Predictive values are important for assessing how useful a test will be in the clinical setting at the individual patient level. The positive predictive value is the probability of disease in a patient with a positive test. Conversely, the negative predictive value is the probability that the patient does not have disease if he has a negative test result. n Likelihood ratio indicates how much a given diagnostic test result will raise or lower the odds of having a disease relative to the prior probability of disease.

27
Measures Of Diagnostic Test Accuracy

28
Expressions Used When Making Inferences About Data n Confidence Intervals -The results of any study sample are an estimate of the true value in the entire population. The true value may actually be greater or less than what is observed. n Type I error (alpha) is the probability of incorrectly concluding there is a statistically significant difference in the population when none exists. n Type II error (beta) is the probability of incorrectly concluding that there is no statistically significant difference in a population when one exists. n Power is a measure of the ability of a study to detect a true difference.
 is the probability of incorrectly concluding there is a statistically significant difference in the population when none exists. n Type II error (beta) is the probability of incorrectly concluding that there is no statistically significant difference in a population when one exists. n Power is a measure of the ability of a study to detect a true difference..")
29
Kaplan-Meier Survival Curves

30
Why Use Statistics?

31
Percentage of Specimens Testing Positive for RSV ( respiratory syncytial virus)
")
32
Descriptive Statistics

33
Distribution of Course Grades

34
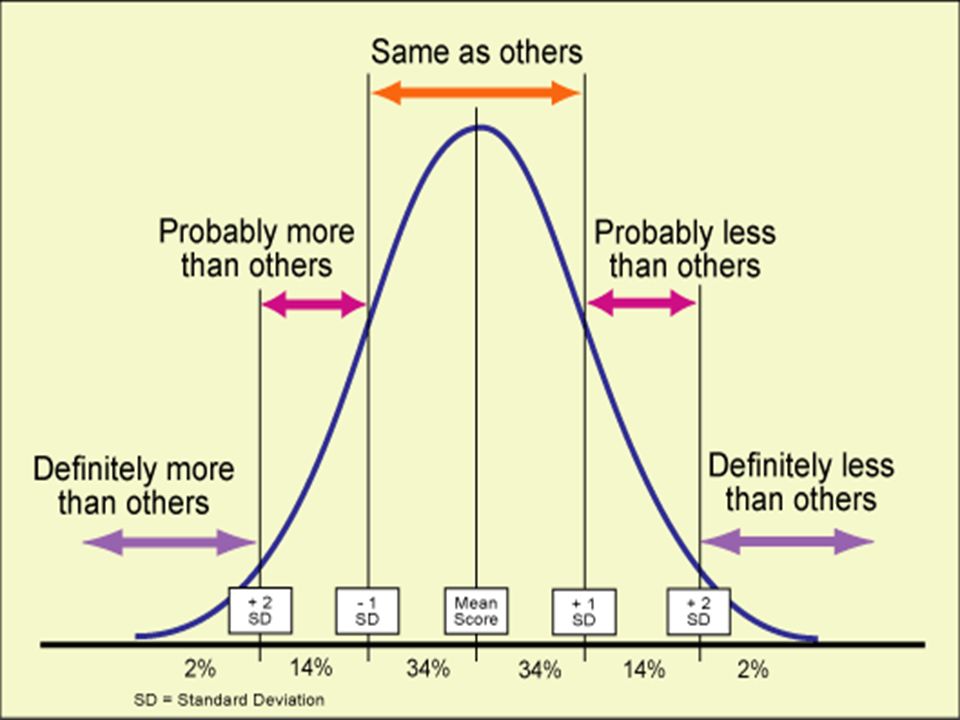
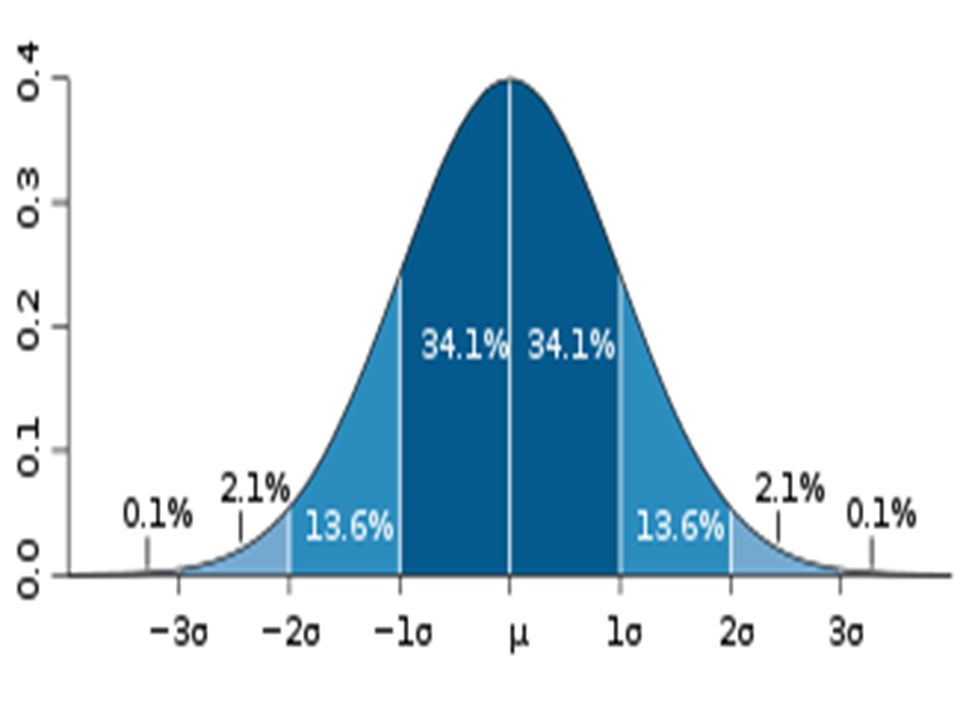
The Normal Distribution n Mean = median = mode n Skew is zero n 68% of values fall between 1 SD n 95% of values fall between 2 SDs. Mean, Median, Mode 11 22

35
Hypertension Trial

36
30 Day % Mortality

37
95% Confidence Intervals

38
Types of Errors Truth Conclusion Power = 1-

Similar presentations


>")
, and the other of people with the same general characteristics.>")


 Hajime Uno (Kitasato University) Tianxi Cai, Els Goetghebeur,>")


