Download presentation
Presentation is loading. Please wait.

1
SNPs, Haplotypes, Disease Associations Algorithmic Foundations of Computational Biology II Course 1 Prof. Sorin Istrail

2
SNPs and the Human Genome: The Minimal Informative Subset

3
Overview Introduction: SNPs, Haplotypes A Data Compression Problem: The Minimum Informative Subset A New Measure: Informativeness

4
A Most Challenging Problem “None of the [advances of the 20 th century medicine] depend on a deep knowledge of cellular processes or on any discoveries of molecular biology. Cancer is still treated by gross physical and chemical assaults on the offending tissue. Cardiovascular Disease is treated by surgery whose anatomical bases go back to the 19 th century … Of course, intimate knowledge of the living cell and of basic molecular processes may be useful eventually.” Lewontin (1991)
![A Most Challenging Problem None of the [advances of the 20 th century medicine] depend on a deep knowledge of cellular processes or on any discoveries of molecular biology.](http://images.slideplayer.com/27/9029980/slides/slide_4.jpg "Cancer is still treated by gross physical and chemical assaults on the offending tissue. Cardiovascular Disease is treated by surgery whose anatomical bases go back to the 19 th century … Of course, intimate knowledge of the living cell and of basic molecular processes may be useful eventually. Lewontin (1991).")
5
Now “A decade later, molecular biology can claim very few successes for drugs in clinical use that were designed ab initio to control a specific component of a pathway linked to disease: these include the monoclonal antibody Herceptin, and the kinase inhibitor Gleevec.” Reik, Gregory and Urnov (2002)
")
6
Introduction SNPs, HAPLOTYPES

7
A SNP is a position in a genome at which two or more different bases occur in the population, each with a frequency >1%. GATTTAGATCGCGATAGAG GATTTAGATCTCGATAGAG The most abundant type of polymorphism The two alleles at the site are G and T Single Nucleotide Polymorphism (SNP)
.")
8
tttctccatttgtcgtgacacctttgttgacaccttcatttctgcattctcaattctatttcactggtctatggcagagaacacaaaatatggccagtggc ctaaatccagcctactaccttttttttttttttgtaacattttactaacatagccattcccatgtgtttccatgtgtctgggctgcttttgcactctaatggcag agttaagaaattgtagcagagaccacaatgcctcaaatatttactctacagccctttataaaaacagtgtgccaactcctgatttatgaacttatc attatgtcaataccatactgtctttattactgtagttttataagtcatgacatcagataatgtaaatcctccaactttgtttttaatcaaaagtgttttggcc atcctagatatactttgtattgccacataaatttgaagatcagcctgtcagtgtctacaaaatagcatgctaggattttgatagggattgtgtagaat ctatagattaattagaggagaatgactatcttgacaatactgctgcccctctgtattcgtgggggattggttccacaacaacacccaccccccac tcggcaacccctgaaacccccacatcccccagcttttttcccctgctaccaaaatccatggatgctcaagtccatataaaatgccatactatttgc atataacctctgcaatcctcccctatagtttagatcatctctagattacttataatactaataaaatctaaatgctatgtaaatagttgctatactgtgtt gagggttttttgttttgttttgttttatttgtttgtttgtttgtattttaagagatggtgtcttgctttgttgcccaggctggagtgcagtggtgagatcatagctt actgcagcctcaaactcctggactcaaacagtcctcccacctcagcctcccaaagtgctgggatacaggtgtgacccactgtgcccagttatt attttttatttgtattattttactgttgtattatttttaattattttttctgaatattttccatctatagttggttgaatcatggatgtggaacaggcaaatatggag ggctaactgtattgcatcttccagttcatgagtatgcagtctctctgtttatttaaagttttagtttttctcaaccatgtttacttttcagtatacaagactttg acgttttttgttaaatgtatttgtaagtattttattatttgtgatgttatttaaaaagaaattgttgactgggcacagtggctcacgcctgtaatcccagca ctttgggaggctgaggcgggcagatcacgaggtcaggagatcaagaccatcctggctaacatggtaaaaccccgtctctactaaaaataga aaaaaattagccaggcgtggtggcgagtgcctgtagtcccagctactcgggaggctgaggcaggagaatggtgtgaacctgggaggcgg agcttgcagtgagctgagatcgtgccactgcattccagcctgcgtgacagagcgagactctgtcaaaaaaataaataaaatttaaaaaaag aagaagaaattattttcttaatttcattttcaggttttttatttatttctactatatggatacatgattgatttttgtatattgatcatgtatcctgcaaactagct aacatagtttattatttctctttttttgtggattttaaaggattttctacatagataaataaacacacataaacagttttacttctttcttttcaacctagactg gatgcattttttgtttttgtttgtttgtttgctttttaacttgctgcagtgactagagaatgtattgaagaatatattgttgaacaaaagcagtgagagtgg acatccctgctttccccctgattttagggggaatgttttcagtctttcactatttaatatgattttagctataggtttatcctagatccctgttatcatgttga ggaaattcccttctatttctagtttgttgagattttttaattcatgtgattgcgctatctggctttgctctca tctc gaga gaga gaga gaga gaga gcgc gcgc gcgc tctc gaga gaga gaga gaga gaga tctc tctc tctc tctc gaga gaga gaga tctc gcgc tctc tctc tctc Human Genome contains ~ 3 G basepairs arranged in 46 chromosomes. Two individuals are 99.9% the same. I.e. differ in ~ 3 M basepairs. SNPs occur once every ~600 bp Average gene in the human genome spans ~27Kb ~50 SNPs per gene

9
G C T C G A C A A C A G G T T C G T C A A C A G Two individuals C A G Haplotypes T T G SNP Haplotype

10
Mutations Infinite Sites Assumption: Each site mutates at most once

11
Haplotype Pattern 0 0 1 1 0 1 0 0 1 0 0 1 C A G T T T G A C A T G C T G T At each SNP site label the two alleles as 0 and 1. The choice which allele is 0 and which one is 1 is arbitrary.

12
G T T C G A C T A T T A G T T C G A C A A C A T A C G T A T C T A T T A Recombination

13
G T T C G A C T A T T A G T T C G A C A A C A T A C G T A T C T A T T A The two alleles are linked, I.e., they are “traveling together” ? Recombination disrupts the linkage Recombination

14
Variations in Chromosomes Within a Population Common Ancestor Emergence of Variations Over Time timepresent Disease Mutation Linkage Disequilibrium (LD)
")
15
Time = present 2,000 gens. ago Disease-Causing Mutation 1,000 gens. ago Extent of Linkage Disequilibrium

16
A Data Compression Problem The Minimum Informative Subset

17
A Data Compression Problem Select SNPs to use in an association study Would like to associate single nucleotide polymorphisms (SNPs) with disease. Very large number of candidate SNPs Chromosome wide studies, whole genome-scans For cost effectiveness, select only a subset. Closely spaced SNPs are highly correlated It is less likely that there has been a recombination between two SNPs if they are close to each other.

18
Disease Associations

19
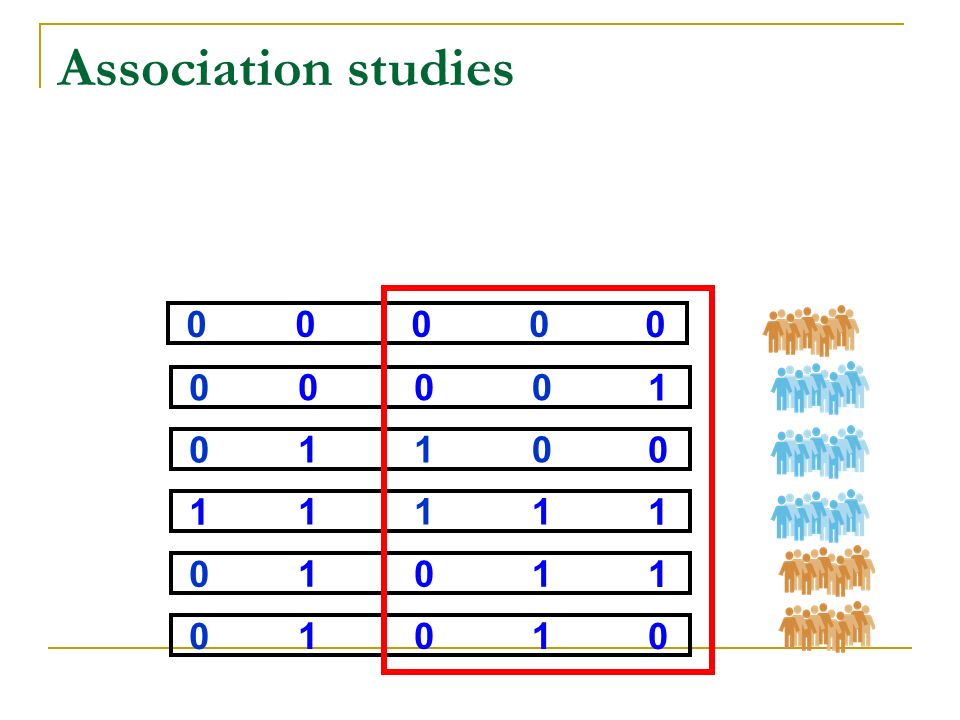
Association studies Disease Responder Control Non-responder Allele 0Allele 1 Marker A is associated with Phenotype Marker A: Allele 0 = Allele 1 =

20
Evaluate whether nucleotide polymorphisms associate with phenotype TA GA A CG GA A CG TA A TA TC G TG TA G TG GA G Association studies

21
TA GA A CG GA A CG TA A TA TC G TG TA G TG GA G

22
11 00 0 00 00 0 00 10 0 11 11 1 10 10 1 10 00 1
23
Compression based on Haplotype Resolution

24
01 01 1 10 0 0 00 10 1 1 For a SNP s we associate a bipaprtite graph. Nodes: the set of haplotypes. Edges: the set of pairs of haplotypes with different alleles at s. s 1 s2 s2 D-graph of a SNP

25
01 01 1 10 0 0 00 10 1 1 For a set of SNPs S we associate a bipaprtite graph. Nodes: the set of haplotypes. Edges: the set of pairs of haplotypes with different alleles at some SNP s in S. s 1 s 2 D-graph of a set of SNPs

26
01 01 1 10 0 0 00 10 1 1 Red SNP is equivalent to Blue SNP SNP Selection

27
Red SNPs predict Green SNP 01 01 1 10 0 0 00 10 1 1 SNP Selection

28
Minimal Informative Subset 01 01 1 10 0 0 00 10 1 1 Data Compression

29
Compresssion based on Haplotype Blocks

30
Hypothesis – Haplotype Blocks? The genome consists largely of blocks of common SNPs with relatively little recombination within the blocks Patil et al., Science, 2001; Jeffreys et al., Nature Genetics, 2001; Daly et al., Nature Genetics, 2001

31
Sense genes Antisense genes 200 kb 1234 DNA SNPs Haplotype blocks Haplotype Block Structure LD-Blocks, and 4-Gamete Test Blocks

32
Hudson and Kaplan 1985 A segment of SNPs is a block if between every pair of SNPs at most 3 out of the 4 gametes (00, 01,10,11) are observed. 0 0 1 0 1 1 1 1 0 1 1 1 0 0 1 0 1 1 1 1 0 1 0 1 BLOCKVIOLATES THE BLOCK DEFINITION Four Gamete Block Test

33
Finding Recombination Hotspots: Many Possible Partitions into Blocks A C T A G A T A G C C T G T T C G A C A A C A T A C T C T A T G A T C G G T T A T A C G A C A T A C T C T A T A G T A T A C T A G C T G G C A T All four gametes are present:

34
A C T A G A T A G C C T G T T C G A C A A C A T A C T C T A T G A T C G G T T A T A C G A C A T A C T C T A T A G T A T A C T A G C T G G C A T Find the left-most right endpoint of any constraint and mark the site before it a recombination site. Eliminate any constraints crossing that site. Repeat until all constraints are gone. The final result is a minimum-size set of sites crossing all constraints.

35
Data Compression ACGATCGATCATGAT GGTGATTGCATCGAT ACGATCGGGCTTCCG ACGATCGGCATCCCG GGTGATTATCATGAT A------A---TG-- G------G---CG-- A------G---TC-- A------G---CC-- G------A---TG-- Haplotype Blocks based on LD (Method of Gabriel et al.2002) Selecting Tagging SNPs in blocks
 Selecting Tagging SNPs in blocks")
36
A New Measure Informativeness

37
01 00 1 01 10 0 s h2h2 h1h1

38
10 00 0 01 00 1 01 10 0 10 11 1 s 1 s 2 s 3 s 4 s 5 I(s 1,s 2 ) = 2/4 = 1/2 Informativeness
 = 2/4 = 1/2 Informativeness")
39
10 00 0 01 00 1 01 10 0 10 11 1 s 1 s 2 s 3 s 4 s 5 I({s 1,s 2 }, s 4 ) = 3/4 Informativeness
 = 3/4 Informativeness")
40
10 00 0 01 00 1 01 10 0 10 11 1 s 1 s 2 s 3 s 4 s 5 I({s 3,s 4 },{s 1,s 2,s 5 }) = 3 S={s 3,s 4 } is a Minimal Informative Subset Informativeness
 = 3 S={s 3,s 4 } is a Minimal Informative Subset Informativeness")
41
Minimum Set Cover = Minimum Informative Subset s1s1 s2s2 s5s5 s3s3 s4s4 e1e1 e2e2 e3e3 e4e4 e5e5 e6e6 SNPs Edges 10 00 0 01 00 1 01 10 0 1 0 1 1 1 s1s1 s2s2 s3s3 s4s4 s5s5 Graph theory insight Informativeness

42
Minimum Set Cover {s 3, s 4 } = Minimum Informative Subset s1s1 s2s2 s5s5 s3s3 s4s4 e1e1 e2e2 e3e3 e4e4 e5e5 e6e6 SNPsEdges 10 00 0 01 00 1 01 10 0 1 0 1 1 1 s1s1 s2s2 s3s3 s4s4 s5s5 Informativeness Graph theory insight

43
Real Haplotype Data Two different runs of the Gabriel el al Block Detection method + Zhang et al SNP selection algorithm Our block-free algorithm A region of Chr. 22 45 Caucasian samples

44
When Maximum Likelihood = Bayesian = Parsimony

Similar presentations


