Download presentation
Presentation is loading. Please wait.

1
Economic and Commercial Real Estate Outlook By Lawrence Yun, Ph.D. Chief Economist, National Association of REALTORS ® Presentation at NAR Annual Meetings San Diego, CA November 13, 2015

2
Commercial Property Price Index Source: Federal Reserve

3
Green Street Property Price Index – Even Higher

4
Dow Jones Industrial Average (Doubling since 2009)
")
5
Lifetime Wealth at All-Time High

6
Consumer Confidence Index

7
Median Household Income (Inflation Adjusted)
")
8
Annual GDP … Below 3% for 10 straight years

9
Sluggish Growth + Gap after Recession ($1.7 trillion gap … $5,000 per person) 3% Growth Line 2.2% Growth Line
 3% Growth Line 2.2% Growth Line")
10
GDP Component on Commercial Construction and Sales More inconsistent

11
Jobs (8 million lost … 13 million gained) In thousands
 In thousands")
12
Fresh Unemployment Insurance Claims In thousands

13
Unemployment Rate Falling

14
But Employment Rate Not Rising

15
Part-time and Underemployment (in thousands)
")
16
Which State is Hot in Jobs? Year-on-year Growth as of Sept 2015

17
Top and Bottom States for Jobs The Best% Gain in 12 months Utah3.9 Idaho3.2 South Carolina3.1 Florida3.0 Washington3.0 California2.9 Nevada2.8 Oregon2.7 North Carolina2.4 The Worst% Gain in 12 months Louisiana0.0 Alaska-0.2 Wyoming-0.9 West Virginia-1.7 North Dakota-1.8

18
Dallas Still Creating Jobs; Houston Not (job growth rate from a year ago)
")
19
Fed Rate Hike in December?

20
Fed Rate Hike in December then again in March

21
Fed Rate Hike in December then again in March then again in August then again in …

22
Fed Policy and Mortgage Rate

23
What Determines Bond Yields? Federal Reserve’s short-term rate changes Inflation and erosion of purchasing power Foreign capital flow and demand for dollar Savings rate U.S. budget deficit Printing of money …

24
Federal Deficit - Shrinking ( $ million, 12 month total)
")
25
Federal Debt … Cumulative ( $ million; debt held by public excluding intra-governmental holdings)
")
26
U.S. Dollar Reversing the Decline … Stronger and Stronger

27
No CPI Inflation – Yet

28
Oil Price

29
Supply and Demand: Oil in U.S. 19 21 5 9

30
Rents Rising at 7-year high

31
Rental Vacancy Rate (30-year low)
")
32
Multifamily Oversupply?

33
Renters (8 million more households)
")
34
Homeowners (2.5 million fewer households)
")
35
Commercial Real Estate

36
Commercial Investment Sales of Large Properties (Properties valued at $2.5 million and over)
")
37
REALTOR ® Deal Size (Not $2.5 million Properties)
")
38
CRE Financing: Small vs. Large CRE Markets

39
REALTORS ® CRE Lending

40
Administrator Maria Contreras-Sweet SBA Loan for Small Business and Commercial Real Estate New … streamlined process Match.com concept

41
CRE Sales: Small vs. Large Markets Sources: NAR, Real Capital Analytics

42
REALTORS ® Vacancy Rates Source: National Association of REALTORS ®

43
REALTORS ® CRE Construction Picks Up Source: National Association of REALTORS ®

44
CRE Prices: Small vs. Large Markets Sources: NAR, Real Capital Analytics

45
CRE Spreads: Small vs. Large CRE Markets Sources: NAR, Real Capital Analytics ®

46
SIOR CRE Index Source: SIOR, NAR

47
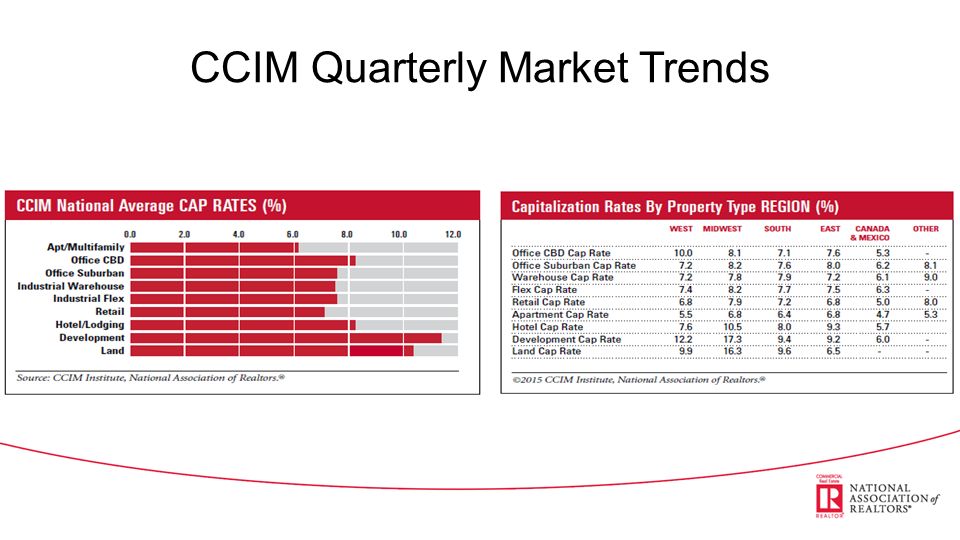
CCIM Quarterly Market Trends

49
Forecast and Risks

50
Economic Forecast 201320142015 Forecast 2016 Forecast GDP Growth2.2%2.6%2.3%3.0% Job Growth+2.3 million+3.0 million+2.4 million+2.7 million CPI Inflation1.5%1.6%0.3%3.2% Consumer Confidence 738799101 10-year Treasury2.5%2.6%2.2%3.3%

51
REALTORS ® CRE Outlook Commercial Real Estate Vacancy Forecast (%) 2014.Q32014.Q42015.Q12015.Q22015.Q32015.Q42016.Q12016.Q22016.Q32016.Q4201420152016 Office15.714.915.115.915.815.515.315.114.914.816.015.615.0 Industrial9.911.611.310.810.39.89.49.08.58.412.011.78.8 Retail13.812.513.713.213.012.712.312.111.911.613.813.212.0 Multifamily6.16.88.46.66.76.6 6.76.67.1 Source: NAR Commercial Property Price Indices Forecast 200820092010201120122013201420152016 NCREIF 215.2165.1168.2186.5195.2211.9224.9 249.8249.0 Green St. Advisors 86.163.574.487.192.299.4106.7 117.5115.5 Sources: NAR, NCREIF, Green Street Advisors

52
2/3 of Members used 1031 Like-Kind Exchanges

53
1031 and Economic Impact

54
Like-Kind Exchanges: Potential Repeal REALTORS ® reported that 40% of 2011-14 transactions would not have occurred, absent IRC Section 1031

Similar presentations
 = $11,814.9B (5.5%) Q2: GDP = $2,914.38.>")


 Robert Carrillo September2013.>")


