Download presentation
Presentation is loading. Please wait.

1
Γαλαξίες – 3 Υπερμαζικές Μαύρες Τρύπες στα κέντρα γαλαξιών 15 Ιανουαρίου 2013

2
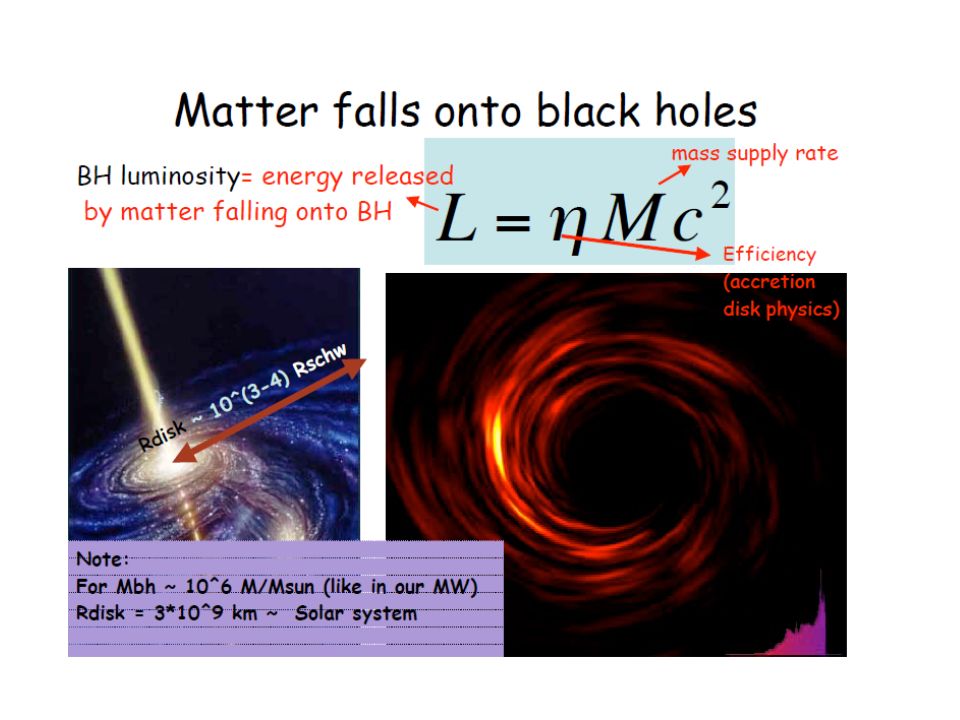
~c

3
Normal galaxies (not only AGNs) are found to host SMBH
 are found to host SMBH")
4
Schneider 2007 We can measure the mass of the central black hole

5
Radius of influence of BH Central BH detectability We consider a mass concentration of mass M in the center of a galaxy where the characteristic velocity dispersion of stars (or gas) is σ. We compare this velocity dispersion with the characteristic velocity (e.g., the Kepler rotational velocity) around a SMBH at a distance r, given by for distances smaller than the SMBH will significantly affect the kinematics of stars and gas in the galaxy. The corresponding angular scale is where D is the distance of the galaxy
 around a SMBH at a distance r, given by for distances smaller than the SMBH will significantly affect the kinematics of stars and gas in the galaxy. The corresponding angular scale is where D is the distance of the galaxy.")
6
Black Holes in the Centers of Galaxies The mass M of supermassive black holes (SMBHs) is closely tied to the properties of the spheroidal component of galaxies –the bulge luminosity, L bulge –the stellar velocity dispersion, σ –the mass of the bulge –the central light concentration –the Sersic index –the virial mass of the galaxy –the gravitational binding energy –the kinetic energy of random motions of the bulge –the stellar –light and mass deficit associated to the core ellipticals Beifiori et al. 2012 MNRAS, 419, 2497

7
Sersic index The Sérsic profile is a generalization of de Vaucouleurs' law (Sérsic 1963) Most galaxies are fit by Sérsic profiles with indices in the range 1/2 < n < 10 The best-fit value of n correlates with galaxy size and luminosity, such that bigger and brighter galaxies tend to be fit with larger n –setting n = 4 gives the de Vaucouleurs profile: which is a good description of giant elliptical galaxies. – Setting n = 1 gives the exponential profile: which is a good description of spiral galaxy disks and dwarf elliptical galaxies.

9
Beifiori et al. 2012 MNRAS, 419, 2497

10
Conclusions from Beifiori et al (2012) study 143 galaxies with measurements of M (i.e. most of the SMBH hosts known to date) explored correlations M (σ e, L i,bulge, M bulge, n bulge, μ e,bulge, L i,gal, M ⋆,gal, V c,max, M dyn,gal,M e,gal ) Verification of the tightness of the M − σ e relation Correlations with other galaxy parameters do not yield tighter trends. –No differences in the M − σ e relation of barred and unbarred galaxies. – The M − σ e relation of pseudo-bulges is also coarser and has a different slope than that involving classical bulges. Rather poor correlation between M and n (or ) suggesting that M is not related to the bulge light concentration. The correlations between M and galaxy luminosity or mass are not a marked improvement over the M −σ e relation. These scaling relations depend sensitively on the host galaxy morphology: early-type galaxies follow a tighter relation than late-type galaxies. If V c is a proxy for the dark matter halo mass, the large scatter of the M − V c relation then suggests that M is more coupled to the baryonic rather than the dark matter. Tested the need for a third parameter in the M scaling relations, through various linear correlations with bulge and galaxy parameters, only to confirm that the fundamental plane of the SMBH is mainly driven by σ e with a small tilt due to the effective radius.
 explored correlations M (σ e, L i,bulge, M bulge, n bulge, μ e,bulge, L i,gal, M ⋆,gal, V c,max, M dyn,gal,M e,gal ) Verification of the tightness of the M − σ e relation Correlations with other galaxy parameters do not yield tighter trends. –No differences in the M − σ e relation of barred and unbarred galaxies. – The M − σ e relation of pseudo-bulges is also coarser and has a different slope than that involving classical bulges. Rather poor correlation between M and n (or ) suggesting that M is not related to the bulge light concentration. The correlations between M and galaxy luminosity or mass are not a marked improvement over the M −σ e relation. These scaling relations depend sensitively on the host galaxy morphology: early-type galaxies follow a tighter relation than late-type galaxies. If V c is a proxy for the dark matter halo mass, the large scatter of the M − V c relation then suggests that M is more coupled to the baryonic rather than the dark matter. Tested the need for a third parameter in the M scaling relations, through various linear correlations with bulge and galaxy parameters, only to confirm that the fundamental plane of the SMBH is mainly driven by σ e with a small tilt due to the effective radius..")
11
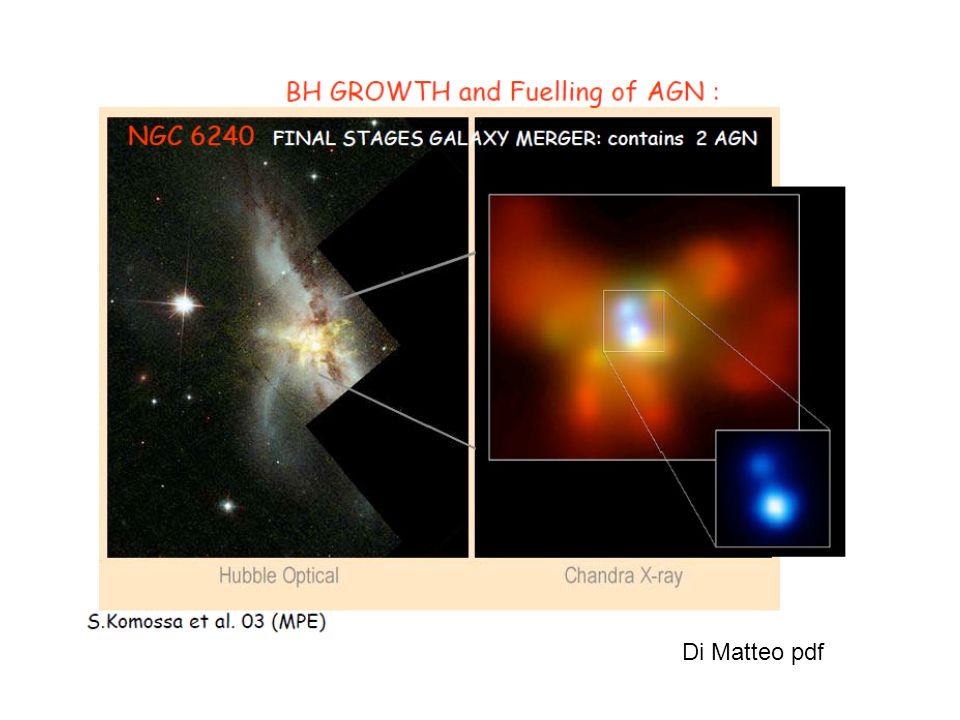
Di Matteo pdf

12
SMBH – galaxy formation and evolution Di Matteo pdf

14
Direct Methods –Cepheids –LMC SN-1987a-light echo Secondary distance indicators –SNIa –Surface brightness fluctuations –Planetary nebulae –Scaling relations Measurement of the Hubble constant The ratio of distances to the Virgo and the Coma clusters of galaxies is estimated by means of these various secondary distance measures. Together with the distance to the Virgo Cluster as determined from Cepheids, we can the derive the distance to Coma. Its redshift (z ≈ 0.023) is large enough for its peculiar velocity to make no significant contribution to its redshift, so that it is dominated by the Hubble expansion. H 0 = 72±8 km/s/Mpc –From H and redshift you can estimate the distance of distant galaxies/quasars Extragalactic Distance Determination SN1987a light echo
 is large enough for its peculiar velocity to make no significant contribution to its redshift, so that it is dominated by the Hubble expansion. H 0 = 72±8 km/s/Mpc –From H and redshift you can estimate the distance of distant galaxies/quasars Extragalactic Distance Determination SN1987a light echo.")
15
Luminosity function of galaxies Definition of the Luminosity Function the luminosity function is the number density of objects (here galaxies) of a specific luminosity. Φ(M) dM is defined as the number density of galaxies with absolute magnitude in the interval [M, M+dM]. The total density of galaxies is then Accordingly, Φ(L) dL is defined as the number density of galaxies with a luminosity between L and L +dL.
 dM is defined as the number density of galaxies with absolute magnitude in the interval [M, M+dM]. The total density of galaxies is then Accordingly, Φ(L) dL is defined as the number density of galaxies with a luminosity between L and L +dL..")
16
Problems in Determining the Luminosity Function the determination of galaxy luminosities requires flux and distance measurements For very distant galaxies redshift is a sufficiently reliable measure of distance (via the Hubble constant), whereas for nearby galaxies other methods have to be applied. Another problem occurs for nearby galaxies, namely the large-scale structure of the galaxy distribution. To obtain a representative sample of galaxies, a sufficiently large volume has to be surveyed because the galaxy distribution is heavily structured on scales of ~ 100 h −1 Mpc. On the other hand, galaxies of particularly low luminosity can only be observed locally, so the determination of Φ(L) for small L always needs to refer to local galaxies. Malmquist bias: in a flux-limited sample luminous galaxies will always be overrepresented because they are visible at larger distances (and therefore are selected from a larger volume). A correction for this effect is always necessary.
 for small L always needs to refer to local galaxies. Malmquist bias: in a flux-limited sample luminous galaxies will always be overrepresented because they are visible at larger distances (and therefore are selected from a larger volume). A correction for this effect is always necessary..")
17
The Schechter Luminosity Function The global galaxy distribution is well approximated by the Schechter luminosity function where L ∗ is a characteristic luminosity above which the distribution decreases exponentially, α is the slope of the luminosity function for small L, and Φ ∗ specifies the normalization of the distribution Expressed in terms of magnitude, Blue band (SF) Red band (mass)
 Red band (mass)")
18
Schneider 2007 The Schechter LF

19
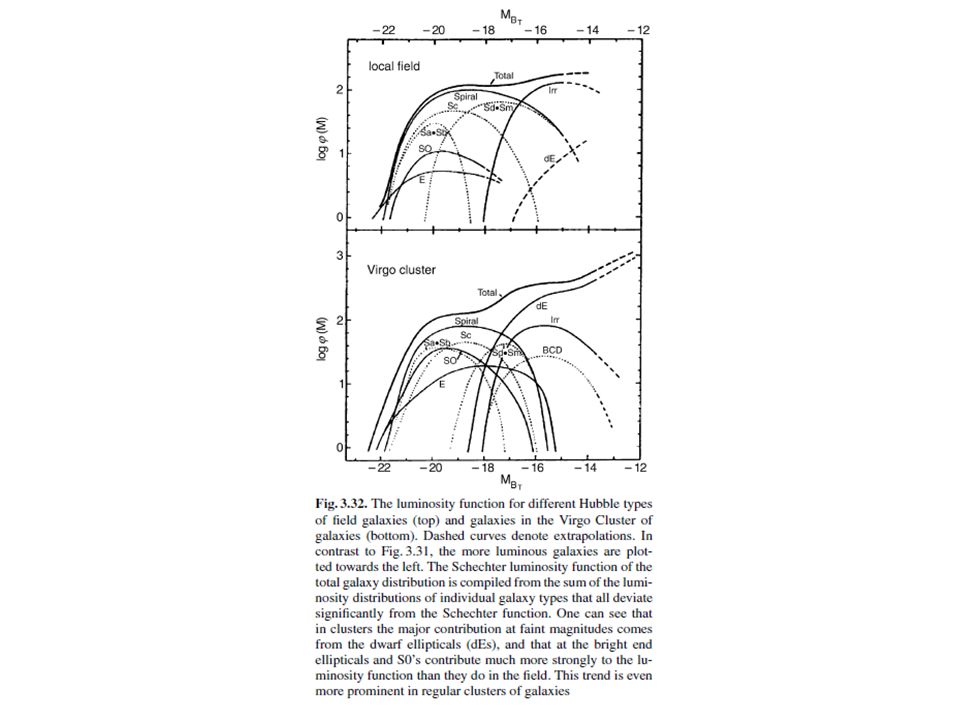
Comments on the galaxy luminosity function Deviations of the galaxy luminosity function from he Schechter form are common. There is also no obvious reason why such a simple relation for describing the luminosity distribution of galaxies should exist. Although the Schechter function seems to be a good representation of the total distribution, each type of galaxy has its own luminosity function, with each function having a form that strongly deviates from the Schechter function For instance, spirals are relatively narrowly distributed in L, whereas the distribution of ellipticals is much broader if we account for the full L-range, from giant ellipticals to dwarf ellipticals. E’s dominate in particular at large L; the low end of the luminosity function is likewise dominated by dwarf ellipticals and Irr’s. the luminosity distribution of cluster and group galaxies differs from that of field galaxies. The fact that the total luminosity function can be described by an equation as simple as is, at least partly, a coincidence (“cosmic conspiracy”) and cannot be modeled easily.
 and cannot be modeled easily..")
Similar presentations


>")


 They all have.>")


Chandra Fellows Symposium 2006 The cluster scaling relations observed by Chandra C. Jones, W. Forman, L. Van Speybroeck.>")


