Download presentation
Presentation is loading. Please wait.

1
Introduction to Spectrophotometry

2
Properties of Light Electromagnetic radiation moves in waves
Light (called electromagnetic radiation) moves in waves. Wavelength = different types of light have different wavelengths. Some are longer than others. For instance, in the visible light spectrum, red light waves are longer than blue light waves.
 moves in waves. Wavelength = different types of light have different wavelengths. Some are longer than others. For instance, in the visible light spectrum, red light waves are longer than blue light waves.")
3
Electromagnetic Spectrum

4
Electromagnetic Spectrum
Wavelengths are commonly given in ???? Lambda λ

5
Visible Light Colors & Wavelengths COLOR WAVELENGTH (λ in nm)
Ultraviolet < 380 Violet 380 – 435 Blue 436 – 480 Greenish-blue 481 – 490 Bluish-green 491 – 500 Green 501 – 560 Yellowish-green 561 – 580 Yellow 581 – 595 Orange 596 – 650 Red 651 – 780 Near Infrared > 780 Visible Light

6
What is Colorimetry? The solutions of many compounds have characteristic colors. The intensity of such a color is proportional to the concentration of the compound.

7
What are Spectroscopy and Spectrophotometry??
Light can either be transmitted or absorbed by dissolved substances Presence & concentration of dissolved substances is analyzed by passing light through the sample Spectroscopes measure electromagnetic emission Spectrophotometers measure electromagnetic absorption The presence and concentration of various substances dissolved in a water sample is commonly analyzed by passing different types of light (visible, infrared, or UV) through the sample. Light can either be transmitted or absorbed by the dissolved substances.
 through the sample. Light can either be transmitted or absorbed by the dissolved substances.")
8
Instruments of Measurement
Two most common: Visible Spectrophotometer Spect 20, Spect 88 Atomic-Absorption Spectrophotometer

9
Instruments of Measurement
What do visible spectrophotometers measure? Amount of light absorbed by the dissolved substance Qualitative Quantitative The absorption of light indicates the presence of the substance. This is a qualitative measurement. The amount of light absorbed measures the concentration of the dissolved substance. This is a quantitative measurement.

10
Absorption of Light White light All colors Polychromatic light
When white (polychromatic) light passes through a coloured solution some of the light is absorbed by the substances in the solution, and the rest passes through. Green solution absorbs light other then green
 light passes through a coloured solution some of the light is absorbed by the substances in the solution, and the rest passes through. Green solution absorbs light other then green.")
11
Absorption of Light Monochromatic light Light of one color
If white light is made to pass through a red filter, all light except red is filtered out and absorbed. Therefore, only red light hits the solution. Red light is absorbed by the green solution

12
The Spectrophotometer
The monochromatic light is obtained by allowing the beam of light to pass through a prism or diffraction grating (monochrometer) The monochromatic light is directed through a cuvette containing the sample, and the light that penetrates hits the photoelectric cell. The current developed by the photoelectric cell is translated into percent transmission or absorbance through a galvanometer. Then you can read the absorbance on the galvanometer. Absorbance is also called extinction and optical density In review, a spectrophotometer is used to measure the absorption of a certain color of light (specific wavelength) as it passes through a treated sample. A compound of interest is reacted with reagents creating a colored substance. It is the blockage or absorption of light by this secondary material (dye) that is actually measured. The amount of dye created is directly proportional to the amount of the compound of interest present in the sample. The original material’s concentration can be found by calculations or comparing the sample’s absorption to absorptions of various known strength solutions.
 The monochromatic light is directed through a cuvette containing the sample, and the light that penetrates hits the photoelectric cell. The current developed by the photoelectric cell is translated into percent transmission or absorbance through a galvanometer. Then you can read the absorbance on the galvanometer. Absorbance is also called extinction and optical density. In review, a spectrophotometer is used to measure the absorption of a certain color of light (specific wavelength) as it passes through a treated sample. A compound of interest is reacted with reagents creating a colored substance. It is the blockage or absorption of light by this secondary material (dye) that is actually measured. The amount of dye created is directly proportional to the amount of the compound of interest present in the sample. The original material’s concentration can be found by calculations or comparing the sample’s absorption to absorptions of various known strength solutions.")
13
Observed Color of Compound Color of Light Absorbed
Observed Color of Compound Color of Light Absorbed Approximate Wavelength of Light Absorbed Green Red 700 nm Blue-green Orange-red 600 nm Violet Yellow 550 nm Red-violet Yellow-green 530 nm 500 nm Orange Blue 450 nm 400 nm

15
Definitions & Symbols Intensity (I) Transmittance (T)
It’s also referred to as %T or T x 100 T = I/Io Where Io is the intensity of the blank I = the rate at which energy in a beam of radiation arrives at a fixed point. T = the ratio of the intensity in a beam of radiation after it has passed through a sample to the power of the incident beam T = I/ Io Where I is the radiation transmitted by the solution and Io is the radiation transmitted by the pure solvent (blank)
")
16
Graphical Relationship
% transmission and % absorption are not linearly related to concentration For a graph to be useful, a straight line is needed ABSORBANCE = log(1/T) = -log(T) If this is to be done graphically, a graphing problem has to be overcome. Light passage or percent transmittance is not linearly related to the dissolved substances concentration. Percent absorption is also not linearly related to concentration. For a graph to be useful a straight line is needed (a linear relationship is needed). A new optical property was derived from percent transmission that is linearly related to concentration called ABSORBANCE. ABS = log(100/%T) Absorbance is what is generally recorded from a spectrophotometer.
 = -log(T) If this is to be done graphically, a graphing problem has to be overcome. Light passage or percent transmittance is not linearly related to the dissolved substances concentration. Percent absorption is also not linearly related to concentration. For a graph to be useful a straight line is needed (a linear relationship is needed). A new optical property was derived from percent transmission that is linearly related to concentration called ABSORBANCE. ABS = log(100/%T) Absorbance is what is generally recorded from a spectrophotometer.")
17
Beer’s Law The intensity of a ray of monochromatic light decreases exponentially as the concentration of the absorbing medium increases. More dissolved substance = more absorption and less transmittance Beer’s Law is concerned with light absorption in relation to solution concentration and cell path length. It states that the intensity of a ray of monochromatic light decreases exponentially as the concentration of the absorbing medium increases. In other words, the more dissolved substance you have in a solution, the more light that will be absorbed, and the less light that will be transmitted through the solution. If light is absorbed exponentially with concentration over a reasonable range of concentration, the colored, dissolved material is said to conform to Beer’s Law. The best way to determine whether a colored compound obeys Beer’s Law is to prepare a series of samples in the desired range of concentration and submit them to a test on the spectrophotometer. If the observations plot on a straight line, the material can be considered to obey Beer’s Law.

18
Absorbance Beer-Lambert Law (a.k.a. Beer's law) - the linear relationship between absorbance and concentration of an absorbing species. A = lc A is the absorbance “” is molar absorptivity in L/[(mole)(cm)] Also called “extinction coefficient” or “”; it is dependent on the material being studied. “l” is the path length in cm The diameter of the cuvette or sample holder which is the distance the light travels through the absorbing sample. “b” is a constant when the same size cuvette is used for all samples. “c” is the concentration of the sample in (mol/L) Main use of Beer’s Law is to determine the concentration of various solutions.
(cm)] Also called extinction coefficient or ; it is dependent on the material being studied. l is the path length in cm. The diameter of the cuvette or sample holder which is the distance. the light travels through the absorbing sample. b is a constant. when the same size cuvette is used for all samples. c is the concentration of the sample in (mol/L) Main use of Beer’s Law is to determine the concentration. of various solutions.")
19
Transmittance is Related to Absorbance
Transmittance is given by the equation: T = I/Io where I is the intensity of the light after it has gone through the sample & Io is the initial light intensity. Absorbance is related to the %T: A = -logT = -log(I/ Io)
")
20
T= (I/Io) = 10-A %T = (I/Io) x 100 A = -logT = log(1/T)
Equation Summary T= (I/Io) = 10-A %T = (I/Io) x A = -logT = log(1/T) Sample Calculation If %T = 95%, then A = log(100/95) = log(1/.95) = -log(.95) A = Note the scale for Absorbance: 9/10th of the scale is from 0-1 and 1/10th is from 1-2. For this reason, the spectrometers have been calibrated in % Transmittance and all readings will be taken in %Transmittance.
 = 10-A %T = (I/Io) x 100 A = -logT = log(1/T) Sample Calculation. If %T = 95%, then A = log(100/95) = log(1/.95) = -log(.95) A = Note the scale for Absorbance: 9/10th of the scale is from 0-1 and 1/10th is from 1-2. For this reason, the spectrometers have been calibrated in % Transmittance and. all readings will be taken in %Transmittance.")
21
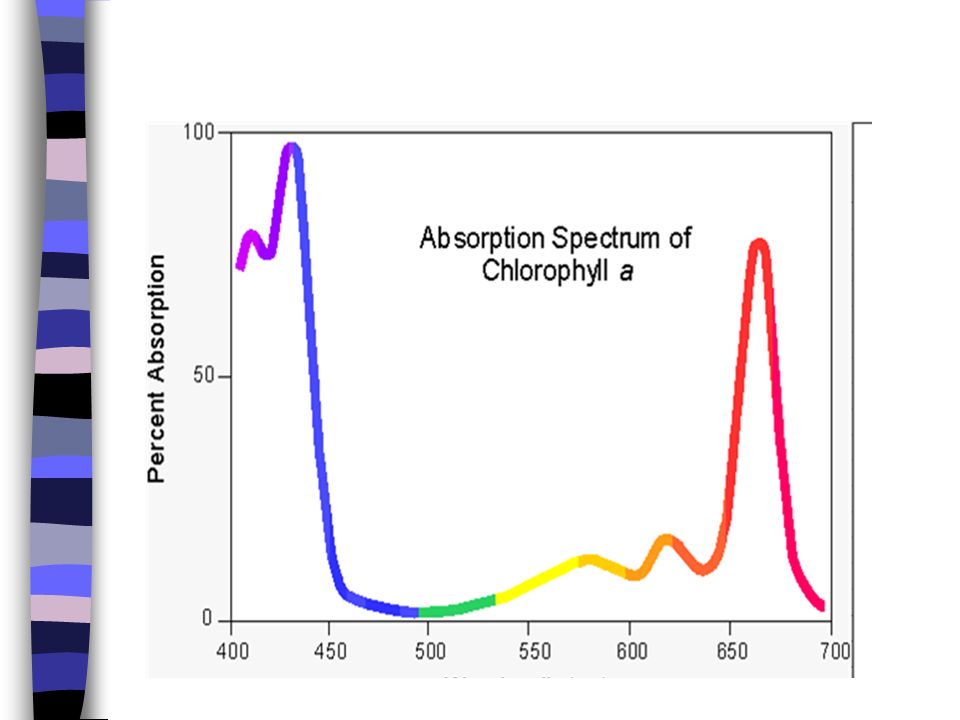
Spectral Transmission Curve
Optimum wavelength Before we can create our standardization curve, we must determine the optimum wavelength of the dissolved compound that we’re working with. The optimum wavelength can be determined at any time by establishing a spectral transmission curve. The curve is established by making a series of observations of light transmission at several different wavelengths of light. The results when plotted yield a curve like the one shown above. The optimum wavelength (characteristic wavelength) is the one with the highest absorbance and will be the wavelength at which the spec. is set for all subsequent absorbance measurements.
 is the one with the highest absorbance and will be the wavelength at which the spec. is set for all subsequent absorbance measurements.")
22
Standardization Graph
Standards (solutions of known concentration) of the compound of interest are made, treated, and their absorbances (ABS) and concentration values are used to create a Standardization Graph. Again, specs are calibrated for use by preparing a series of standards and by making observations on light absorbance. Standards (solutions of known concentration) of the compound of interest are made, treated, and their absorbances (ABS) and concentration values are used to create a Standardization Graph.
 of the compound of interest are made, treated, and their absorbances (ABS) and concentration values are used to create a Standardization Graph. Again, specs are calibrated for use by preparing a series of standards and by making observations on light absorbance. Standards (solutions of known concentration) of the compound of interest are made, treated, and their absorbances (ABS) and concentration values are used to create a Standardization Graph.")
23
Standardization Graph
One reads the graph with the sample's ABS (Y axis), then reads across to the line (graphed relationship). The value below this intersection on the Concentration (X) axis is the compound's concentration in the sample.
, then reads across to the line (graphed relationship). The value below this intersection on the Concentration (X) axis is the compound s concentration in the sample.")
24
Finding the unknown Suppose this graph is generated
The unknown absorbance is 0.500 Find absorbance Across and down The concentration is (or so)
")
Similar presentations


![Scanning spectrophotometry and spectrophotometric determination of concentration BCH 333 [practical]](/19/5905269/big_thumb.jpg "Scanning spectrophotometry and spectrophotometric determination of concentration BCH 333 [practical]>")


