Download presentation
Presentation is loading. Please wait.

1
Worked example: The general trend of this graph is that the higher the GDP the higher the literacy rate. This is a significantly positive correlation. For example Japan has a GDP per capita of $28,000 and a literacy rate of 100%. In contrast to this South Sudan has a GDP of $1050 and very low literacy rate of 35%. On this scatter graph you can also see some anomalous results. For example Jordan has a… Worked example: The general trend of this graph is that the higher the GDP the higher the literacy rate. This is a significantly positive correlation. For example Japan has a GDP per capita of $28,000 and a literacy rate of 100%. In contrast to this South Sudan has a GDP of $1050 and very low literacy rate of 35%. On this scatter graph you can also see some anomalous results. For example Jordan has a… Worked example : The general trend of this graph is that the higher the GDP the higher the literacy rate. This is a significantly positive correlation. For example Japan has a GDP per capita of $28,000 and a literacy rate of 100%. In contrast to this South Sudan has a GDP of $1050 and very low literacy rate of 35%. On this scatter graph you can also see some anomalous results. For example Jordan has a…

3
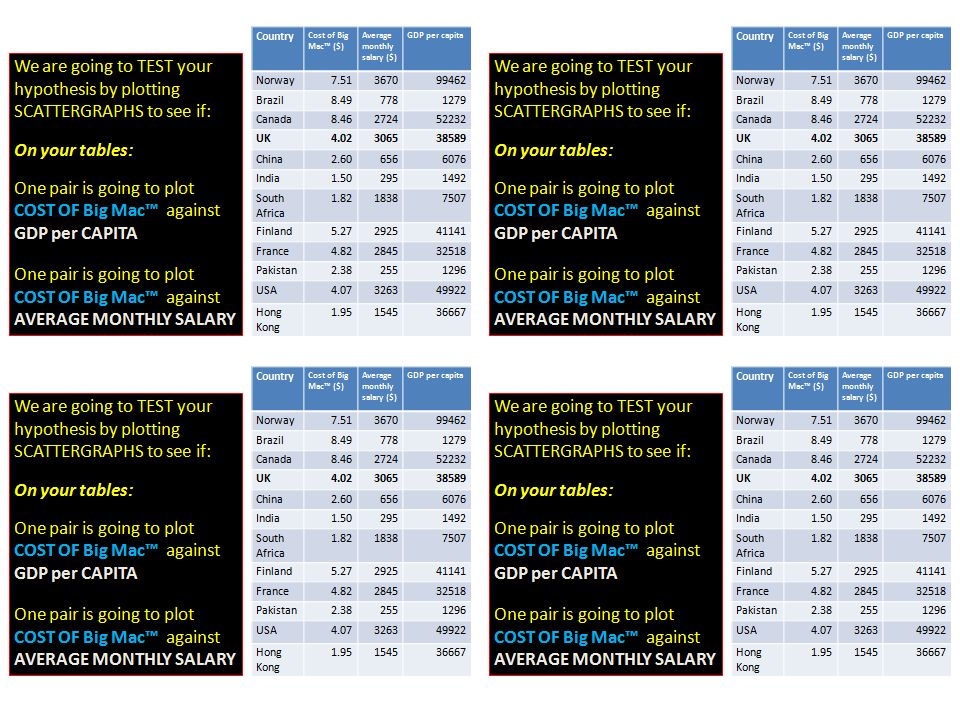
CountryCost of Big Mac™ ($) Illiteracy (%) Life Expectancy (max 100) Motor Vehicles per 1000 Internet Users per 1000 Norway7.51079524346 Brazil8.4914721182 Canada8.46380582513 UK4.02178498423 China2.6014721063 India1.5040641317 South Africa1.82144314558 Finland5.27078486534 France4.82177590366 Pakistan2.3854631110 USA4.07378800551
 Illiteracy (%) Life Expectancy (max 100) Motor Vehicles per 1000 Internet Users per 1000 Norway Brazil Canada UK China India South Africa Finland France Pakistan USA")
Similar presentations


 Life Expectancy in 2005 (Years) India South Africa China Vietnam Mexico Republic of Korea Japan Ethiopia.>")


