Download presentation
Presentation is loading. Please wait.

1
using instrumented aircraft to bridge the observational gap between ICESat and ICESat-2

2
New Suborbital Mission: Operation IceBridge

3
1)IceBridge shall make altimetry measurements that enable determination of surface elevation change to an uncertainty of 10 cm/yr over outlet glaciers of the Greenland and Antarctic ice sheets. 2)IceBridge shall make measurements that enable determination of surface slopes to an uncertainty of 0.5°. 3)IceBridge shall fly at least 250,000 total km per year, with 30,000 km per year specifically along ICESat tracks over sea ice and land ice. 4)IceBridge shall fly at least 500 km per year as underflights along CryoSat-2 tracks over sea ice and land ice. 5)IceBridge shall, for at least two field seasons, make altimetry measurements along a swath of the southern limit of the ICESat tracks, enabling direct comparisons of surface elevations for a large number of ICESat tracks. 6)IceBridge shall make repeat altimetry measurements that enable determination of surface elevations, and surface elevation change, in critical areas where ICESat data are limited or non-existent, including: coastal Greenland, Antarctica’s Pine Island, Thwaites and Crane Glaciers, Amundsen Coast, Antarctic Peninsula, accessible areas of East Antarctica, accessible areas of the South Pole region not surveyed by ICESat
IceBridge shall make measurements that enable determination of surface slopes to an uncertainty of 0.5°. 3)IceBridge shall fly at least 250,000 total km per year, with 30,000 km per year specifically along ICESat tracks over sea ice and land ice. 4)IceBridge shall fly at least 500 km per year as underflights along CryoSat-2 tracks over sea ice and land ice. 5)IceBridge shall, for at least two field seasons, make altimetry measurements along a swath of the southern limit of the ICESat tracks, enabling direct comparisons of surface elevations for a large number of ICESat tracks. 6)IceBridge shall make repeat altimetry measurements that enable determination of surface elevations, and surface elevation change, in critical areas where ICESat data are limited or non-existent, including: coastal Greenland, Antarctica’s Pine Island, Thwaites and Crane Glaciers, Amundsen Coast, Antarctic Peninsula, accessible areas of East Antarctica, accessible areas of the South Pole region not surveyed by ICESat.")
4
7)IceBridge shall make radar measurements that enable mapping and characterization of the bedrock beneath land-based ice as follows: For Greenland: in consideration of existing data, to establish a 100 km by 100 km grid and provide 10 km by 10 km grids over five major outlet glacier catchments. For Antarctica, provide mapping over accessible outlet glaciers that improve numerical models of ice sheet flow according to the priorities in #6. 8)IceBridge shall make gravity measurements that enable the determination of bathymetry beneath ice shelves and sub-ice-sheet bedrock topography that cannot be mapped with radar for five key outlet glaciers in Greenland and accessible portions of Antarctica according to the priorities in #6. 9)IceBridge shall conduct flight experiments that enable the inter-calibration of the flight instruments and the characterization of their errors. 10)IceBridge shall in conjunction with altimetry measurements make measurements to determine the thickness and structure of the snow and firn layer.
IceBridge shall make gravity measurements that enable the determination of bathymetry beneath ice shelves and sub-ice-sheet bedrock topography that cannot be mapped with radar for five key outlet glaciers in Greenland and accessible portions of Antarctica according to the priorities in #6. 9)IceBridge shall conduct flight experiments that enable the inter-calibration of the flight instruments and the characterization of their errors. 10)IceBridge shall in conjunction with altimetry measurements make measurements to determine the thickness and structure of the snow and firn layer..")
5
IceBridge exploits airborne platforms when making altimetry measurements to make other critical measurements to understanding change in polar ice sheets UAF: laser scanner ;UTIG/ICECAP: depth sounder, point laser, photon counter, grav + mag

6
InstrumentPurpose1,5oo ft AGL35,000 ft ATMlaser altimeter (ice surface elevation) 1,500 ft AGL LVISlaser altimeter (ice surface elevation) 35,000 ft DMSdigital photography (DEM generation) MCoRDSbedrock elevation Snow radarsnow thickness Ku-band rad.ice surface elevation Accumulationnear-surface layers Gravimeterwater depth, sub-ice geology, geoid? = low resolution data= possible= impossible

7
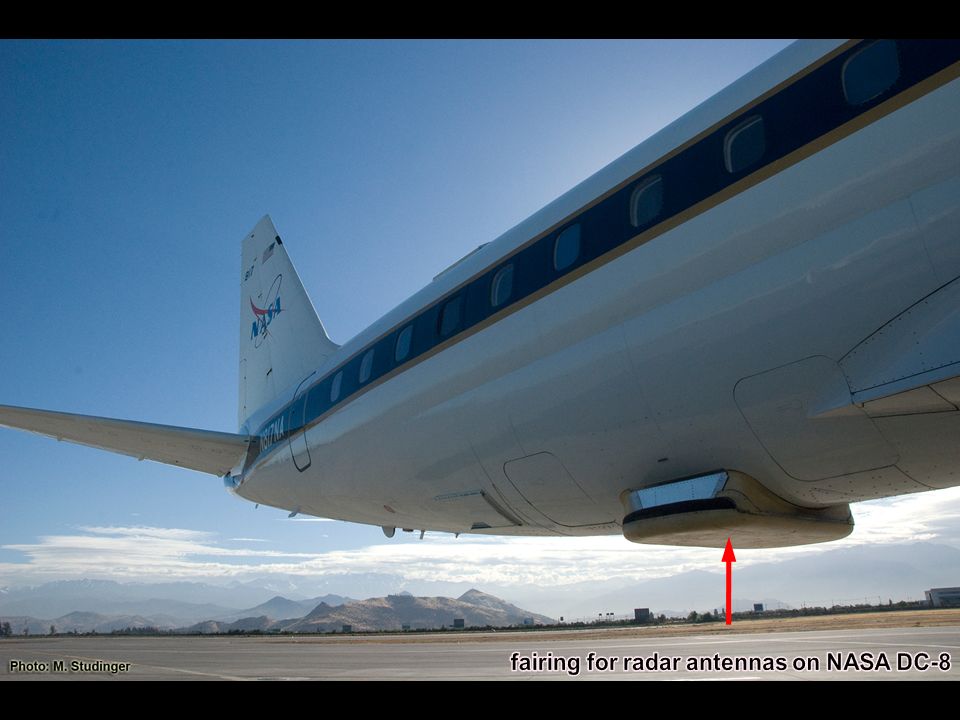
largest external structure ever flown on a P-3 designed, built, and installed in only 3 months

9
InstrumentMeasurementFrequency (Bandwidth) PlatformDeployment MCoRDSIce Thickness Bed Characteristics Bed Imaging Internal Layering 195 MHz (30 MHz)DC-8 P-3 Fall 2009 (DC-8) Spring 2010 (DC-8 and P-3) AccumulationInternal Layering750 MHz (300 MHz)P-3Spring 2010 (P-3) Snow RadarSnow Cover Internal Layering Topography 4.5 GHz (4 GHz)DC-8 P-3 Spring 2009 (P-3) Fall 2009 (DC-8) Spring 2010 (DC-8 and P-3) Ku-BandSnow Cover Topography 14 GHz (4 GHz)DC-8 P-3 Fall 2009 (DC-8) Spring 2010 (DC-8 and P-3) IceBridge Radar Sensors Range resolution in snow, assuming 500 kg/m 3 surface density Greenland 2009Antarctica 2009Greenland 2010 Snow Radar~2.5 cm~5.5 cm~2.5 cm Ku-band~5.3 cm~10.6 cm
 PlatformDeployment MCoRDSIce Thickness Bed Characteristics Bed Imaging Internal Layering 195 MHz (30 MHz)DC-8 P-3 Fall 2009 (DC-8) Spring 2010 (DC-8 and P-3) AccumulationInternal Layering750 MHz (300 MHz)P-3Spring 2010 (P-3) Snow RadarSnow Cover Internal Layering Topography 4.5 GHz (4 GHz)DC-8 P-3 Spring 2009 (P-3) Fall 2009 (DC-8) Spring 2010 (DC-8 and P-3) Ku-BandSnow Cover Topography 14 GHz (4 GHz)DC-8 P-3 Fall 2009 (DC-8) Spring 2010 (DC-8 and P-3) IceBridge Radar Sensors Range resolution in snow, assuming 500 kg/m 3 surface density Greenland 2009Antarctica 2009Greenland 2010 Snow Radar~2.5 cm~5.5 cm~2.5 cm Ku-band~5.3 cm~10.6 cm")
10
Surface Elevation Measurements InstrumentCross-over Analysis of 2009 Antarctic Data Sets ATM5-10 cm for cross-over passes < 3 days (all flights) * LVISPeninsula Flight (1,640 points) † 1 cm ± 23 cm (1σ) Pine Island Glacier (371 points) † 3 cm ± 18 cm (1σ) DMShorizontal resolution and expected vertical resolution potential: better than 20 cm horizontal x 20 cm vertical 1,500 ft = 10 cm pixel size35,000 ft = 2 m pixel size * source: presentation by B. Krabill at Seattle workshop July 2010 † source: presentation by B. Blair at Seattle workshop July 2010 ¶ source: presentation by J. Arvesen at Seattle workshop July 2010 ATM-derived DEM DMS-derived DEM

11
Backup Slides

12
Parametric spectral estimation techniques are used to identify and track the two most prominent spectral component. Top Image: Spectral estimation using FFT. Bottom Image: Parametric spectral estimation.

13
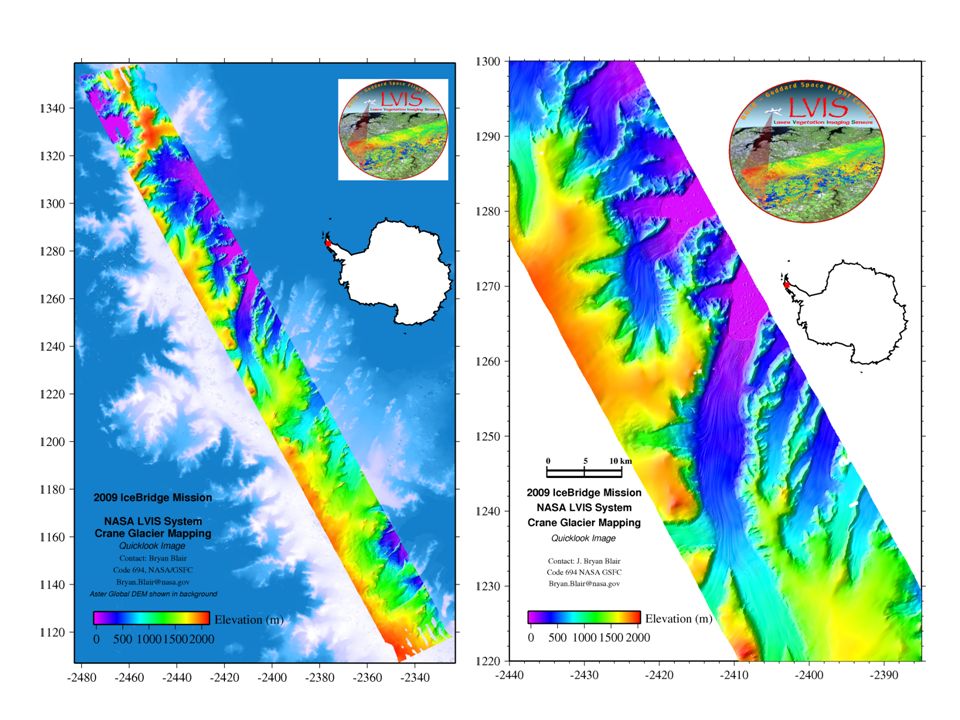
Antarctica 2009 – Pine Island Glacier Snow Radar Ku-Band

16
Snow Radar description

17
Ku-band altimeter description

Similar presentations

 0900 Final Flight selection and prioritization.>")
 Matt King.>")
, all ice sheet (ph. 2) SEC: Surface elevation changes, ERS/Envisat/CryoSat, 1991-2014 GLL: Grounding.>")
 for Snow Thickness Measurements.>")


 Ice Shelf: The Key to Ice-Sheet Stability Global sea level will likely rise 1 meter by 2100.>")

 Joanna Fredenslund.>")

 collected near-surface firn cores and Ultra High Frequency (UHF) Frequency Modulated.>")


