Download presentation
Presentation is loading. Please wait.

1
Chad Entremont Daniel Lamb NWS Jackson, MS
Relationship Between Tornado Debris Signature (TDS) Height and Tornado Intensity Chad Entremont Daniel Lamb NWS Jackson, MS What I hope everyone gets out of this training: The understanding of what a powerful piece of information this is if used properly. Warning operators have never had a tool that can confirm tornadoes much less add the ability to estimate potential tornado intensity. What’s important is what we do with this information and our efforts to make our warnings more effective.
 Height and Tornado Intensity. Chad Entremont. Daniel Lamb. NWS Jackson, MS. What I hope everyone gets out of this training: The understanding of what a powerful piece of information this is if used properly. Warning operators have never had a tool that can confirm tornadoes much less add the ability to estimate potential tornado intensity. What’s important is what we do with this information and our efforts to make our warnings more effective.")
2
Overview Purpose of the study
What defines a tornado debris signature (TDS) Background on the data for the study Results & Findings Example case: Apr 11, 2013 Other TDS research
 Background on the data for the study. Results & Findings. Example case: Apr 11, Other TDS research.")
3
Purpose Initial study - to determine if there is a relationship between TDS height and tornado intensity Results/findings show a strong correlation Can enhance tornado warning wording when lacking spotter/visual confirmation Use “confirmed tornado” wording Impact Based Warnings (IBW) Considerable & Catastrophic Tags Develop a regression equation to provide a “first guess” on tornado intensity An initial study was done in Feb / early Mar 2013 to see if there was a relationship to TDS height and tornado intensity. Results showed a strong correlation. The database was expanded which included TDS events to the end of The added data continued to support the initial findings. Based on the results, warning forecasters now have a tool that can increase confidence and help provide an estimate on the potential intensity of a tornado based off the height of the TDS. This can be used to enhance wording in warnings, especially for the IBW philosophy.
 Considerable & Catastrophic Tags. Develop a regression equation to provide a first guess on tornado intensity. An initial study was done in Feb / early Mar 2013 to see if there was a relationship to TDS height and tornado intensity. Results showed a strong correlation. The database was expanded which included TDS events to the end of The added data continued to support the initial findings. Based on the results, warning forecasters now have a tool that can increase confidence and help provide an estimate on the potential intensity of a tornado based off the height of the TDS. This can be used to enhance wording in warnings, especially for the IBW philosophy.")
4
Motivation Impetus for this study started with dual-pol training from WDTB NWA, Jan presentations on Apr 27, 2011 outbreak and TDS detection Furthered by local training and investigation of the TDS Recent papers by: Dual-Polarization Tornadic Debris Signatures Part I: Examples and Utility in an Operational Setting (Schultz et al ) Tornado Damage Estimation Using Polarimetric Radar (Bodine et al. 2013)
 Tornado Damage Estimation Using Polarimetric Radar (Bodine et al. 2013)")
5
Defining a TDS Identify a valid velocity circulation
Low correlation coefficient (CC) <.90 collocated with circulation Sufficient reflectivity >35 dbZ collocated with # 1 & 2 Lowering of differential reflectivity (ZDR) near 0 Steps 1-3 are critical This process helps avoid “false detections” and is set to build confidence in a true TDS Due to the “split cut” and “continuous doppler” scans DP data for Z & CC are collected at the same time while velocity data lags some seconds. This will cause a slight offset based on the speed of the storm. Level 2 data provides the highest resolution data and its use is recommended.
 <.90 collocated with circulation. Sufficient reflectivity >35 dbZ collocated with # 1 & 2. Lowering of differential reflectivity (ZDR) near 0. Steps 1-3 are critical. This process helps avoid false detections and is set to build confidence in a true TDS. Due to the split cut and continuous doppler scans DP data for Z & CC are collected at the same time while velocity data lags some seconds. This will cause a slight offset based on the speed of the storm. Level 2 data provides the highest resolution data and its use is recommended.")
6
Determining TDS Height (Maximum)
0.5° Apply the same concepts to find the TDS to each elevation slice. As each elevation meets criteria, that sets the max height. Continue up in elevation until criteria is not met. The height where the criteria was last met is the max TDS height. ft

7
Determining TDS Height (Maximum)
0.9° ft ft

8
Determining TDS Height (Maximum)
1.4° ft ft ft

9
Determining TDS Height (Maximum)
1.9° ft ft ft ft

10
Determining TDS Height Hattiesburg, MS
0.5° ft

11
Determining TDS Height Hattiesburg, MS
0.9° ft

12
Determining TDS Height Hattiesburg, MS
1.3° 12,100 ft

13
Determining TDS Height Hattiesburg, MS
1.8° 15,700 ft

14
Determining TDS Height Hattiesburg, MS
2.4° 20,000 ft

15
Determining TDS Height Hattiesburg, MS
3.1° 24,500 ft

16
Determining TDS Height Hattiesburg, MS
4.0° 30,600 ft

17
Dataset Information Data consisted of Sample size n = 181
TDS cases from 2010 to present Central Plains through Florida GR2 Analyst used to analyze the hi-res data Sample size n = 181 54 QLCS cases 127 Supercell cases (3 Tropical ) 5 to 10 cases not used do to poor data and uncertainty in the true TDS height
 5 to 10 cases not used do to poor data and uncertainty in the true TDS height.")
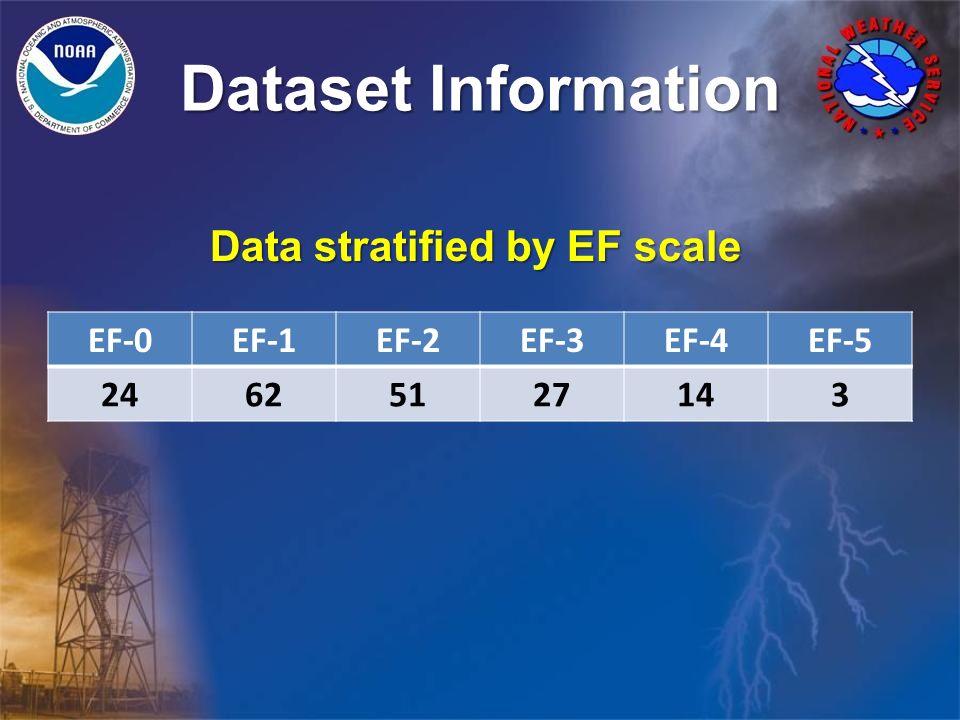
18
Dataset Information Data stratified by EF scale EF-0 EF-1 EF-2 EF-3
24 62 51 27 14 3
19
Scatter Plot All TDS Cases
Scatter plot illustrating where the data falls with respect to max TDS height and distance from RDA. Notice how the weaker tornadoes are more focused within 50 nm and less than 10 kft. Stronger tornadoes are noted at all distances, but primarily above 10 kft. Lastly, the vast majority of TDSs can be seen at ranges of <80 nm.

20
Scatter Plot Supercell vs QLCS
Scatter plot broken down by storm mode. Supercells show distribution at all ranges and heights with the stronger tornadoes focused at heights > 10 kft. For QLCS tornadoes, the distribution is closer to the radar and mostly lower than 10 kft.

21
Percentiles Box (25th – 75th )
")
22
Percentiles Stratified by Storm Mode
Box and whisker plot of max TDS height and corresponding tornado intensity…broken down by storm mode 1) Really hits home the point of how max TDS height has skill in showing tornado intensity 2) Clear delineation for the strong to violent tornadoes (EF2 +) 3) Weak tornadoes (EF0-EF1) show now skill 4) There is some overlap with the EF2-EF3 data 5) QLCS results show an increase in height trend with intensity, but overlap exists
 Really hits home the point of how max TDS height has skill in showing tornado intensity. 2) Clear delineation for the strong to violent tornadoes (EF2 +) 3) Weak tornadoes (EF0-EF1) show now skill. 4) There is some overlap with the EF2-EF3 data. 5) QLCS results show an increase in height trend with intensity, but overlap exists.")
23
Regression R = .76 Regression plot, further illustrates the strong correlation

24
Results Data supports a strong correlation for maximum TDS height vs tornado intensity Especially for strong/violent tornadoes 10 kft is a critical level Stronger correlation exists with supercells than with QLCS type tornadoes More likely to see a TDS from strong/violent tornadoes at greater distance from the radar with a distinct TDS height correlation

25
Results No skill differentiating EF-0 & EF-1
Weaker tornadoes are typically seen within nm of the radar with the max TDS height below 10 kft Regression indicates a solid correlation and provides a “first guess” of tornado intensity based off max TDS height

26
Example Case April 11, 2013 68 mi EF3 Poorly anticipated event
No watch (for the counties effected) Due to lack of spotters/chasers, dual pol data was critical for decision making
 Due to lack of spotters/chasers, dual pol data was critical for decision making.")
27
Example Case April 11, 2013 Tor Warning in effect
TDS 1640z (Tornado started @ 1635z) Mentioned “confirmed tornado” in warning product
 Mentioned confirmed tornado in warning product.")
28
Example Case April 11, 2013 Radar vol scan sequence
Max TDS heights per vol scan: 1640z kft SVS mentioned “confirmed tornado” 1645z kft SVS “confirmed tornado” “possibly strong” 1650z kft Warning team now considering “Tor Emergency”

29
Example Case April 11, 2013 Max TDS height per vol scan: 1654z 14 kft
Vel increase – gtg 115kts 1659z kft Vel increase – gtg 137kts Decision made to upgrade to “Tor Emergency” 1704z kft Best defined TDS (per CC data) Start of the most consistent intense damage (EF3)
 Start of the most consistent intense damage (EF3)")
30
Example Case April 11, 2013 1704z vol scan

31
Example Case April 11, 2013 Summary: Initial TDS was >10 kft
Tornado quickly reached “strong” category TDS >10 kft was maintained for entire path

32
Additional Findings Determining a TDS & max height can be a challenge when close (<15 nm) from radar Due to well defined “hook echo” and lack of sufficient reflectivity associated with WER Process of viewing many (if not all) elevation slices, especially with fast moving lines/cells Dealing with the often “noisy” data, numerous/small radar range bins TDS can reach above 19.5 elev Due to the split cut mode (88D VCP 12 lowest 3 tilts) the TDS has a slight offset from the Vel data (typically 15sec) as the Z, CC scans occur before the Vel scans) * strongly related to storm speed
 elevation slices, especially with fast moving lines/cells. Dealing with the often noisy data, numerous/small radar range bins. TDS can reach above 19.5 elev. Due to the split cut mode (88D VCP 12 lowest 3 tilts) the TDS has a slight offset from the Vel data (typically 15sec) as the Z, CC scans occur before the Vel scans) * strongly related to storm speed.")
33
Additional Findings TDSs typically show up 1-3 vol scans after tornado touchdown Critical height levels (>10kft) are often met 1 vol scan after initial TDS for the stronger tornadoes Slower more erratic moving tornadoes typically make up the cases where TDS height falls below the 25th percentile ZDR often shows the full spectrum of values (+6 to -3 db) within the TDS TDSs may be masked by non-uniform beam filling, makes for an added detection challenge
 are often met 1 vol scan after initial TDS for the stronger tornadoes. Slower more erratic moving tornadoes typically make up the cases where TDS height falls below the 25th percentile. ZDR often shows the full spectrum of values (+6 to -3 db) within the TDS. TDSs may be masked by non-uniform beam filling, makes for an added detection challenge.")
34
Additional Research Incorporate landscape type (forest, urban area etc…) Have started, this is complex May work best where land type is consistent or during the initial stages of the TDS before land types get mixed Continue to add cases to the database Will strengthen the percentile results Make the regression more robust

Similar presentations
 Detection Algorithm was not very robust, and was designed to be a place.>")


![NEXRAD or WSR-88D [Next Generation Radar] [Weather Surveillance Radar, 1988, Doppler]](/13/4044452/big_thumb.jpg "NEXRAD or WSR-88D [Next Generation Radar] [Weather Surveillance Radar, 1988, Doppler]>")


 Region of low radar reflectivities on inflow side of storm o Near the surface High reflectivities.>")
 › Spectrum width is a measure of the velocity dispersion within a sample volume or a measure of the variability.>")


 By: Jeffrey Curtis and Jessica McLaughlin.>")