Download presentation
Presentation is loading. Please wait.

2
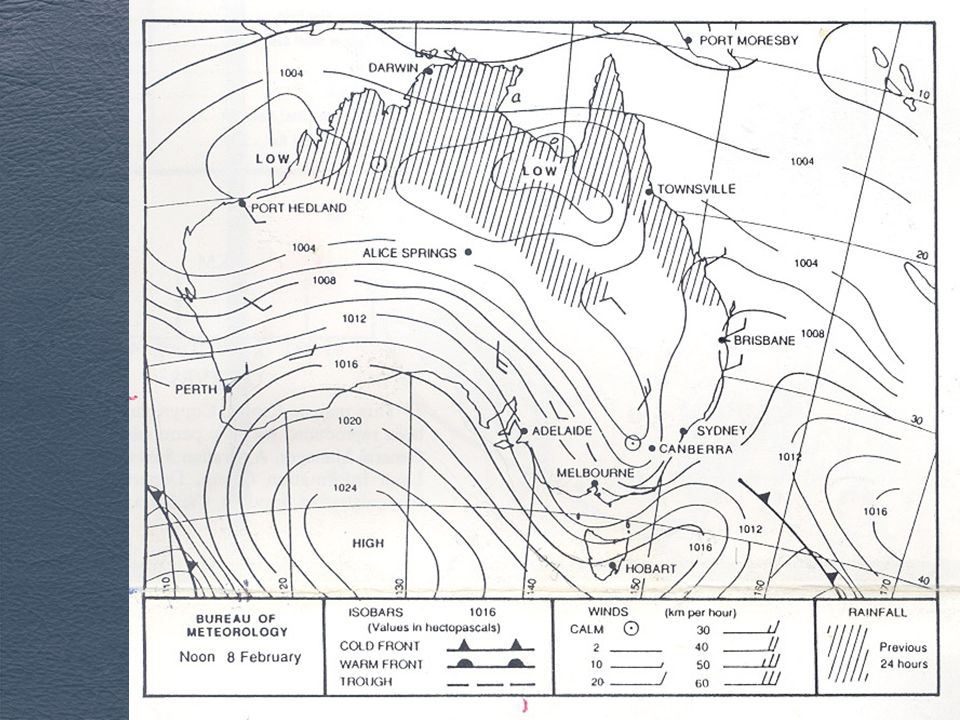
Understanding Synoptic Charts A synoptic chart is another name for a weather map. It is a summary of the weather conditions happening across the earth’s surface at a particular point in time. It gives information about air pressure, wind speed and direction, as well as rainfall.

3
Understanding Synoptic Charts Synoptic charts are helpful in predicting the weather we are likely to experience over the next few days. Being able to understand weather maps is helpful in many ways. For example, it helps to plan our fun activities (like going to the beach and playing sport) as well as work activities (for example farmers and pilots).
 as well as work activities (for example farmers and pilots)..")
4
Isobars Lines that join places of equal pressure. Air pressure is measured in hectopascals (hPa). Isobars are usually drawn at intervals of 2 hectopascals.
. Isobars are usually drawn at intervals of 2 hectopascals..")
5
Wind direction and strength Shown using lines with small barbs or tails. Winds are named according to the direction FROM which they blow. For example, a southerly blows from the south. Winds are strongest when isobars are close together.

6
Low pressure systems Also known as cyclones. They are associated with unstable conditions: cloudy skies, rain and relatively strong winds. Air pressure decreases towards the centre in a low pressure system. Air flows in a clockwise direction towards the centre of the low pressure system (in the southern hemisphere)
.")
7
High pressure systems Also known as anticyclones. They are associated with stable conditions: gentle winds, clear skies and little chance of rain. Air pressure increases towards the centre in a high pressure system. Air flows out from the high pressure system in an anti clockwise direction (in the southern hemisphere)
.")
9
Cold front This forms when a mass of cold air overtakes a slower moving mass of warm air. The warm air is forced to rise and become unstable. As a cold front passes over an area, the temperature is likely to drop, rain may occur and the wind direction may change.

10
When compared with low pressure systems, highs tend to cover a greater area, move more slowly and have a longer life. When interpreting weather maps it is important to remember that weather systems tend to move from: ― west to east across southern Australia ― east to west across northern Australia.

11
Examples of synoptic charts

13
Other ways to determine wind speed Where isobars are close together, wind speed will be greater, likewise when isobars are further apart wind speeds are calmer. Compare these……

16
Link file

Similar presentations


>")
