Download presentation
Presentation is loading. Please wait.

1
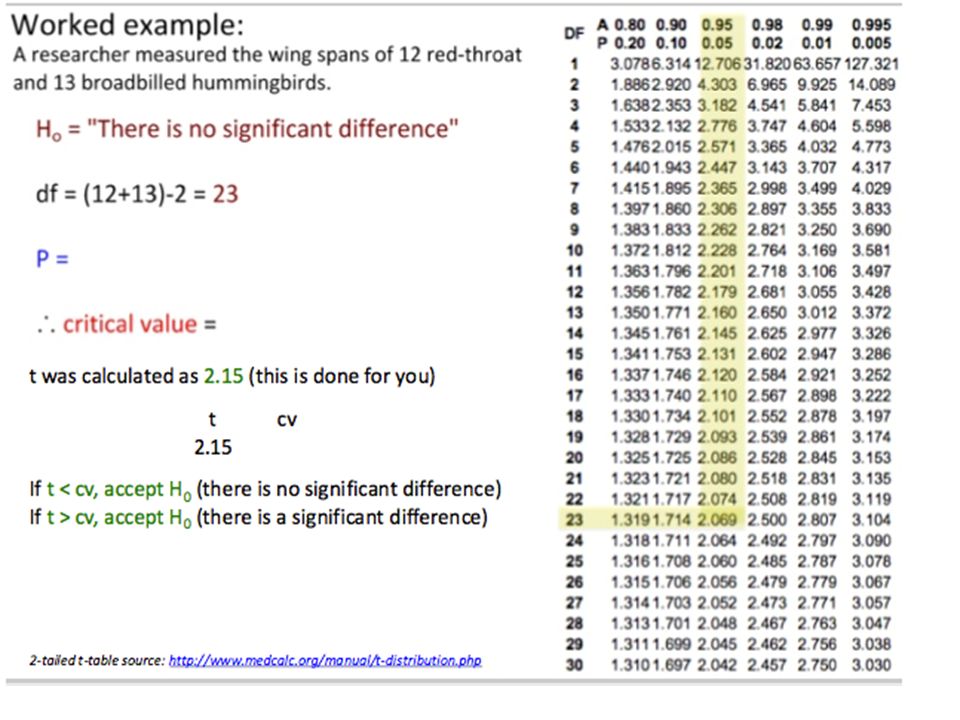
Test for Significant Differences T- Tests

2
T- Test T-test – is a statistical test that compares two data sets, and determines if there is a significant difference between two data sets.

3
T- Test

4
Calculating T-Test To calculate a test test (t-values) you need the following information: – Mean – Standard deviation – Sample size You don’t need to calculate t-values – excel will do it for you.
 you need the following information: – Mean – Standard deviation – Sample size You don’t need to calculate t-values – excel will do it for you.")
5
T-Tables Degrees of freedom (df): Sum of sample sizes minus 2 Probability Values (p-value) – Probably that the difference occurred by chance alone
: Sum of sample sizes minus 2 Probability Values (p-value) – Probably that the difference occurred by chance alone")
6
Degrees of Freedom What is our sample size? 20 What is the degrees of freedom? 20 – 2 =18 Boys Scores Girls Scores 16098 26242 36888 47092 56338 66556 76595 85892 96450 106389

7
What does it all mean? If your sample size is 10 and your t-value is 5.00, what is your probably (p-value) that the difference between two sets occurred by chance? Degrees of freedom (df) = 8 P-value is 0.001 which means there is a 0.1% chance that the difference occurred by chance. Thus the difference between the two data sets is probably statistically significant.
 that the difference between two sets occurred by chance. Degrees of freedom (df) = 8 P-value is which means there is a 0.1% chance that the difference occurred by chance. Thus the difference between the two data sets is probably statistically significant..")
8
Null Hypothesis H 0

9
Significant Differences If you carry out a statistical significance test, such as the t-test, the result is a P value, where P is the probability that there is no difference between the two samples. – A. When there is no difference between the two samples: A small difference in the results gives a higher P value, which suggests that there is no true difference between the two samples

10
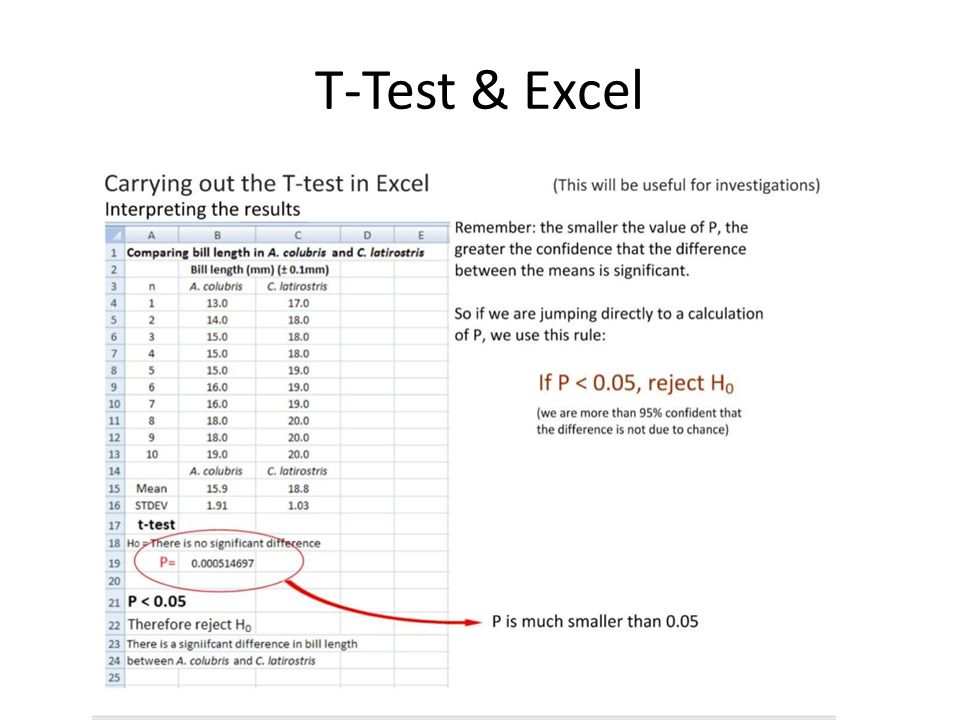
Significant Differences If you carry out a statistical significance test, such as the t- test, the result is a P value, where P is the probability that there is no difference between the two samples. B. When there is a difference between the two samples: – A larger difference in results gives a lower P value, which makes you suspect there is a true difference (assuming you have a good sample size). – By convention, if P < 0.05 you say the result is statistically significant.
. – By convention, if P < 0.05 you say the result is statistically significant..")
11
P-Value Summary

12
P-value & Null Hypothesis In biology the critical probability (P-value) is usually taken as 0.05 (or 5%). This may seem very low, but it reflects the facts that biology experiments are expected to produce quite varied results. If P > 5% then the two sets are the same (i.e. accept the null hypothesis). – Null hypothesis is always A PREDICTION stating that there is no significant differences between data sets. If P < 5% then the two sets are different (i.e. reject the null hypothesis). – Null hypothesis is always A PREDICTION stating that there is no significant differences between data sets.
. – Null hypothesis is always A PREDICTION stating that there is no significant differences between data sets. If P < 5% then the two sets are different (i.e. reject the null hypothesis). – Null hypothesis is always A PREDICTION stating that there is no significant differences between data sets..")
16
T-Test & Excel

19
Your turn. Day 2 Run a T-test comparing the data sets to test to see if you have a significant difference between snail shells in habitats with and without crabs.. Screen shot you excel calculations and insert them into a word document. In an organized table report your p- value, t-value, degrees of freedom. State your null hypothesis. State whether you accept of reject your null hypothesis. Provide a reason for your statement in d. Your reason should include your p- values. Provide a scientific reason for your results.

Similar presentations


 Example: Suppose you have the hypothesis that UW undergrads have higher than the average IQ.>")


 “Dependent-means.>")


.>")
.>")


