Download presentation
Presentation is loading. Please wait.

1
Bellringer Compare and explain in complete sentences what are velocity, speed and acceleration vs time.

2
Previous homework WRITE DOWN THE PROGRESS REPORT ON YOUR SCIENCE PROJECT: WHAT YOU ALREADY DID AND YOU PLAN TO DO

3
Current Homework Graph your motion: distance, velocity, and acceleration for your travel on a bus/car from home to school and back

4
Graphing Motion Every Picture Tells A Story

5
Read and interpret motion graphs Construct and draw motion graphs Determine speed, velocity and accleration from motion graphs

7
If you make a graph by hand it should always be on graph paper. The graph should fill the available space. Carefully choosing the best scale is necessary to achieve this.

9
The graph should always have a title.

10
Always label the x and y axes in 3 ways: title, numerical values, and units.

11
Always make a line graph line graphs are way more handy, because they tell you how one thing changes under the influence of some other variable.

12
X axis The x axis is always the independent variable. If time is one of the measurements being graphed, it always goes on the x-axis. Independent Variable or Manipulated Variable is what you are testing. It is what causes things to change as you make changes to it. Some people nickname it the I-do variable.

13
The y axis is always the dependent variable. Y axis Dependent Variable or the Responding Variable is the effect and it may or may not change. It is observed during as well as at the end of the experiment.

14
Dependent Responing Y-axis Manipulated Independent X-axis D = dependent variable R = responding variable Y = graph information on the vertical axis M = manipulated variable I = independent variable X = graph information on the horizontal axis

15
Example of a Bad Graph There's no title. What's it a graph of? Who knows? There are no labels on the x or y axis. What are those numbers? Who knows? There are no units on the x or y axis. Is this a graph of speed in miles per hour or a graph of temperature in Kelvins? Who can tell?

16
What’s wrong with this graph? There's no title. What's it a graph of? Who knows? There are no increments on the axes, and there are no gridlines. There are no labels on the x or y axis. What are those numbers? Who knows? There are no units on the x or y axis. What size are the numbers: kilo-, centi-, or milli- ?

18
Numerical measure of a line's incline relative to the horizontal. In analytic geometry, the slope ofanalytic geometry any line, ray, or line segment is the ratio of the vertical to the horizontal distance between any two points on it (“slope equals rise over run”). Definition of slope
. Definition of slope.")
19
Positive slope Zero slope Negative slope Velocity is positive when the object moves in the positive direction. Since the position value is increasing, the graph slopes upward. Velocity is zero when the position does not change. This line has zero slope. Velocity is negative when the object moves In the negative direction on the Axis system. This line has a negative Slope. A displacement – time graph with time along x axis and displacement on the y axis.

20
Types of Motion Graphs Distance vs Time Position vs Time Velocity vs Time Acceleration vs Time

21
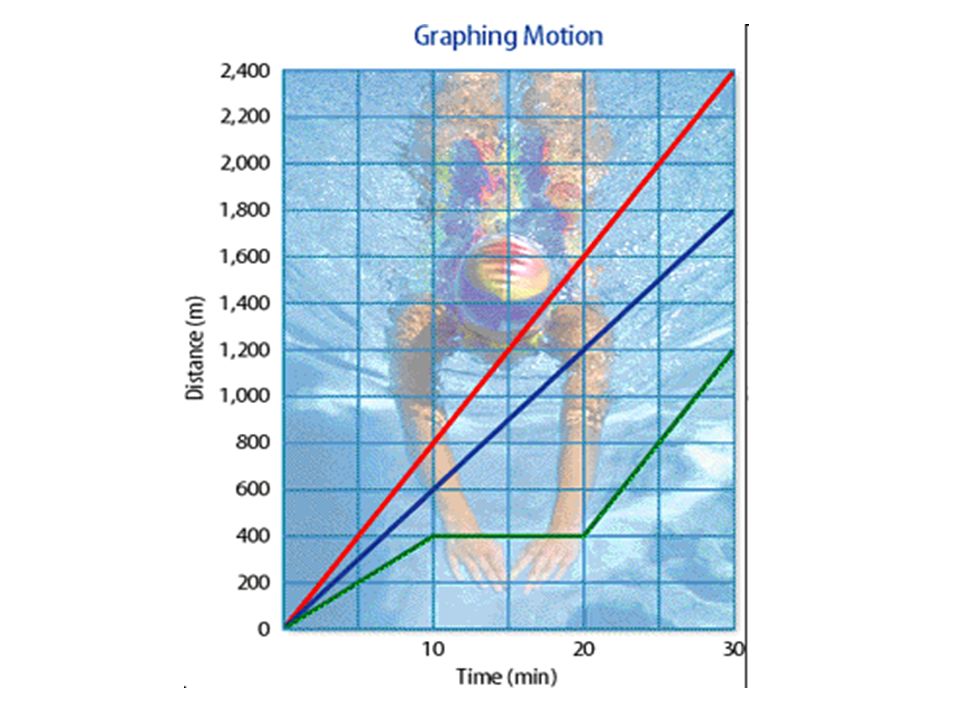
Distance vs Time Graphs Speed is the distance an object travels per unit of time. You can graphically represent the speed or an object using a distance-time graph.

24
If the speed is constant, then the slope is constant (straight line).
.")
25
Constant Speed A constant speed graph shows a constant & positive slope A uniform distance is covered for each unit of time.

26
The steeper the slope, the faster the speed.

28
If the speed is changing, then the slope is changing (curve).
.")
29
Describe the motion in each section of the graph. Decelerating Accelerating Stopped Steady speed

30
Position vs time Graphs of Constant motion Position vs. time graphs give you an easy and obvious way of determining an object’s displacement at any given time, and a subtler way of determining that object’s velocity at any given time.

32
A position-time graph, is one in which position is Plotted on the y-axis and the time is on the x-axis. A position-time graph is similar to a distance-time Graph but has direction on the y-axis.

33
Although distance-time and position-time graphs can show Similar graphs, this is not always the case. Below is a graph of a person who walked to a nearby store (10 km north) and back to the original reference point, this would mean the total travelled distance is 20 km (10 km to the store and 10 km back). The distance-time graph is on the left.
 and back to the original reference point, this would mean the total travelled distance is 20 km (10 km to the store and 10 km back). The distance-time graph is on the left..")
34
The position-time graph looks different because the position changed when the person turned back from the store back to the original reference point.

35
Looking at the slope of a distance vs time or a position vs time graph... Slope = Velocity As slope goes, so does velocity.” If the speed is constant, then the slope is constant (straight line). If the speed is changing, then the slope is changing (curve). If the velocity is positive, then the slope is positive (moving upward, towards the right). If the velocity is negative, then the slope is negative (moving downward, towards the right). The steeper the line/curve, the faster the speed.
. If the speed is changing, then the slope is changing (curve). If the velocity is positive, then the slope is positive (moving upward, towards the right). If the velocity is negative, then the slope is negative (moving downward, towards the right). The steeper the line/curve, the faster the speed..")
36
Reading and interpreting position-Time graphs

38
s vs t - The object is standing still at a positive location. Time is going by but the position is not changing. Since the slope equals zero it has no movement.

39
s vs t - the object is traveling at a constant positive velocity. The locations of its position are increasingly positive.

40
s vs t - the object is traveling at a constant positive velocity but is traveling through a negative region.

41
s vs t - this slope represents a constant negative velocity since the object is traveling in a negative direction at a constant rate. Notice that the locations of its position are becoming less and less positive

42
s vs t - the object is traveling at a constant negative velocity through a negative region. The locations of its position are increasingly negative.

43
The meaning of slope on a position-time graph! If calculated properly, it shows the velocity of the motion.

44
In this graph Car A moves for 5 seconds a distance of 10 meters. How can we figure out the velocity of the car from the graph? We can use the formula for the slope of a line to get the velocity.

46
Any point on this graph shows the position of the ant at a particular moment in time.

47
The point at (2,–2) show that, two seconds after it started moving, the ant was two centimeters to the left of its starting position. The point at (3,1) shows that, three seconds after it started moving, the ant is one centimeter to the right of its starting position.
 shows that, three seconds after it started moving, the ant is one centimeter to the right of its starting position..")
48
For the first two seconds, the ant is moving to the left. The next second, it reverses its direction and moves quickly to y = 1. The ant then stays still for three seconds before it turns left again and moves back to where it started.

49
For any position vs. time graph, the velocity at time t is equal to the slope of the line at time t. In a graph made up of straight lines, like the one for the ant, the slope can easily be calculated at each point on the graph to show the instantaneous velocity at any given time.

50
Determine the ant’s instantaneous velocity at any given point during the trip. Remember the instantaneous velocity shows the velocity of the ant at one point. The ant is cruising along at the fastest speed between t = 2 and t = 3, because the position vs. time graph is steepest between these points.

51
Calculate the ant’s average velocity during this time interval is a simple matter of dividing rise by run. Remember average velocity is the total displacement divided by the total time. The average velocity here is zero because the total diaplacement is zero. 0/7 = 0 m/s

52
Stage 1: The car moves forwards from the origin to in the first 5 s. Calculate the velocity for the car after the first five seconds.

53
Stage 2: The car moves backwards, passes the origin, to in the next 5 s. Calculate the velocity of the car between five and ten seconds.

54
Stage 3: The car remains at rest in the last 5 s. Calculate the velocity of the car for the last five seconds.

55
Different Slopes Run = 1 hr Rise = 0 km Rise = 2 km Rise = 1 km Slope = Rise/Run = 1 km/1 hr = 1 km/hr Slope = Rise/Run = 0 km/1 hr = 0 km/hr Slope = Rise/Run = 2 km/1 hr = 2 km/hr

Similar presentations