Download presentation
Presentation is loading. Please wait.

1
The Practice of Statistics Third Edition Chapter 8: The Binomial and Geometric Distributions 8.1 The Binomial Distribution Copyright © 2008 by W. H. Freeman & Company Daniel S. Yates

2
8.1 The Binomial Distribution 1.What are the conditions for the Binomial Setting? 2.What is the Binomial Distribution Notation? 3.How do you compute the probability of a value of X using the Binomial Distribution? 4.How do you find the means and standard deviation of the Binomial Distribution?

3
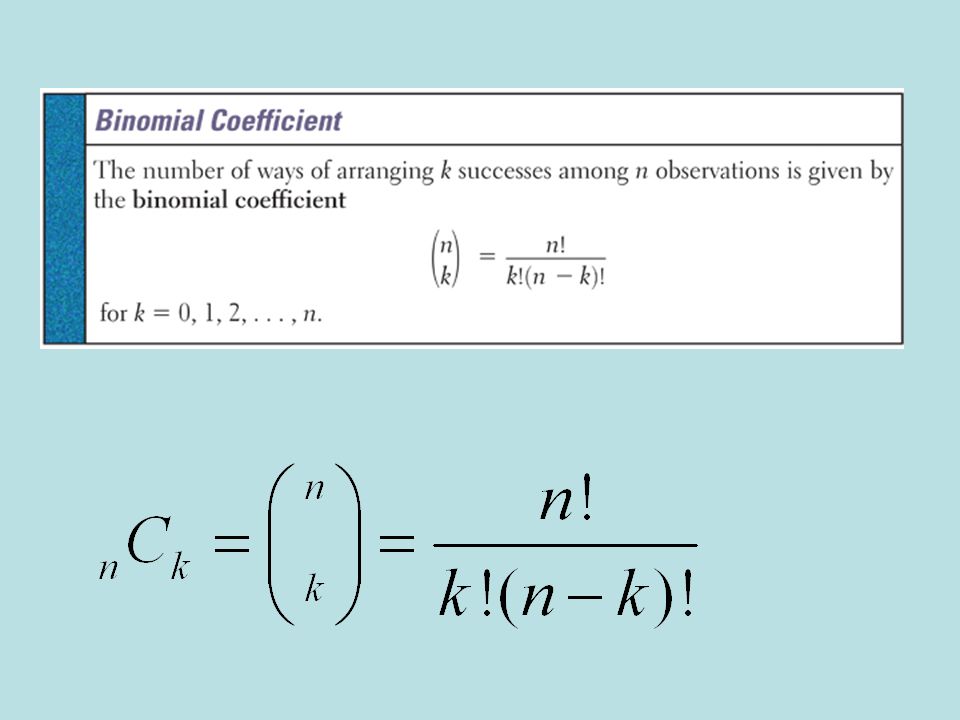
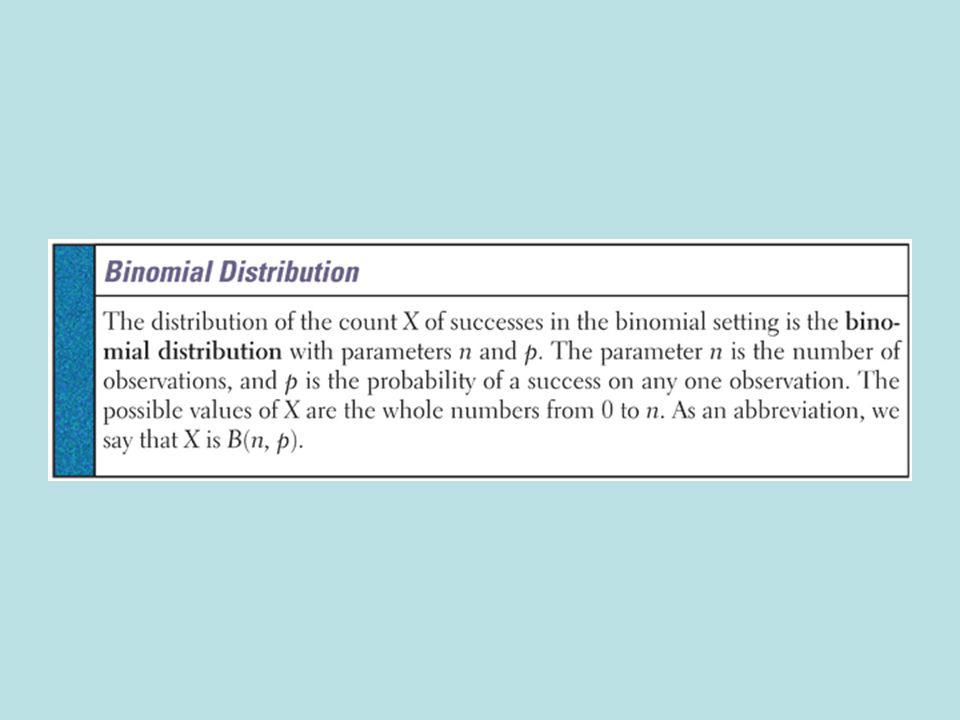
The Binomial Distribution Properties of a Binomial Experiment 1.It consists of a fixed number of observations called trials. 2.Each trial can result in one of only two mutually exclusive outcomes labeled success (S) and failure (F). 3.Outcomes of different trials are independent. 4.The probability that a trial results in S is the same for each trial. The binomial random variable X is defined as X = number of successes observed when experiment is performed The probability distribution of X is called the binomial probability distribution.
 and failure (F). 3.Outcomes of different trials are independent. 4.The probability that a trial results in S is the same for each trial. The binomial random variable X is defined as X = number of successes observed when experiment is performed The probability distribution of X is called the binomial probability distribution..")
4
Determining Binomial Conditions Turn to Page 516 and work problems 8.1 through 8.4 Answers –8.1 Not binomial. No fixed number of trials, different types of defects, and different probabilities. –8.2 Yes. –8.3 Yes. –8.4 Not binomial. No fixed number of trials.

7
Shorthand Normal distributions can be described using the N(µ,σ) notation; for example, N(65.5,2.5) is a normal distribution with mean 65.5 and standard deviation 2.5. Binomial distributions can be described using the B(n,p) notation; for example, B(5,.85) describes a binomial distribution with 5 trials and.85 probability of success for each trial.
 notation; for example, B(5,.85) describes a binomial distribution with 5 trials and.85 probability of success for each trial..")
8
Example Blood type is inherited. If both parents carry genes for the O and A blood types, each child has probability 0.25 of getting two O genes and so of having blood type O. Different children inherit independently of each other. The number of O blood types among 5 children of these parents is the count X off successes in 5 independent observations. How would you describe this with “B” notation? X=B(5,.25)
.")
10
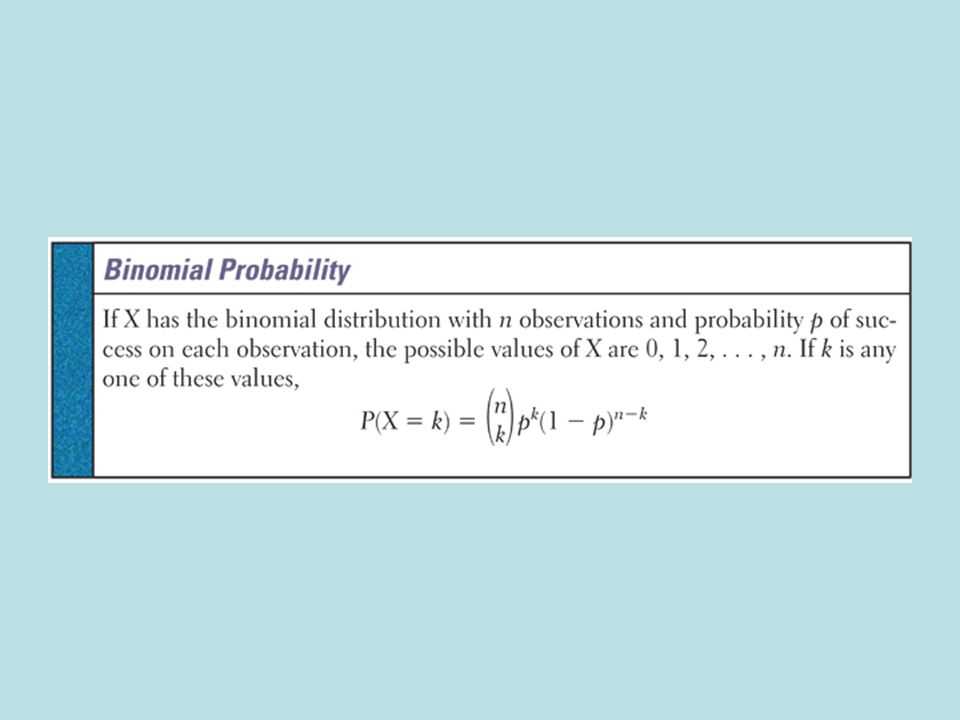
The Binomial Distribution Let n = number of independent trials in a binomial experiment p = constant probability that any particular trial results in a success. Then

11
0.2270)4(.)6 !5!7 !12 )7(p 57 Example The adult population of a large urban area is 60% black. If a jury of 12 is randomly selected from the adults in this area, what is the probability that precisely 7 jurors are black. Clearly, n=12 and p =.6, so

12
Example - continued The adult population of a large urban area is 60% black. If a jury of 12 is randomly selected from the adults in this area, what is the probability that less than 3 are black. Clearly, n = 12 and p = 0.6, so

13
Another Example a)What is the probability that exactly two will respond favorably to this sales pitch? On the average, 1 out of 19 people will respond favorably to a certain telephone solicitation. If 25 people are called,

14
Classwork Turn to Page 519 and work problems 8.7 through 8.9.

15
Cumulative Binomial Probability The cumulative distribution function (cdf) of X calculates the sum of the probabilities of 0, 1, 2, … up to a value of X. In other words, it calculates the probability of obtaining at most X successes in n trials. Calculator command binomcdf(n, p, k) = P(X≤ k).
 = P(X≤ k)..")
16
Classwork Turn to page 524 and work problem 8.14

17
Mean & Standard Deviation of a Binomial Random Variable The mean value and the standard deviation of a binomial random variable are, respectively,

18
Example A professor routinely gives quizzes containing 50 multiple choice questions with 4 possible answers, only one being correct. Occasionally he just hands the students an answer sheet without giving them the questions and asks them to guess the correct answers. Let x be a random variable defined by x = number of correct answers on such an exam Find the mean and standard deviation for x

19
Example - solution The random variable is clearly binomial with n = 50 and p = ¼. The mean and standard deviation of x are

20
Binomial Distribution versus The Normal Distribution Central Limit Theorem Binomial Applet

21
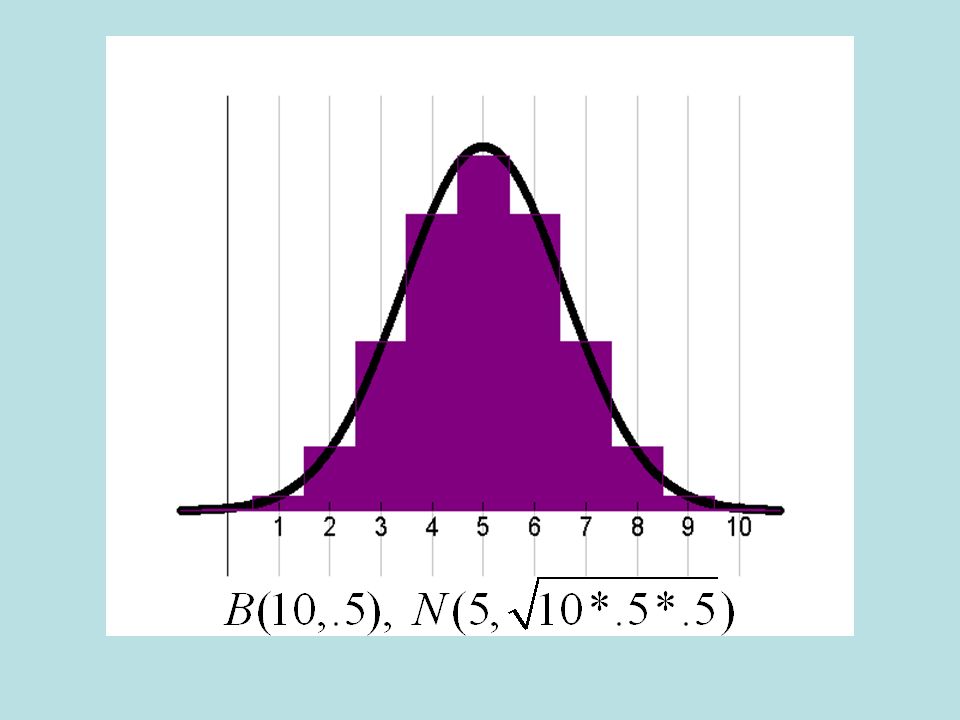
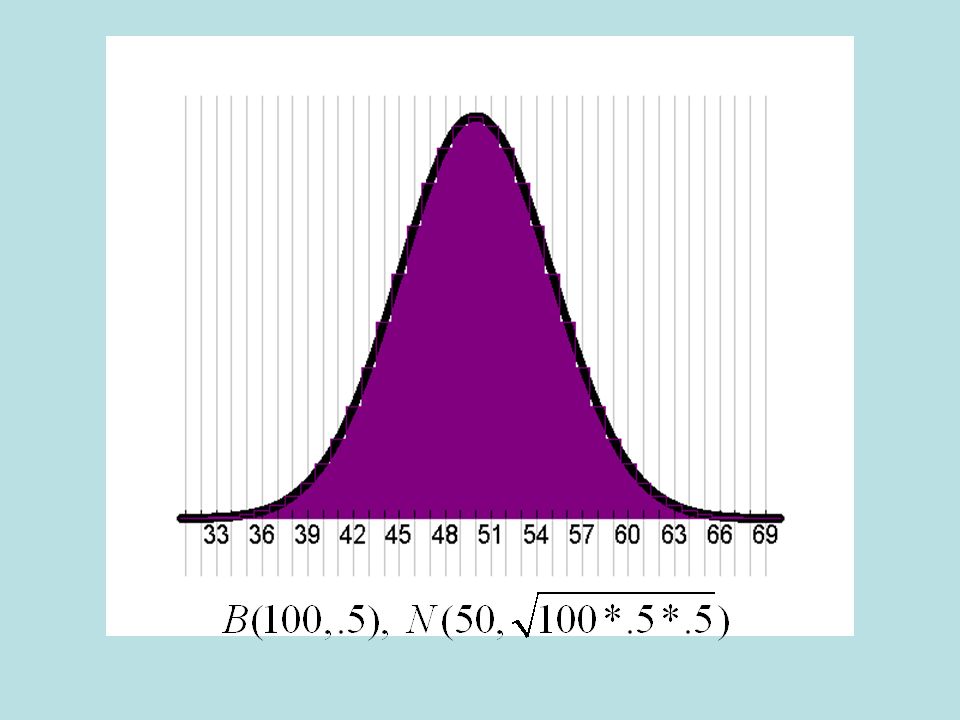
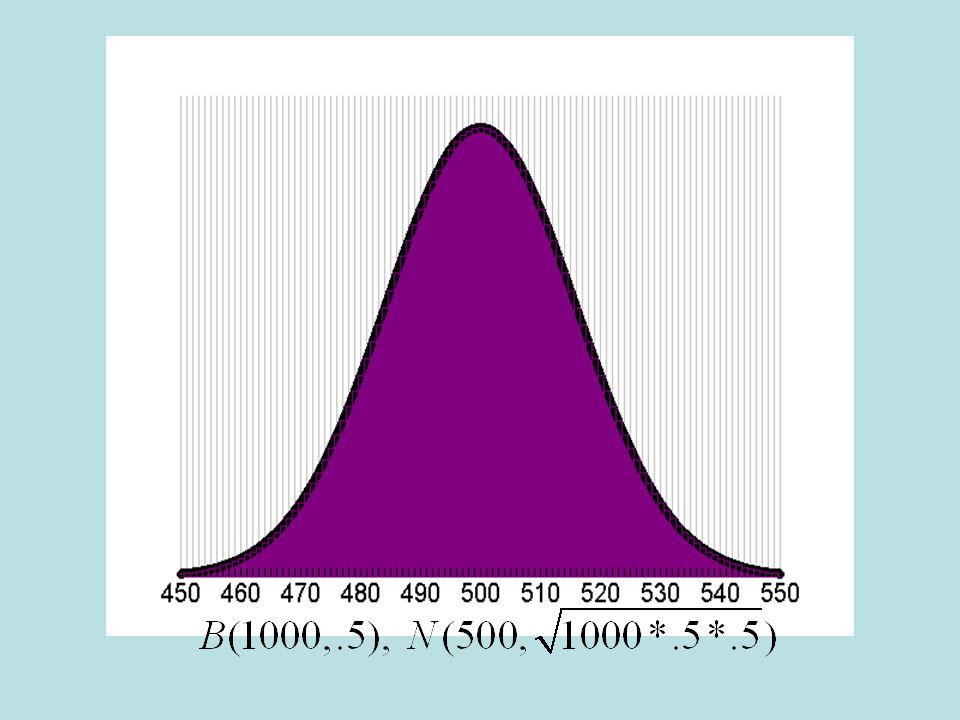
As n gets large The next three slides will show you a comparison of the binomial distribution to a normal density curve.

25
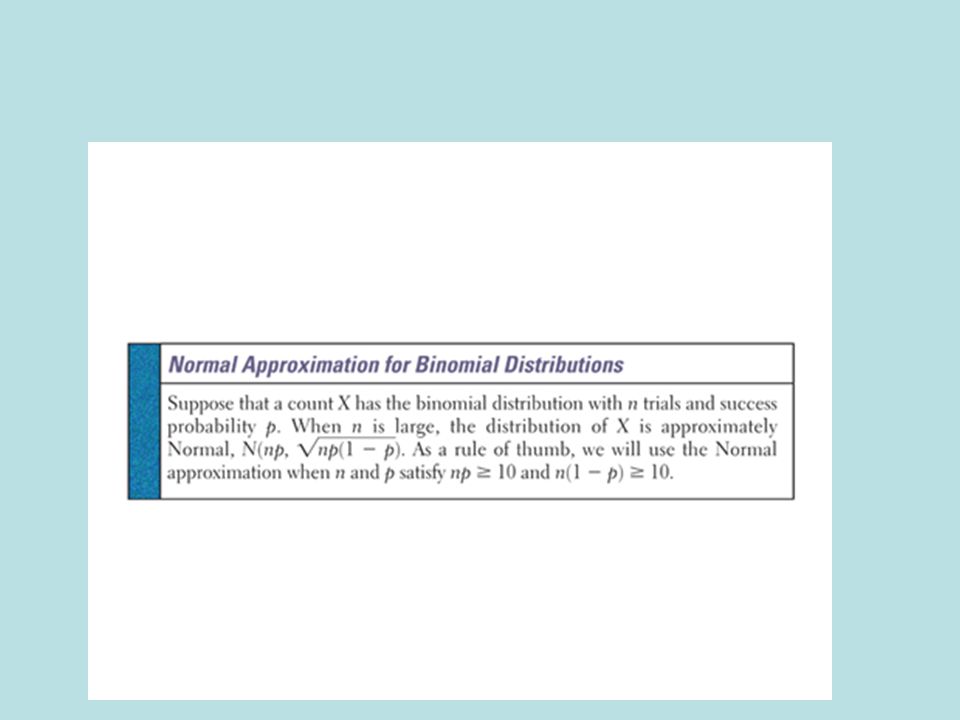
Conclusion about the Normal Distribution When n is large, the distribution of X is approximately Normal. As a rule of thumb, we will use the Normal approximation when n and p satisfy: np ≥ 10 and n(1 – p) ≥ 10
 ≥ 10.")
27
Additional cautions with the Normal approximation The accuracy of the Normal approximation improves as the sample size n increases. It is most accurate when p is close to ½ and least accurate when p is near 0 or 1. It is not accurate when the distribution is skewed. When to use the Normal approximation depends on how accurate your calculations need to be.

28
Classwork Turn to page 529, work problems 8.22 and 8.24.

Similar presentations


 THE BINOMIAL DISTRIBUTION (BINOMIAL FORMULAS)>")


