Download presentation
Presentation is loading. Please wait.

1
Data Warehouses and Dashboard – A Primer Mr. Tod R. Massa Director, Policy Research & Data Warehousing, State Council of Higher Education for Virginia Dr. Dave Oehler Director of Assessment, Information and Analysis, Northwest Missouri State University

2
5/10/20052 Presentation Overview Data Warehousing Goals of data warehousing Components of a data warehouse Data flow Dashboards Goals of dashboards Components of dashboards “Drilling down”

3
5/10/20053 Presentation Overview Data Warehousing Goals of data warehousing Components of a data warehouse Data flow Dashboards Goals of dashboards Components of dashboards “Drilling down”

4
5/10/20054 What is a Data Warehouse? Definition/use: A repository of data, frozen in time Scrubbed/cleansed Some portions captured “as is” Some portions massaged to facilitate faster computation/reporting

5
5/10/20055 Goals of Data Warehousing GOAL 1: Accessible information Intuitive and self-describing Labeled appropriately “Slicing and dicing” Minimal wait times

6
5/10/20056 Goals of Data Warehousing GOAL 2: Consistent information Carefully collected from multiple operational sources Cleansed and quality assured Common definitions Unique describing labels

7
5/10/20057 Goals of Data Warehousing GOAL 3: Flexible during change Designed to handle change Avoids invalidating existing data Minimal disruptions in existing applications and data Accountable for changes

8
5/10/20058 Goals of Data Warehousing GOAL 4: Secured information “Crown Jewels” Usually contains sensitive business information Must effectively manage access

9
5/10/20059 Goals of Data Warehousing GOAL 5: Improved decision-making Data needed to make decisions Supply evidence to improve decisions Decision Support System

10
5/10/200510 Goals of Data Warehousing GOAL 6: Accepted among the organization Extent of deployment after training Meeting the needs of management Use of system to make business decisions

11
5/10/200511 Presentation Overview Data Warehousing Goals of data warehousing Components of a data warehouse Data flow Dashboards Goals of dashboards Components of dashboards “Drilling down”

12
5/10/200512 Components Operational source systems Student information systems Financial information systems Alumni information systems Human resource information systems Other shadow information systems

13
5/10/200513 Components - Operational Data Store Elements Considered Existing reports Existing dashboard displays Future research interests Collection cycles Census End of Term Completions Cleanse Data Including codes/descriptions Converting/Keeping operational code values Data similarities storage structure reporting usage Documentation

14
5/10/200514 Components Data staging area (ETL) Extract Collect data records from operation information systems Transform Massage data records (cleanse, combine, de- duplicate) Load Populating data records in the warehouse
 Extract Collect data records from operation information systems Transform Massage data records (cleanse, combine, de- duplicate) Load Populating data records in the warehouse")
15
5/10/200515 Components Data presentation Area accessible by management Integrated data marts (common dimensions and facts) Usually presented, stored, and accessed through dimensional schemas Contains detailed atomic data Operational by management
 Usually presented, stored, and accessed through dimensional schemas Contains detailed atomic data Operational by management")
16
5/10/200516 Presentation Overview Data Warehousing Goals of data warehousing Components of a data warehouse Data flow Dashboards Goals of dashboards Components of dashboards “Drilling down”

17
5/10/200517

18
5/10/200518

19
What is measured gets noticed What is noticed gets acted on What is acted on gets improved This and the following slide were adapted from a Dee W. Hook presentation. Phenomenon of Measurement

20
5/10/200520 Presentation Overview Data Warehousing Goals of data warehousing Components of a data warehouse Data flow Dashboards Goals of dashboards Components of dashboards “Drilling down”

21
5/10/200521 What is a Dashboard? Definition/use: Both a process and a tool Looking for unfavorable trends or patterns and focusing energy on improving priority areas A (diagnostic) means for monitoring performance to ascertain what is working well and where additional attention is needed A few (4-6) sets of indicators, representing the most central areas related to high performance
 means for monitoring performance to ascertain what is working well and where additional attention is needed A few (4-6) sets of indicators, representing the most central areas related to high performance.")
22
5/10/200522 How Does a Dashboard Focus Activities and Processes? Requires clear definition of outcomes Focuses on a manageable (small) set of key outcomes (results) Encourages cross-functional communication Requires fact-based decision processes Data reporting structures Process improvement orientation Layering of detail (summative vs. formative)
 set of key outcomes (results) Encourages cross-functional communication Requires fact-based decision processes Data reporting structures Process improvement orientation Layering of detail (summative vs. formative).")
23
5/10/200523 Dashboards help you know what’s important Dashboards focus on actions that make a difference Collect data to create information you can use, then use it Time is Increasingly a Precious Resource

24
5/10/200524 Assessment needs to answer questions Systems to collect, analyze, and report information need to be developed to support the specific information requirements Data for Decision-making

25
5/10/200525 Assessment System Design 1. Data Collection Centralized measures Decentralized measures 3. Reporting Systems Summative Information Formative Information 2. Data Processing Disaggregation system Aggregation system No transformation 4. Analysis/Decision-making Cabinet, Deans, Directors, Department Chairs Department Chairs, Faculty

26
Data Collection Reporting Systems Analysis and Decision-making Centralized Decentralized Disaggregation System Aggregation System Summative Information (Dashboards, Profiles) Formative Information (Operational) Cabinet, Governing Board, External Audiences Directors, Department Chairs, Faculty, Staff No Transformation Deans, Directors, Department Chairs No Transformation Directors, Department Chairs Much Little Detail Data Processing
 Formative Information (Operational) Cabinet, Governing Board, External Audiences Directors, Department Chairs, Faculty, Staff No Transformation Deans, Directors, Department Chairs No Transformation Directors, Department Chairs Much Little Detail Data Processing")
27
5/10/200527 Presentation Overview Data Warehousing Goals of data warehousing Components of a data warehouse Data flow Dashboards Goals of dashboards Components of dashboards “Drilling down”

28
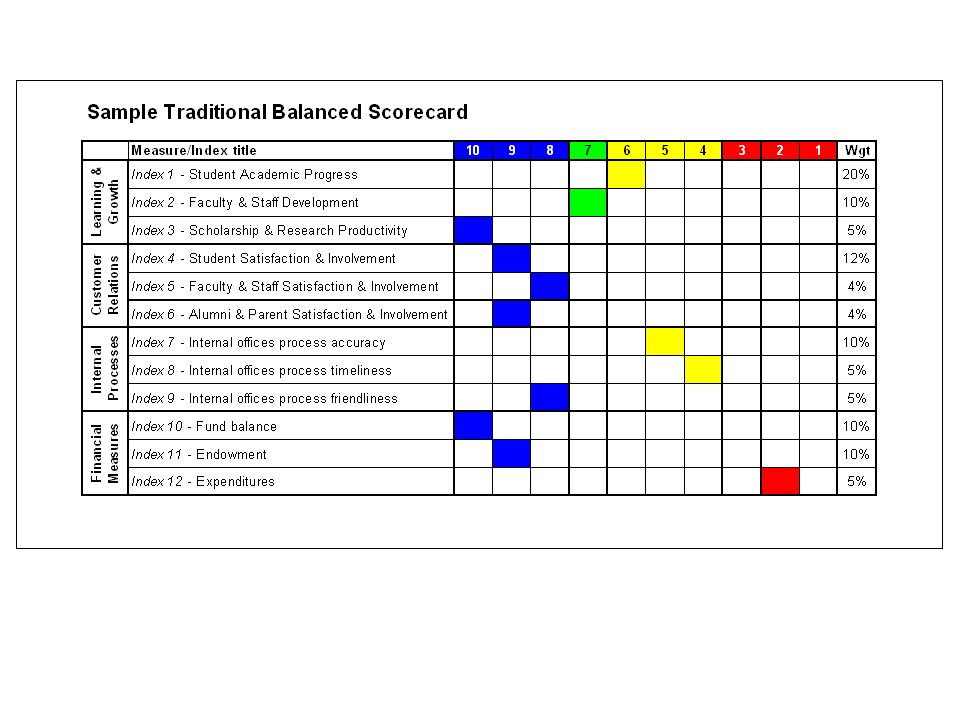
5/10/200528 What Metrics are in a Dashboard? The Dashboard includes a balanced view of an organization Learning and Growth (student academic progress; faculty and staff development, scholarship and research productivity) Customer Relations (students, faculty, staff, alumni, parent satisfaction and involvement) Internal Processes (functional area performance – accuracy, timeliness, friendliness) Financial Measures (fiscal health and viability)
 Customer Relations (students, faculty, staff, alumni, parent satisfaction and involvement) Internal Processes (functional area performance – accuracy, timeliness, friendliness) Financial Measures (fiscal health and viability).")
31
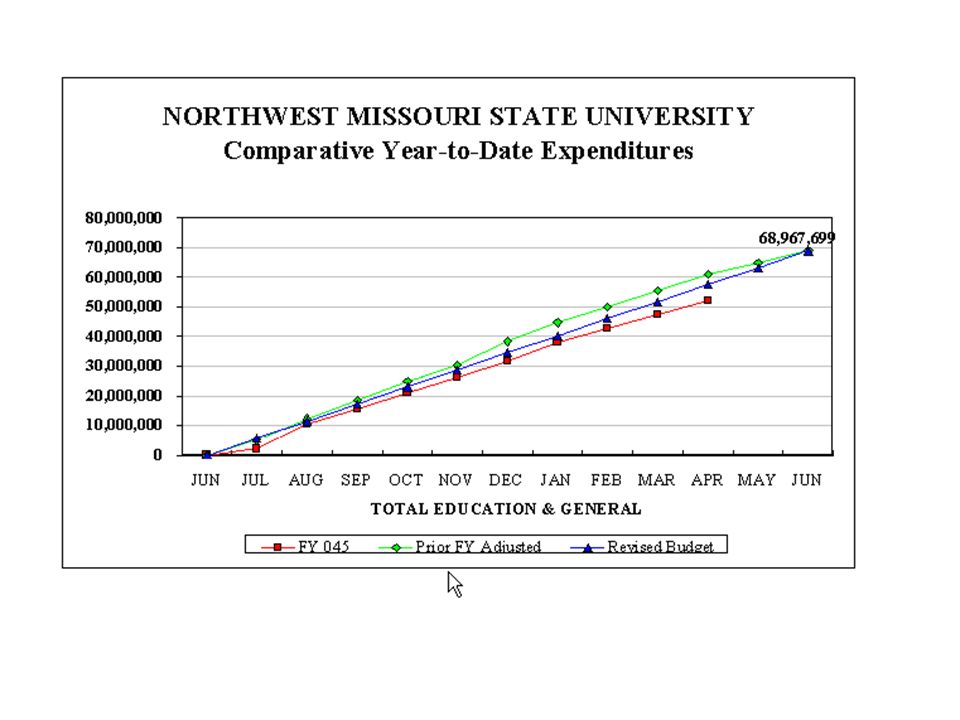
5/10/200531 Northwest’s Dashboard Model Our model includes several types of information/report presentations Dashboards – single screen current status Trend charts – key data element trends over time Data tables –key data detail trends over time Majors, minors, advisees, degrees, SCH, financials Special interest charts/tables

32
5/10/200532 Features of the Northwest Balanced Scorecard System Dashboard “lights” to indicate current status Hyperlinks to navigate through workbooks Hyperlinks to “drill down” to detail Comparative data links for setting targets Real-time data updates Accommodates various data sources Modular design to facilitate upgrading Automated updating of modules

34
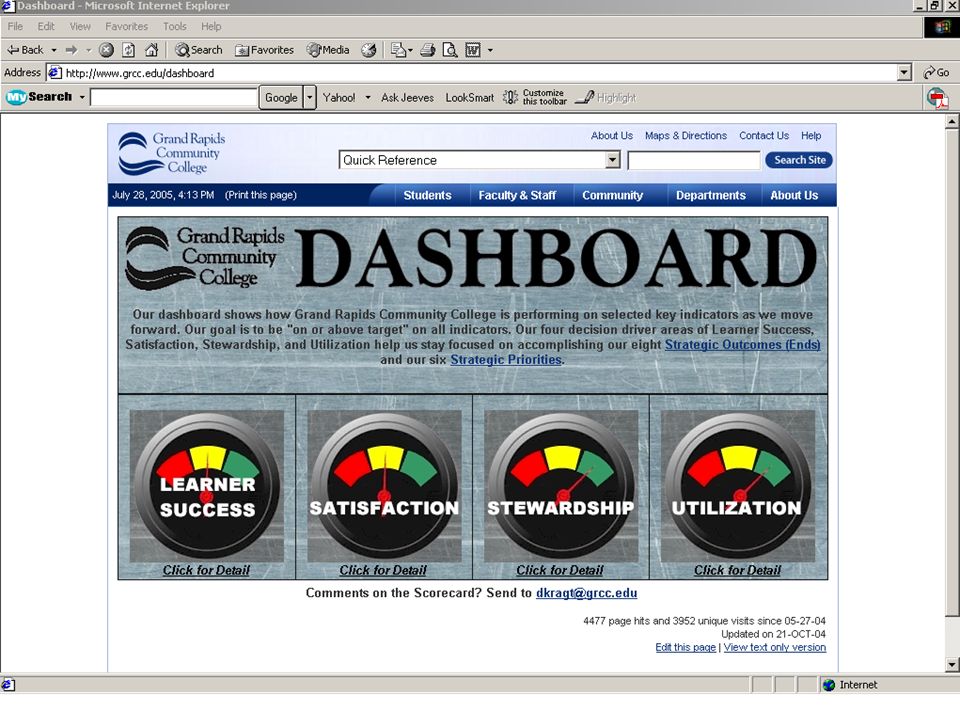
5/10/200534 President’s Dashboard General Dashboard categories: Student Success Satisfaction Enrollment Financials Additional monitoring category: Strategic Initiative Achievement

35
President’s Dashboard

36
5/10/200536 Provost’s Dashboard General Dashboard categories: Student Academic Performance Student Satisfaction Student Success and Placement Academic Workload Additional monitoring category: Strategic Initiative Action Plan Progress

37
Provost’s Dashboard

38
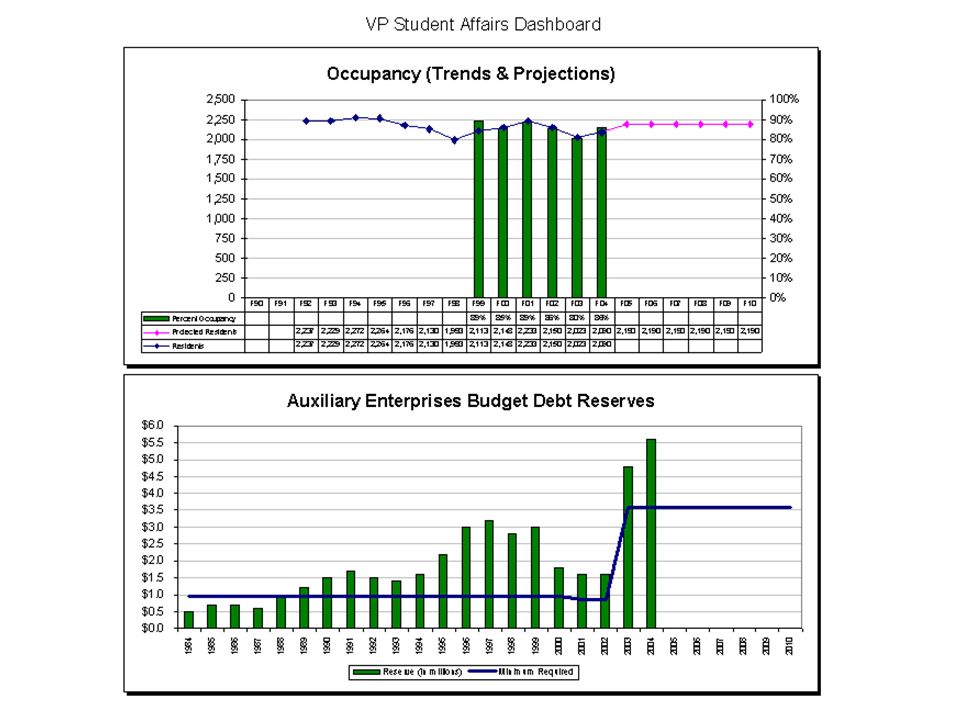
5/10/200538 VP Student Affairs Dashboard General Dashboard categories: Student Engagement Student/Stakeholder Satisfaction Auxiliary (financial)
")
39
VP Student Affairs’ Dashboard

40
5/10/200540 Presentation Overview Data Warehousing Goals of data warehousing Components of a data warehouse Data flow Dashboards Goals of dashboards Components of dashboards “Drilling down”

41
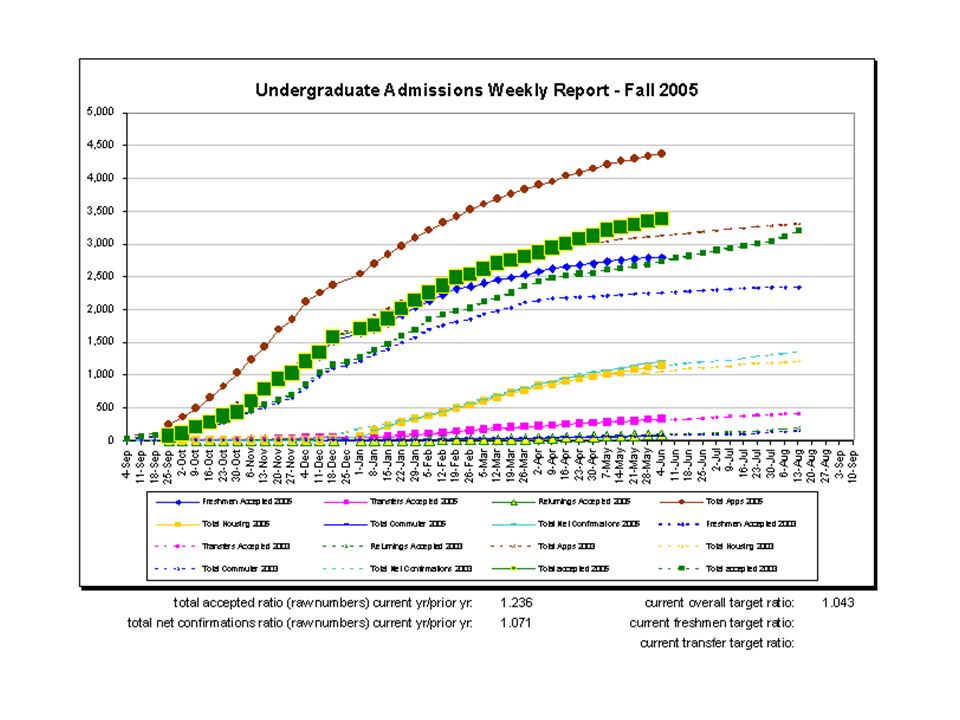
5/10/200541 Comparative Data In order to judge how good your performance is, results should be put into some context Trends over time Comparisons to other internal units Comparisons with peer groups Comparisons outside of the education sector

43
Better

48
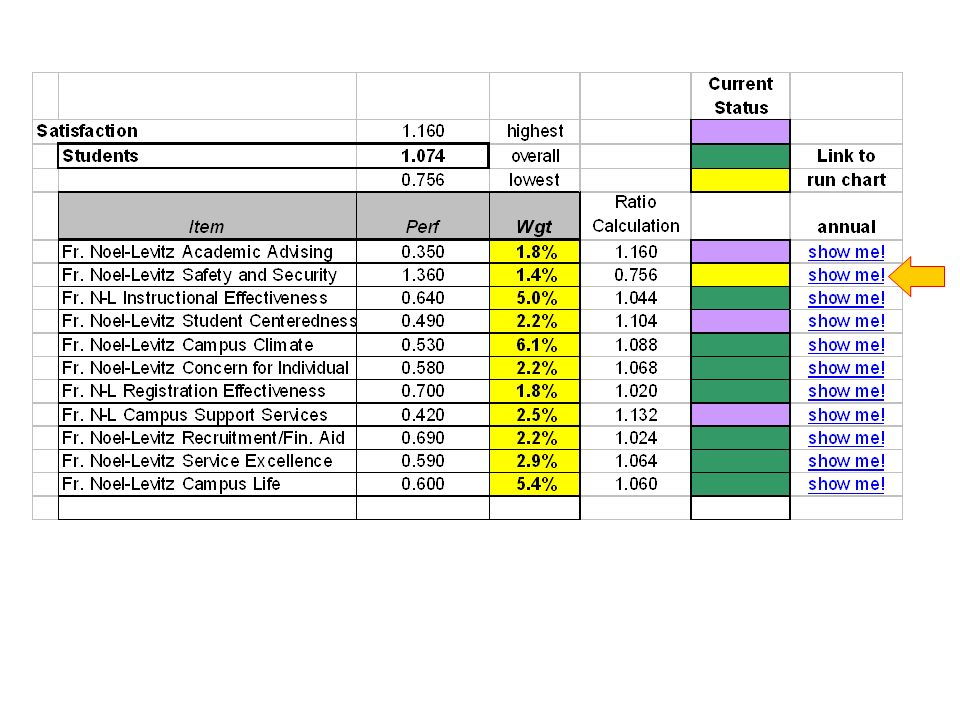
5/10/200548 Interpreting Dashboard Indicators To follow up on indicators of interest, use hyperlinks to access increasing levels of detail Student satisfaction as an example President’s dashboard to Provost’s dashboard to Noel-Levitz Student Satisfaction Inventory data trends

49
Praxis and C-BASE results module Major Field test results module Academic Profile results module Undergrad majors and minors, Graduate majors, Degrees, Advisees module Student opinionnaires of teaching module General Education local module Program SCH generation module Financial data module Placement data module EMSAS module (freshman success) Alumni satisfaction module Major field local/senior capstone module Department ‘A’ Profile and Dashboard College ‘A’ Profile and Dashboard Department ‘etc.’ Profile and Dashboard College ‘etc.’ Profile and Dashboard Provost’s Profile and Dashboard Service unit ‘A’ Profile and Dashboard Service unit ‘B’ Profile and Dashboard Service unit ‘C’ Profile and Dashboard Service unit ‘etc.’ Profile and Dashboard President’s Dashboard Provost’s Dashboard Metrics Architecture July 28, 2002 Comparative data for targets Student satisfaction module
 Alumni satisfaction module Major field local/senior capstone module Department ‘A’ Profile and Dashboard College ‘A’ Profile and Dashboard Department ‘etc.’ Profile and Dashboard College ‘etc.’ Profile and Dashboard Provost’s Profile and Dashboard Service unit ‘A’ Profile and Dashboard Service unit ‘B’ Profile and Dashboard Service unit ‘C’ Profile and Dashboard Service unit ‘etc.’ Profile and Dashboard President’s Dashboard Provost’s Dashboard Metrics Architecture July 28, 2002 Comparative data for targets Student satisfaction module")
54
5/10/200554 Data Warehouses and Dashboards – A Primer Contact information: Tod Massa State Council of Higher Education for Virginia 804.225.3147 (voice) todmassa@schev.edu todmassa@schev.edu Dave Oehler Northwest Missouri State University 660.562.1527 (voice) oehler@nwmissouri.edu oehler@nwmissouri.edu
 Dave Oehler Northwest Missouri State University (voice) ")
Similar presentations


 PerformancePoint in SharePoint 2010 Sayed Ali – SharePoint Administrator.>")


 District Accreditation Module 4: Quality Assurance.>")
 College of Education.>")


