Download presentation
Presentation is loading. Please wait.

1
Unit 1: Introduction Chapter 1

2
What is Science Science is a system of knowledge and the methods you use to find that knowledge. Science begins with curiosity and often ends with discovery.

3
What is Science? Generally scientists believe that the universe can be described by basic rules and these rules can be discovered by careful, methodical study.

4
Science vs. Technology Technology – the application of science Science and technology are interdependent. Advances in one lead to advances in the other

5
Branches of Science Physics: The study of Forces and Energy Chemistry: The study of Matter and its changes

6
What is the Scientific Method? Scientific method refers to the techniques for investigating phenomena, acquiring new knowledge, or correcting and integrating previous knowledge It’s an organized plan for gathering, organizing, and communicating information. Everyone can use the scientific method The goal of any scientific method is to solve a problem or to better understand an observed event

7
How Science is conducted Science is an investigation, which starts with observations leading to inferences. An observation is any information collected with the senses. An inference is conclusions or deductions based on observations.

8
Practice Observations: I hear people screaming I smell cotton candy, popcorn, and hamburgers I see a lot of people Inference = ?

9
Basic steps of scientific method 1. Make an observation 2. Ask a question 3. Form a hypothesis 4. Test hypothesis 5. Analyze data/draw conclusion 6. Develop theory

10
Scientific Method Steps 1-3 1. Begins with an observation (ex. I see smoke in the distance) 2. that leads to a question. (ex. what’s causing the smoke) 3. Form a hypothesis – a possible answer that you can test. (ex. Some one is burning leaves.)
 2. that leads to a question. (ex. what’s causing the smoke) 3. Form a hypothesis – a possible answer that you can test. (ex. Some one is burning leaves.).")
11
Scientific Method Step 4 A good experiment tests only one variable at a time. No experiment is a failure. Conduct an Experiment

12
Variables Variable – anything that can change in an experiment Independent variable – what you change. (manipulated) Dependent variable – what changes because of the independent variable. (responding) Control-what you keep the same
 Dependent variable – what changes because of the independent variable. (responding) Control-what you keep the same.")
13
Qualitative vs Quantitative Qualitative – describes with words. Quantitative – describe with measurements

14
Scientific Method Step 5 Analyze data Data DOES NOT support hypothesis then you need to revise the hypothesis and retest Data supports hypothesis than additional testing is needed before developing a theory

15
Scientific Method Step 6 Is an explanation that has been tested by repeated observations. Are always being questioned and examined. To be valid, a theory must continue to pass each test. Scientific Theory

16
Scientific Theory (cont.) A theory must explain observations simply and clearly. Experiments that illustrate the theory must be repeatable. You must be able to predict from the theory

17
Scientific Method Step 6 cont States a repeated observation about nature. Does not explain why an event happens. Scientific Law

18
Theories and Laws are not absolute Sometimes theories or Laws have to be changed or replaced completely when new discoveries are made.

19
Scientific Model Model is an representation of an object or event. Scientific models make it easier to understand things that might be too difficult to observe directly

20
Graphs A way of organizing and presenting data. Makes relationships more evident.

21
Line graphs Best for displaying data that change. (anything over time) Numerical vs. Numerical.
 Numerical vs. Numerical.")
22
Multiple Line Graphs Best for comparing multiple values and distributions

23
Bar Graphs Best when comparing data for several individual items or events. Numerical vs. non-numerical

24
Circle Graphs (pie charts) Best for displaying data that are parts of a whole.
 Best for displaying data that are parts of a whole.")
25
Scientific Notation When writing very large or very small numbers, scientists use a kind of shorthand called scientific notation. This is a way of writing a number without so many zeros.

26
Examples: The speed of light is about 300,000,000 m/s Or 3.0 x 10 8 The mass of a proton is 0.000000000000000000000001673 Or 1.673 X 10 -24

27
All you do is move the decimal 850,000,000.0 8 5 0 0 0 0 0 0 0. 0 = 8.5 x 10 8 0.000,000,025 0. 0 0 0 0 0 0 0 2 5 = 2.5 x 10 -8 + -

28
Scientific Notation Examples 3.256 x 10 4 9.78 x 10 9 5.24 x 10 -3 2.41 x 10 -7

29
Scientific Notation Examples 0.007899 = ? 898745.30 = ? 0.00003657= ? 531120 = ?

30
Units of Measurement Scientists use the International System of Units (SI units) for measurements. When everyone uses the same units, sharing data and results is easier – less mistakes.

31
Base Units The official SI units to measure: Length = meter (m) Volume = liter (L) Mass = gram (g) Time = seconds (s) Temperature = Kelvin (K)
 Volume = liter (L) Mass = gram (g) Time = seconds (s) Temperature = Kelvin (K)")
32
Derived Unit derived units, are made from combinations of base units. Area: square meter (m 2 ) Volume: cubic meter (m 3 ) Density: kilograms per cubic meter (kg/m 3 ) [a measurement of mass/area] Pressure: pascal (Pa) [a measurement of force/area] Energy: Hertz (Hz) [a measurement of force/distance] Electric charge: coulomb (C) [is a measurement of current /time]
 Volume: cubic meter (m 3 ) Density: kilograms per cubic meter (kg/m 3 ) [a measurement of mass/area] Pressure: pascal (Pa) [a measurement of force/area] Energy: Hertz (Hz) [a measurement of force/distance] Electric charge: coulomb (C) [is a measurement of current /time].")
33
Metric prefixes allow for more convenient ways to express SI base and derived units. PrefixKiloHectoDecaBaseDeciCentiMilli Symbolkhdadcm meaning 10 3 10 2 10 1 10 0 10 -1 10 -2 10 -3 Metric Prefixes

34
King Henry - Conversions Use the sentence “King Henry Died by Drinking Chocolate Milk.” to remember the order of prefixes. Kilo Hecto Deka base Deci Centi Milli meter liter gram

35
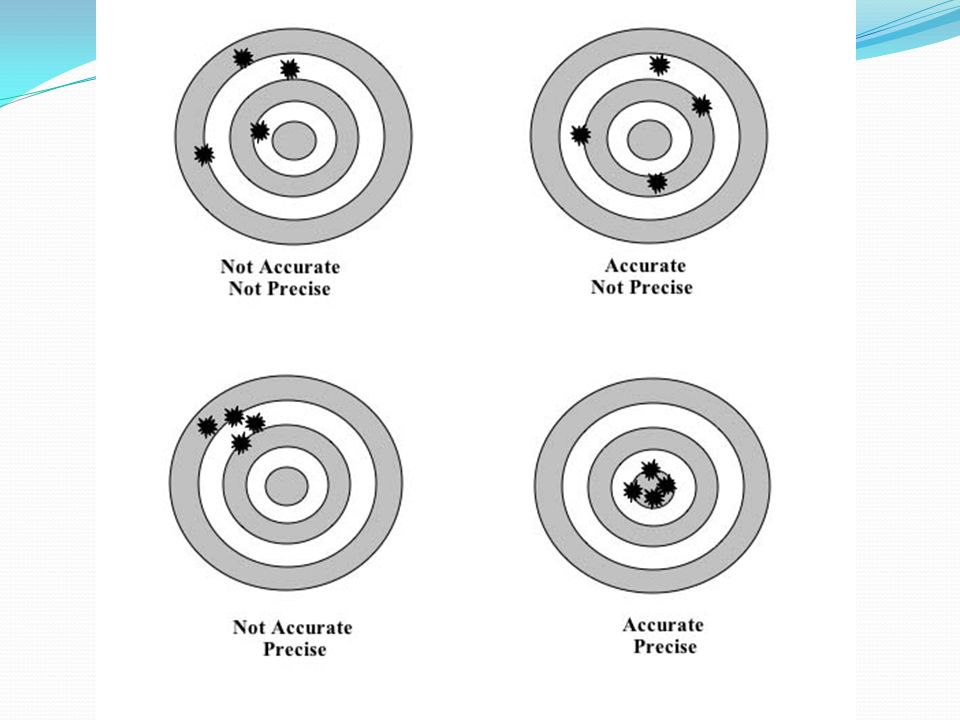
Limits of Measurement Precision is a gauge of how exact a measurement is. Precise measurements are close to each other Accuracy is the closeness of a measurement to the actual value of what is being measured An accurate measure is close to the true or expected value

Similar presentations