Download presentation
Presentation is loading. Please wait.

1
DBI313

4
MetricOLTPDWLog Read/Write mixMostly reads, smaller # of rows at a time Scan intensive, large portions of data at a time, bulk loading Mostly writes, requires low latency IO size and patternBetween 8 and 64K, mostly random 1 64KB read per 8 512KB reads, Mostly sequential MB/s a critical metric Highly sequential # usershighlown/a

6
… Datacenter network … Datacenter 1 Datacenter n Region 1 Region 2 …

7
Instances Roles Cloud Service is a management, configuration, security, networking and service model boundary Stateless Roles : Web/Worker Role – requires 2 or more instances Persistent Roles : Virtual Machine can work with single instance

8
Single Public IP Per Cloud Service Endpoint Public Port Local Port Protocol (TCP/UDP) Name Port Forwarding Endpoint Set Public Port Local Port Protocol (TCP/UDP) Name Load Balanced Sets Custom Load Balancer Health Probes -Health check with probe timeouts, HTTP based probing, allowing granular control of health checks
 Name Port Forwarding Endpoint Set Public Port Local Port Protocol (TCP/UDP) Name Load Balanced Sets Custom Load Balancer Health Probes -Health check with probe timeouts, HTTP based probing, allowing granular control of health checks")
9
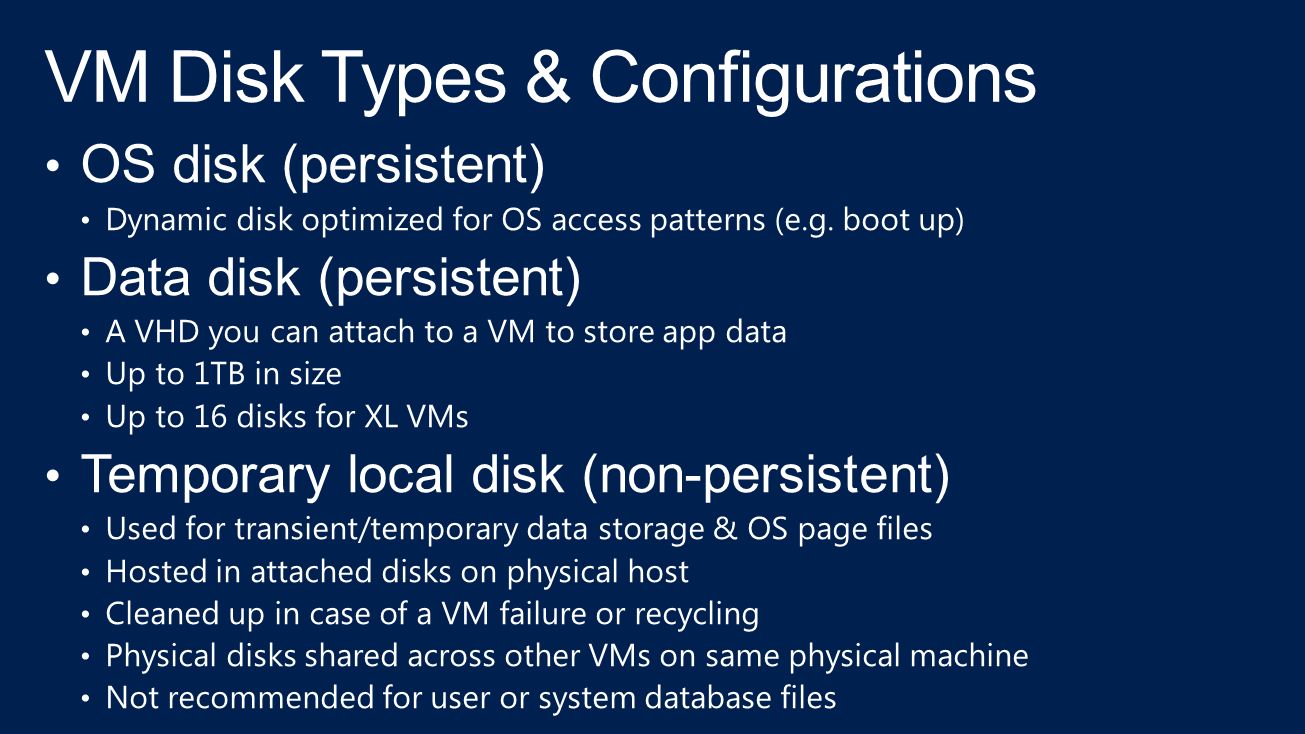
Virtual Machine C:\ OS Disk E:\, F:\, etc. Data Disks D:\ Temporary Disk Dynamic VHD RAM Cache Local Disk Cache Blobs Blob

11
Virtual Machine Size CPU CoresMemory Disk Space for Virtual Machines Allocated Bandwidth (Mbps) Maximum data disks (1 TB each) Maximum IOPS (500 maximum per disk) ExtraSmallShared768 MB20 GB511x500 Small11.75 GB70 GB10022x500 Medium23.5 GB135 GB20044x500 Large47 GB285 GB40088x500 ExtraLarge814 GB605 GB8001616x500 A6428 GB285 GB1,00088x500 A7856 GB605 GB2,0001616x500
 Maximum data disks (1 TB each) Maximum IOPS (500 maximum per disk) ExtraSmallShared768 MB20 GB511x500 Small11.75 GB70 GB10022x500 Medium23.5 GB135 GB20044x500 Large47 GB285 GB40088x500 ExtraLarge814 GB605 GB x500 A6428 GB285 GB1,00088x500 A7856 GB605 GB2, x500")
12
Stream Layer Partition Layer Front-ends LB Stream Layer Partition Layer Front-ends LB Geo-replication Storage Service Locations

14
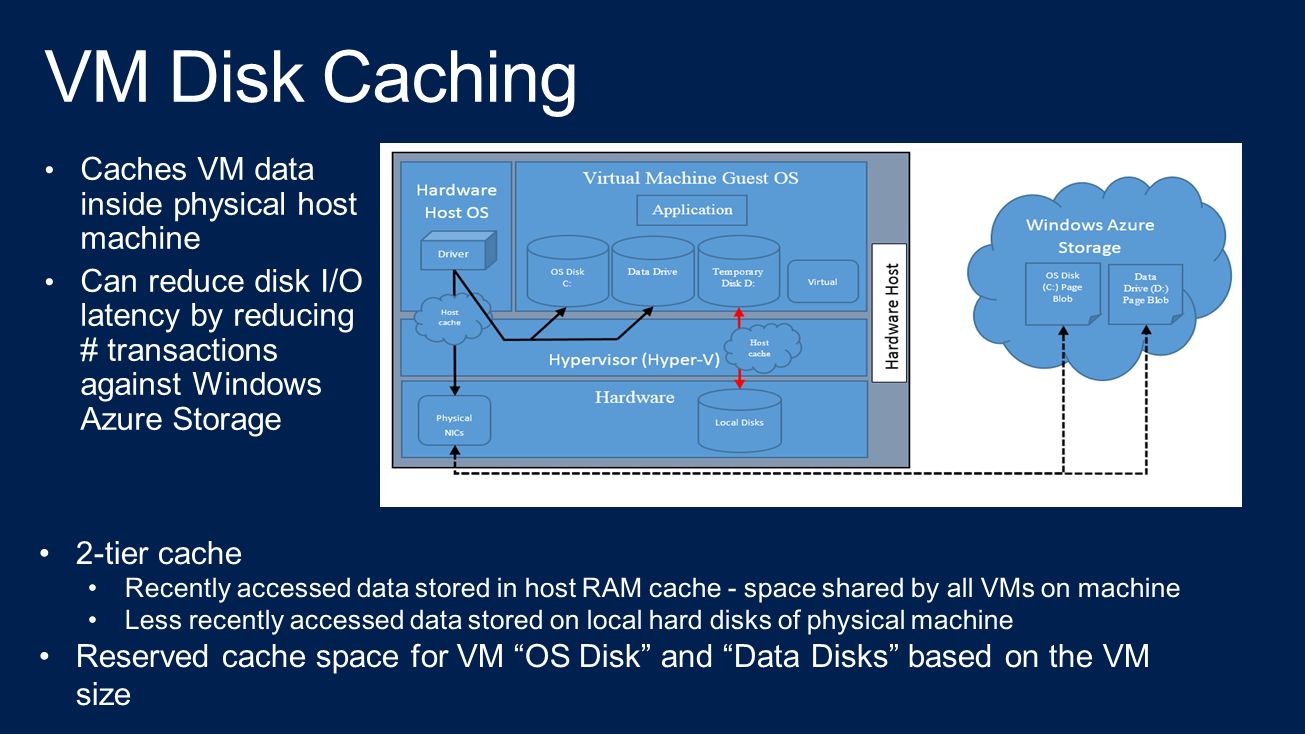
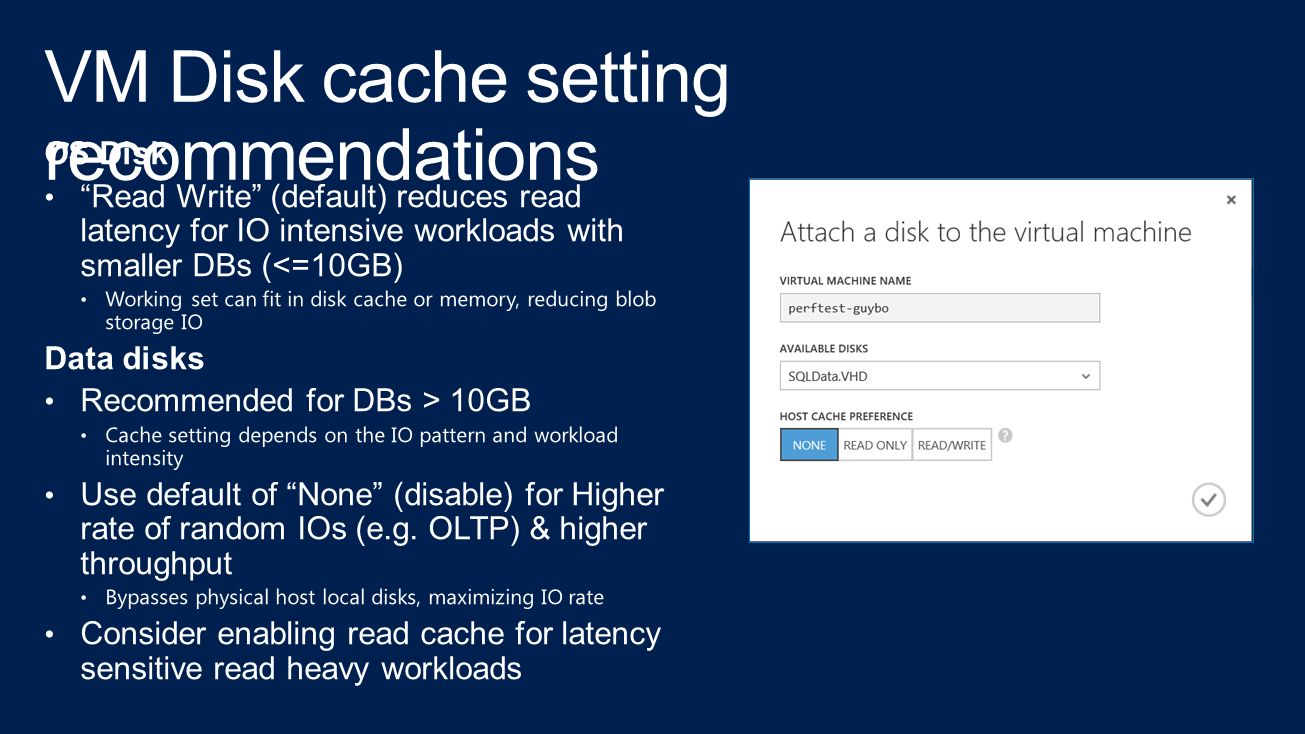
Disk typeRead OnlyRead WriteNone (disabled) OS diskSupportedDefault modeNot supported Data diskSupported (up to 4) Default mode Temporary diskImplemented using local attached storage Read Only: All requests cached for future reads. All writes persisted directly to Windows Azure Storage Read Write: Reads cached for future access. Non-write-through writes persisted to local cache first. For SQL Server, writes are persisted to WA storage because it uses Write-through - Lowest disk latency for light workloads None (disabled): Bypasses cache. All disk transfers persisted to Windows Azure Storage -Highest I/O rate for I/O intensive workloads -Also consider TX cost
: Bypasses cache. All disk transfers persisted to Windows Azure Storage -Highest I/O rate for I/O intensive workloads -Also consider TX cost.")
17
Random I/O (8KB Pages) Sequential I/O (64KB Extents) Sequential I/O (256KB Blocks) ReadsWritesReadsWritesReadsWrites IOPS500 300 Bandwidth4 MB/s 30 MB/s20 MB/s70 MB/s
 Sequential I/O (64KB Extents) Sequential I/O (256KB Blocks) ReadsWritesReadsWritesReadsWrites IOPS Bandwidth4 MB/s 30 MB/s20 MB/s70 MB/s")
19
4 disksRandom I/O (8KB Pages)Sequential I/O (64KB Extents)Sequential I/O (256KB Blocks) ReadsWritesReadsWritesReadsWrites IOPS2000 13007001100 Bandwidth20 MB/s 120 MB/s80 MB/s170 MB/s270 MB/s 16 disksRandom I/O (8KB Pages)Sequential I/O (64KB Extents)Sequential I/O (256KB Blocks) ReadsWritesReadsWritesReadsWrites IOPS8000 250050007002400 Bandwidth60 MB/s 150 MB/s300 MB/s170 MB/s600 MB/s 8 disksRandom I/O (8KB Pages)Sequential I/O (64KB Extents)Sequential I/O (256KB Blocks) ReadsWritesReadsWritesReadsWrites IOPS4000 250026007002200 Bandwidth30 MB/s 150 MB/s160 MB/s170 MB/s550 MB/s
Sequential I/O (64KB Extents)Sequential I/O (256KB Blocks) ReadsWritesReadsWritesReadsWrites IOPS Bandwidth20 MB/s 120 MB/s80 MB/s170 MB/s270 MB/s 16 disksRandom I/O (8KB Pages)Sequential I/O (64KB Extents)Sequential I/O (256KB Blocks) ReadsWritesReadsWritesReadsWrites IOPS Bandwidth60 MB/s 150 MB/s300 MB/s170 MB/s600 MB/s 8 disksRandom I/O (8KB Pages)Sequential I/O (64KB Extents)Sequential I/O (256KB Blocks) ReadsWritesReadsWritesReadsWrites IOPS Bandwidth30 MB/s 150 MB/s160 MB/s170 MB/s550 MB/s")
31
Typical User/test characteristics Number of concurrent users Average/Max request execution time Number of web servers Ramp up period, test method Start and end time of test

35
Issue KPIs To MonitorActions to Consider CPU at or near 80% % Processor Time (_Total) SOS_SCHEDULER_YIELD waits Increase instance size Identify top consuming queries and tune Load balance (e.g. move DB to another instance) Near I/O capacity limits or IO Latency Increases Average disk reads per second Average disk writes per second Disk reads per second Disk writes per second io_virtual_file_stats PAGEIOLATCH waits SQL Server: Buffer Manager\Page Life Expectancy Check Page Life Expectancy counter, for mem pressure. Increase instance size Identify which DB and log files have I/O bottleneck Add more data disks and separate data files if near IOPS limits per disk Tune queries to reduce reads and writes Consider enabling row or page compression Memory resource pressure Memory: Available Bytes Memory: Pages per second SQL Server: Buffer Manager\Page Life Expectancy Process: Working Set (for SQL Server) RESOURCE_SEMAPHORE waits Check max server memory setting for SQL Server. Use high memory instance Identify SQL component (such as, CLR, high memory grants for app queries, et.), tune appropriately.
 Near I/O capacity limits or IO Latency Increases Average disk reads per second Average disk writes per second Disk reads per second Disk writes per second io_virtual_file_stats PAGEIOLATCH waits SQL Server: Buffer Manager\Page Life Expectancy Check Page Life Expectancy counter, for mem pressure. Increase instance size Identify which DB and log files have I/O bottleneck Add more data disks and separate data files if near IOPS limits per disk Tune queries to reduce reads and writes Consider enabling row or page compression Memory resource pressure Memory: Available Bytes Memory: Pages per second SQL Server: Buffer Manager\Page Life Expectancy Process: Working Set (for SQL Server) RESOURCE_SEMAPHORE waits Check max server memory setting for SQL Server. Use high memory instance Identify SQL component (such as, CLR, high memory grants for app queries, et.), tune appropriately..")
38
Head to... aka.ms/te

Similar presentations


 first disk drive 5 Mb – 0.002 Mb/in2 35000$/year 9 Kb/sec 1980: SEAGATE first 5.25’’ disk drive 5 Mb – 1.96 Mb/in2 625.>")


 IM Conferencing Presence Enterprise Voice (PSTN) Audio/Video Conferencing Web Conferencing.>")


Virtual Machine (IaaS) StorageNon-Persistent StoragePersistent Storage Easily add additional storage DeploymentBuild VHD offsite and upload.>")

 SharePoint Value Prop Full h/w control – size/scale Roll-your-own HA/DR/scale Value Prop 100% of.>")


