Download presentation
Presentation is loading. Please wait.

1
Crime Victimisation Risk – data and modelling requirements Tim Hope and Alan Trickett Keele University © 5 December 2006

2
Access to Data and Analytic Capacity Secondary use part of original BCS justification Limited secondary analysis capacity in UK (both in-house and external) Complexity and unfriendliness of data Restrictions and limitations on data access –e.g. Harder now to link to other national statistics (Census, Neighbourhood Statistics) than in 1982. Lack of Government interest in adding value to BCS or commercialisation? Is the BCS a public statistic?
 than in Lack of Government interest in adding value to BCS or commercialisation. Is the BCS a public statistic .")
3
The Importance of Area Contextual Data Why is area contextual data necessary? What kind of contextual data? What kinds of models/explanations are suggested?

4
BCS Sample Design Primary Sampling Unit (PSU) of the BCS is a nested cluster sample of respondents living in close, spatial proximity to each other. Geo-coded spatial referencing (postal geography, Census geography) Aggregation of individual responses to form pseudo-neighbourhoods Attachment of Census data to individual cases to form area-context variables
 Aggregation of individual responses to form pseudo-neighbourhoods Attachment of Census data to individual cases to form area-context variables.")
5
Pseudo-neighbourhood analyses Sampson, R.J. and B. W. Groves (1989). Community structure and crime: testing social disorganisation theory, American Journal of Sociology, 94, 774-802. Osborn, D.R., A. Trickett, and R. Elder (1992). Area characteristics and regional variates as determinants of area property crime levels. Journal of Quantitative Criminology, 8, 265-285 Trickett, A., D.R. Osborn, J. Seymour, and K. Pease (1992). What is different about high crime areas?, British Journal of Criminology, 32, 81-9. Osborn, D.R., A. Trickett, and R. Elder (1992). Area characteristics and regional variates as determinants of area property crime levels. Journal of Quantitative Criminology, 8, 265-285 Trickett, A., D. Ellingworth, T. Hope and K. Pease (1995). 'Crime victimisation in the eighties: changes in area and regional inequality'. British Journal of Criminology, 35 (3), 343-359. Kershaw, C. and A. Tseloni (2005). Predicting crime rates, fear and disorder based on area information: evidence from the 2000 British Crime Survey. International Review of Victimology, 12, 293-312.
. Community structure and crime: testing social disorganisation theory, American Journal of Sociology, 94, Osborn, D.R., A. Trickett, and R. Elder (1992). Area characteristics and regional variates as determinants of area property crime levels. Journal of Quantitative Criminology, 8, Trickett, A., D.R. Osborn, J. Seymour, and K. Pease (1992). What is different about high crime areas , British Journal of Criminology, 32, Osborn, D.R., A. Trickett, and R. Elder (1992). Area characteristics and regional variates as determinants of area property crime levels. Journal of Quantitative Criminology, 8, Trickett, A., D. Ellingworth, T. Hope and K. Pease (1995). Crime victimisation in the eighties: changes in area and regional inequality . British Journal of Criminology, 35 (3), Kershaw, C. and A. Tseloni (2005). Predicting crime rates, fear and disorder based on area information: evidence from the 2000 British Crime Survey. International Review of Victimology, 12,")
6
Pseudo-neighbourhood analyses Sampson and Groves (1989) Aggregate individual-level responses in 1982/1984 BCS to produce Ward-level variables –Victimisation rate (dependent variable) –Measures of social disorganisation (mediating variables) –Structural variables (low SES, mobility, heterogeneity) Widely-cited test of social disorganisation theory But aggregation of sampled observations produces biased estimates – i.e. aggregates sampling error! Osborn et al., (1992) model victimisation rates (1984 BCS and 1981 Census data) Kershaw and Tseloni (2005) model crime, fear and disorder rates (2000 BCS, 1991 Census) Reduction of error vs. loss of explanation
 model victimisation rates (1984 BCS and 1981 Census data) Kershaw and Tseloni (2005) model crime, fear and disorder rates (2000 BCS, 1991 Census) Reduction of error vs. loss of explanation.")
7
What is different about high crime neighbourhoods? Better predictions of prevalence than incidence (Osborn et al. (1992); Kershaw and Tseloni, 2005). Why? Answer: Difference between expected and observed prevalence rates (Trickett et al.,1992; Trickett et al., 1995): –Too few victims: (more repeat victims or more immune residents?) –Too much crime concentrated in high crime areas
; Kershaw and Tseloni, 2005). Why. Answer: Difference between expected and observed prevalence rates (Trickett et al.,1992; Trickett et al., 1995): –Too few victims: (more repeat victims or more immune residents ) –Too much crime concentrated in high crime areas.")
10
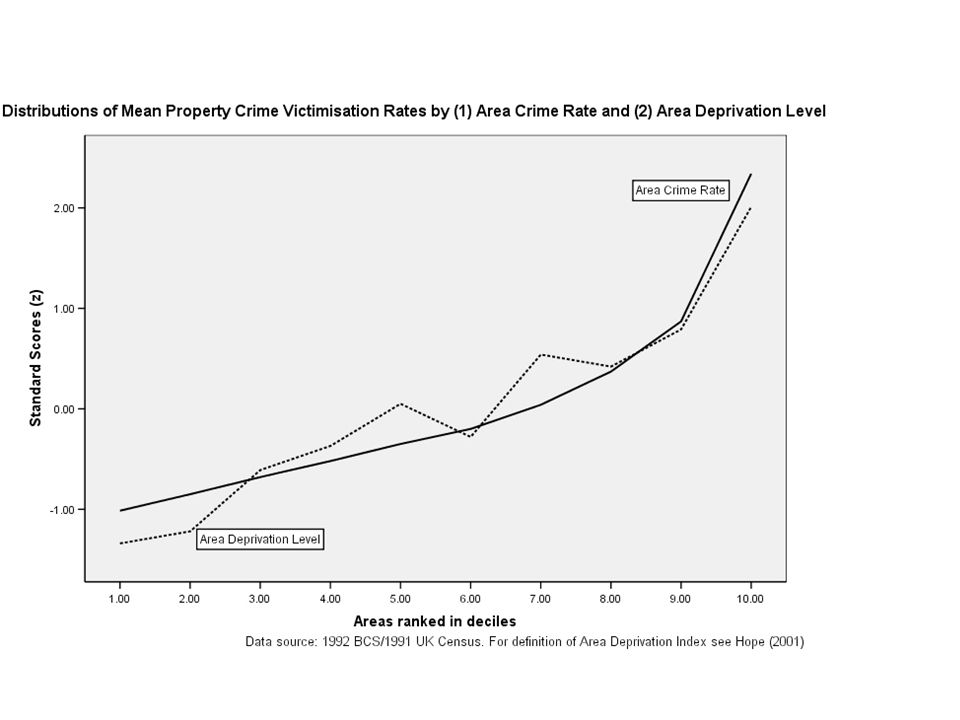
Area concentration of crime Distribution replicated using individual-level data (negative binomial regression model) Osborn, D.R. and A. Tseloni (1998). The distribution of household property crimes. Journal of Quantitative Criminology, 14, 307-330. Distribution mirrored by area deprivation level Hope, T. (2001). Crime victimisation and inequality in risk society. In R. Matthews and J. Pitts (Eds.) Crime Prevention, Disorder and Community Safety. London: Routledge.
. The distribution of household property crimes. Journal of Quantitative Criminology, 14, Distribution mirrored by area deprivation level Hope, T. (2001). Crime victimisation and inequality in risk society. In R. Matthews and J. Pitts (Eds.) Crime Prevention, Disorder and Community Safety. London: Routledge..")
12
The Role of Individual and Area Influences

13
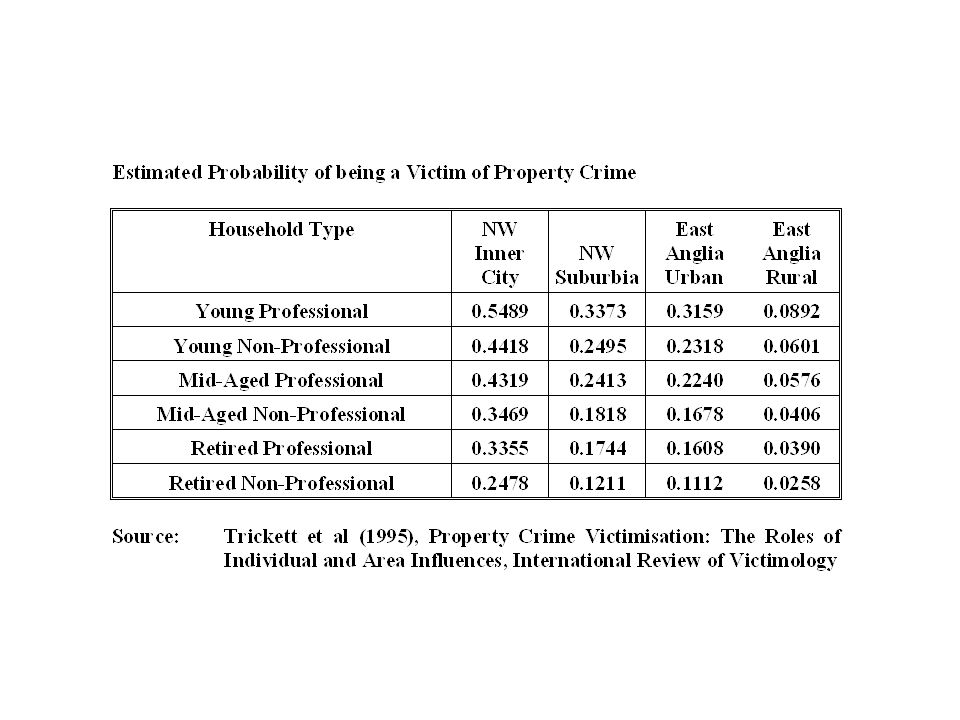
The role of individual and area differences Trickett, A., D. R. Osborn and D. Ellingworth (1995b). Property crime victimisation: the roles of individual and area influences. International Review of Victimology, 3, 273-295. Logistic Regression Goodness-of-Fit TestStatisticp. Overall model χ 2 440.38.0000 Decrease in χ 2 : individual variables omitted 173.64.0000 Decrease in χ 2 : Region/area variables omitted 230.06.0000
. Property crime victimisation: the roles of individual and area influences. International Review of Victimology, 3, Logistic Regression Goodness-of-Fit TestStatisticp. Overall model χ Decrease in χ 2 : individual variables omitted Decrease in χ 2 : Region/area variables omitted")
14
Property crime victimisation likelihood by dwelling and area type: bivariate and multivariate odds Bivariate (sample) odds Multivariate odds (p. ) Detached house1.000 Semi-detached house1.2540.845 (.054) End-terrace (row) house1.7260.986 (.901) Mid-terrace house1.5050.763 (.005) Flat (apartment)1.5690.664 (.000) Affluence of area0.8030.846 (.000) Source: 1992 British Crime Survey/1991 Census. Univariate odds calculated from weighted data. Multivariate odds estimate from a logistic regression model Hope, T. (2000). Inequality and the clubbing of private security. In T. Hope and R. Sparks (Eds.) Crime, Risk and Insecurity. London: Routledge.
 Detached house1.000 Semi-detached house (.054) End-terrace (row) house (.901) Mid-terrace house (.005) Flat (apartment) (.000) Affluence of area (.000) Source: 1992 British Crime Survey/1991 Census. Univariate odds calculated from weighted data. Multivariate odds estimate from a logistic regression model Hope, T. (2000). Inequality and the clubbing of private security. In T. Hope and R. Sparks (Eds.) Crime, Risk and Insecurity. London: Routledge..")
16
HOUSEHOLD RISK FACTORS FOR HOUSEHOLD PROPERTY CRIME (Hope, 2001) the worse off? · council tenant (+) · young head of household (+) · children in household (+) · lone-parent household (+) · Asian sub-continent origin (+) · low level of household security (+) the better off? · non-manual occupation (+) · house-dweller (+) · number of cars (+) · detached house (+) · income (+)
 · young head of household (+) · children in household (+) · lone-parent household (+) · Asian sub-continent origin (+) · low level of household security (+) the better off. · non-manual occupation (+) · house-dweller (+) · number of cars (+) · detached house (+) · income (+).")
17
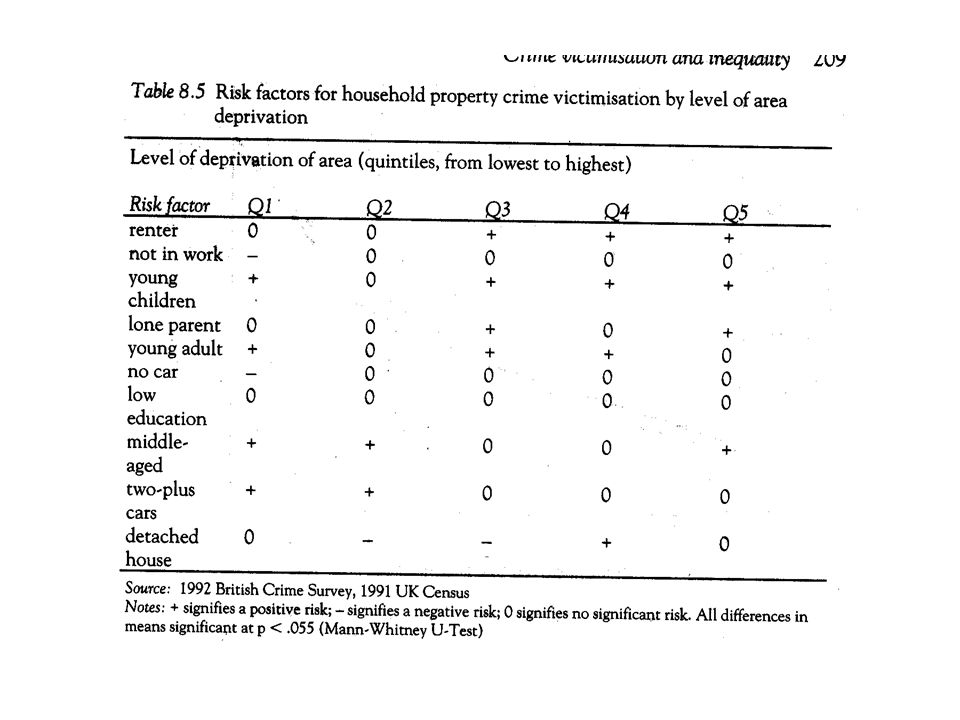
AREA RISK FACTORS FOR HOUSEHOLD PROPERTY CRIME (Hope, 2001) Deprivation? · Single parents (+) Children aged 5-15 (+) · Private rented housing (+) · Inner city (+) · Rich ACORN groups (+) Affluence? · Cars per household (-) · Deprivation Index (-) (over-crowded households large families housing association rental male unemployment) · Poor ACORN groups (+)
 Children aged 5-15 (+) · Private rented housing (+) · Inner city (+) · Rich ACORN groups (+) Affluence. · Cars per household (-) · Deprivation Index (-) (over-crowded households large families housing association rental male unemployment) · Poor ACORN groups (+).")
19
What Kind of Area (Census) Data? Individual variables versus Geodemographic classifications (MOSAIC, ACORN, etc.)? Horses for courses – explanation versus prediction Explanation – individual variables better –Explanatory (which area characteristics matter?) –Less collinearity –Ecological fallacy –More explanatory power (more degrees of freedom) –Purer (less non-Census data, post 1991) Prediction – Geo-demographics better –Operational targeting/profiling systems –Typologies and norms –Good at predicting the normal? (deviants? Hard-to-reach?)
. Horses for courses – explanation versus prediction Explanation – individual variables better –Explanatory (which area characteristics matter ) –Less collinearity –Ecological fallacy –More explanatory power (more degrees of freedom) –Purer (less non-Census data, post 1991) Prediction – Geo-demographics better –Operational targeting/profiling systems –Typologies and norms –Good at predicting the normal. (deviants. Hard-to-reach ).")
Similar presentations


 & Paul Ell (Queens University, Belfast)>")


