Download presentation
Presentation is loading. Please wait.

1
Young People and Social Capital Figen Deviren Social Inequalities

2
Young people and social capital Why the research was necessary The descriptive results Regression results Conclusions

3
Why conduct the research? General perception of young people is disengaged Quantitative Research young people have low social/civic participation Qualitative Research JRF – differing results Home Office Citizenship Survey 2003

4
Research questions specific to young people Issues on political agenda Informal social activity Social networks Voluntary activity Social participation Civic participation Trust

5
NS Omnibus Survey – 10 month survey October 2003 – young people only November 2003 and February 2004 – all respondents Sample size – 3712 of which 483 were aged 16 to 24

6
Descriptive results Figures presenting the differing results for young people aged 16 to 24 older people aged 25 and over Ttests of proportion conducted to assess significance

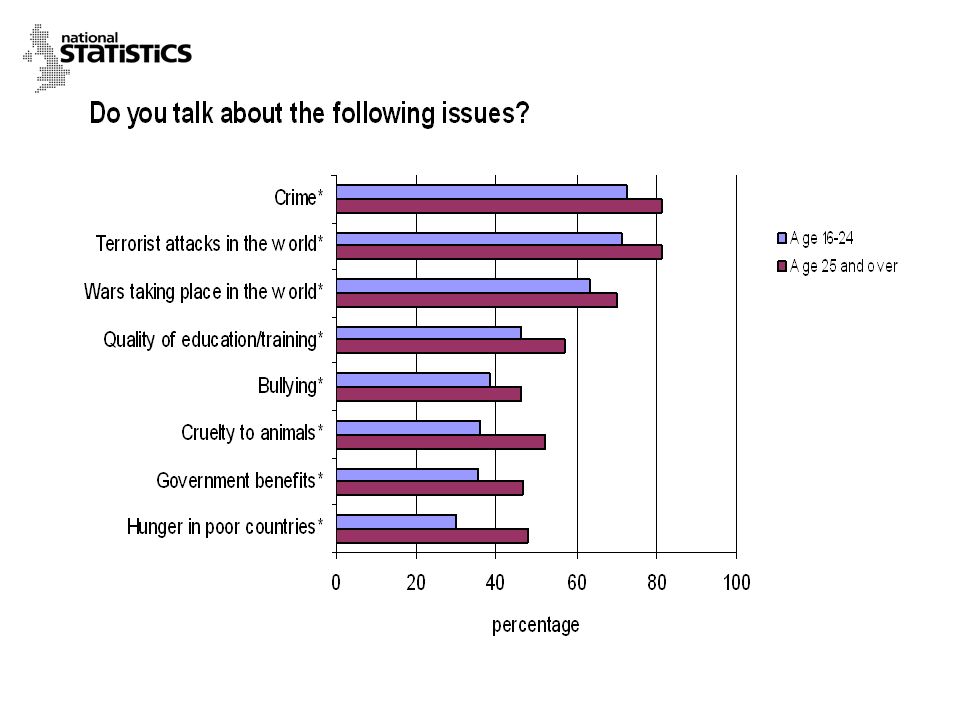
7
Issues on the political agenda

10
Informal social activity

12
Social Networks

13
Social networks

14
Social Networks

15
Voluntary activity

16
Social participation

17
Civic participation

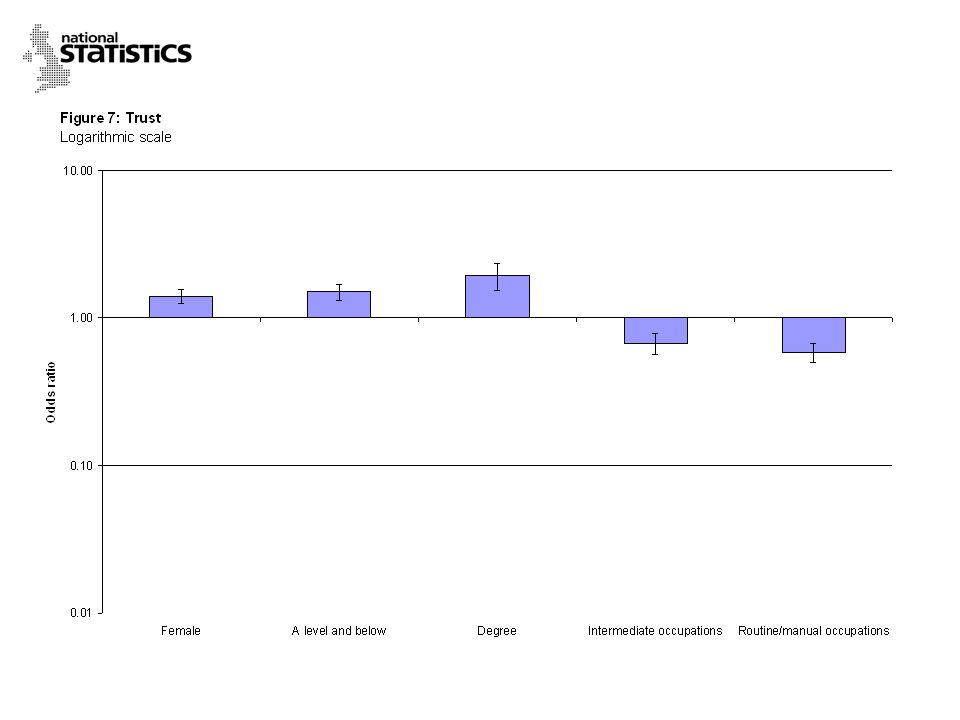
18
Trust

19
Summary Crime and terrorism/wars were the issues of most concern – more older people discussed more issues. Young people lead more active social lives and have larger social networks. Support is drawn from different sources for the two age groups. Older people were more likely to participate in acts of charity or citizenship. There were no differences in trust, teachers and the police were trusted by the majority and the government by the minority.

20
Regression Analysis was conducted using Stata Logistic regression Multinomial logistic regression - multiple categories of dependent variable Reference Categories - difficulties with small n Correlation and weighting issues

21
Regression results

25
Difference in social capital for those aged 25 and over relative to young people Logarithmic scale 0.01 0.10 1.00 10.00 Issues on the political agenda Informal sociability Social participation Voluntary activityCivic participationSocial networks odds ratio

27
Other significant relationships Married/cohabiting respondents discussed more political issues conducted more voluntary activities were more involved in social participation than single people The economically inactive and those with health problems had less active social lives

28
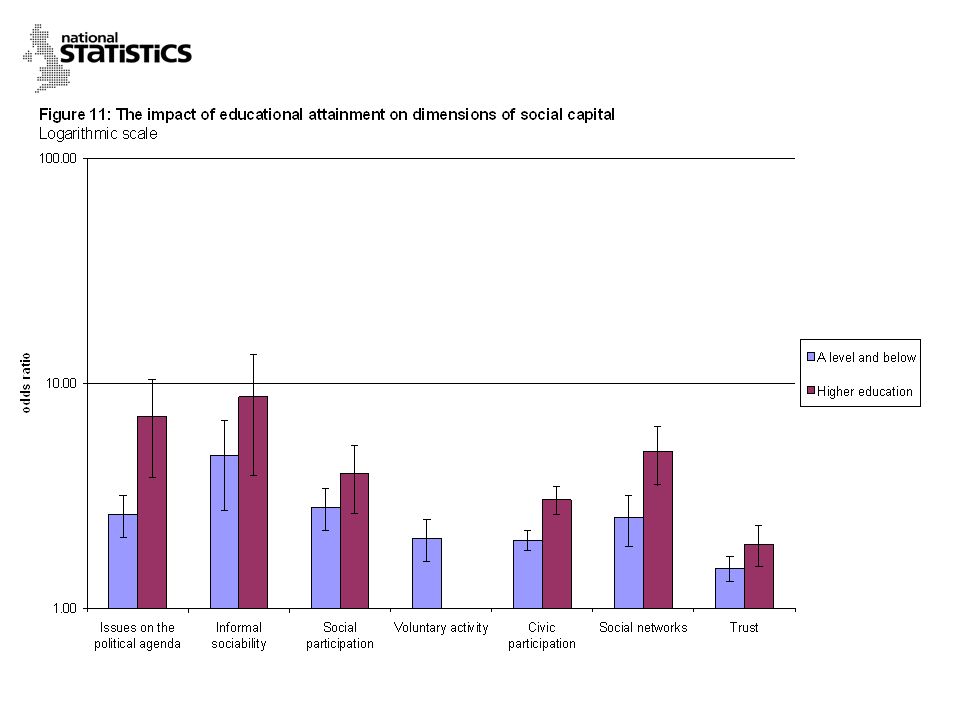
Conclusion Young people have more active social lives Young people have a larger number of people to turn to when upset Level of education has an association with the levels of participation

29
Useful addresses: www.statistics.gov.uk/socialcapital www.statistics.gov.uk/articles/nojournal/So cial_capital_young_people.pdf figen.deviren@ons.gsi.gov.uk

Similar presentations


 Crime surveys user meeting Tuesday 7 December 2010 Shedding more Light on the Dark Figure.>")


