Download presentation
Presentation is loading. Please wait.

1
National Urban Information System (NUIS) Data Model at Indian Institute of Surveying & Mapping Hyderabad 8th June 2010 by Rabindranath Nanda Superintending Surveyor GIS & RS Directorate Survey of India
 Data Model at Indian Institute of Surveying & Mapping Hyderabad 8th June 2010 by Rabindranath Nanda Superintending Surveyor GIS & RS Directorate Survey of India")
2
What is NUIS ?

3
The Ministry of Urban Development has launched the National Urban Information System (NUIS) Scheme in March, 2006. to implement 74 th constitutional ammendment. Components are: Urban Spatial Information System (USIS) to meet the spatial requirements of urban planning. National Urban Databank and Indicators (NUDB&I) to develop town level urban database. Developed Databases will be used for preparation of Master/ Development plans. Detailed town planning schemes. Serve as decision support for e-governance.
 to meet the spatial requirements of urban planning. National Urban Databank and Indicators (NUDB&I) to develop town level urban database. Developed Databases will be used for preparation of Master/ Development plans. Detailed town planning schemes. Serve as decision support for e-governance..")
9
Scales of GIS Data Creation (153 Towns) 1:10000 - Preparation of Zonal/Master Plan 1:2000 - Detailed Town Planning 1:1000 - Utility Planning
 1: Preparation of Zonal/Master Plan 1: Detailed Town Planning 1: Utility Planning")
10
Source of Data Creation 1:10000 - Thematic Mapping from imageries 1:2000 - Large Scale Mapping using 1:10K scale aerial photographs 1:1000 - Under ground utility mapping using Ground Penetrating Radar

11
National Map Policy National Map Policy was published during June 2005. The policies announced has given rise to two series of maps OSM and DSM. Mapping scale of 1:2k and 1:10k was introduced in addition to 1:25k, 1:50k and 1:250k. Everest/ Polyconic WGS84/ LCC WGS 84 / UTM Polyconic Series DSM Series OSM Series

13
Need to Standardized the Data Capture Ensure Interoperability among different software and hardware platforms. Uniformity of various datasets. Integrated decision support system for different agencies could be developed. Automation in some stages of data capturing/generation could be implemented.

14
What is Data Modelling ?

15
Data modeling It is a method used to define and analyze data requirements needed. The data requirements are recorded as a conceptual data model with associated data definitions. Data modeling defines not just data elements, but their structures and relationships between them. Data modeling techniques and methodologies are used to model data in a standard, consistent, predictable manner in order to manage it as a resource. Use of data modeling standards is strongly recommended for all projects requiring a standard means of defining and analyzing data within an organization, e.g. using data modeling: to manage data as a resource; for the integration of information systems; for designing databases/data warehouses.

16
Data Model The foundation to a database. Blue prints for data. Building plans for storing data. Instructions for building a database.

17
Types of data models Flat model This may not strictly qualify as a data model. The flat (or table) model consists of a single, two-dimensional array of data elements, where all members of a given column are assumed to be similar values, and all members of a row are assumed to be related to one another.
 model consists of a single, two-dimensional array of data elements, where all members of a given column are assumed to be similar values, and all members of a row are assumed to be related to one another..")
18
Hierarchical model In this model data is organized into a tree-like structure, implying a single upward link in each record to describe the nesting, and a sort field to keep the records in a particular order in each same-level list.

19
Network model This model organizes data using two fundamental constructs, called records and sets. Records contain fields, and sets define one-to-many relationships between records: one owner, many members.

20
Relational model It is a database model based on first-order predicate logic. Its core idea is to describe a database as a collection of predicates over a finite set of predicate variables, describing constraints on the possible values and combinations of values.

21
Looking Ahead Things to consider before constructing or updating a data model Selecting a data model that best fits your situation. Already have a Data Model Basic steps to help create and maintain your data model

22
How to do ? Match Data to Spatial Elements Determine geometry type of discrete features Specify relationships between features Implement attribute types for objects Select Geographic Representation Represent data with discreet features– Points, Lines and Polygons

23
Objectives of Design Results in a Well-Constructed Database : Satisfies objectives and supports organizational requirements Contains all necessary data but no redundant data Organizes data so that different users can access the same data. Accommodates different views of the data. Distinguishes which applications maintain the data. from which applications access the data. Appropriately represents, codes and organizes graphical features.

24
Benefits From Good Design Data retrieval and analysis are used more frequently. Decrease time in attributing data. Data that supports different users and uses. Minimized data redundancy. Increased likelihood of users developing applications.

25
Different Data Models in Use Survey of India –Small Scale like guide maps on 1:50k/25k –Large Scale like DDA project 1:10k and DSSDI on 1:2k National Informatics Centre (NIC) project completed by SOI on 1:1K for cities. NRSC Data model for 1:10k planning area survey under NUIS project. National Urban Information System 1:2k core area survey undertaken by SOI.

26
Basic Data Structures Vector Model A vector model builds a complex representation from primitive objects from the dimensions such as points, lines and polygons. Examples could be road, building, tree etc. Raster Model The raster data model serves to quantize or divide space as a series of packets or units, each of which represents a limited, but defined, amount of the earth’s surface. Examples could be DEM, Ortho photos and Scanned Photographs.

27
Vector data model Location referenced by x, y coordinates, which can be linked to form lines and polygons. Attributes referenced through unique feature ID linked to the specific row/rows of the tables.

28
Raster Model Location is referenced by a grid cell in a rectangular array (matrix) Attribute is represented as a single value for that cell. More data comes in this form –Images from remote sensing –Scanned maps –Elevation data

29
Vector Model

30
Salient features Data is to be disassociated from Visualization and to be maintained in databases. Visualization is to be planned/developed for each and every product. Visualization is to be again decided product wise and developed in style sheet form. Where ever desired objects to be filtered and generalized as per requirement and should be automatic as far as practicable.

31
Data filtering and Generalization 1: 2000 1: 10000 1: 25000 Village Block Village Block or Oblong Hut HUT

32
Filtering/ Generalisation Data Creation on different scales Database 1:2k Database 1:10k Filtering/ Generalisation Database 1:25k

33
Style Layer Description for NUIS Core map Cartographic Output Database 1:2k Database 1:10k Database 1:25k Style Layer Description for Utility map Style Layer Description for Guide map Style Layer Description for NUIS Planning map Style Layer Description for Topomap Style Layer Description for Project map

34
Feature Organisation

35
Major Categories 1.Settlements & Cultural Details 2.Hydrography 3.Ocean & Coast lines 4.Transportation 5.Land Cover & Land Use 6.Utilities 7.Government/Administrative Boundaries 8.Land Surface Elevation: Topographic / Hypsography 9.Geodetic 10.Vital Installations

36
01. Settlements & Cultural Details Residential Commercial Government Offices Religious Antiquities Utility Centre Educational Institutions/Welfare/Relief

37
02. Hydrography Stream Stream features River River Features Lake Lake Features Canal Canal features Other Water Features

38
03. Ocean & Coast Lines Coast Line Coastal natural features Coastal artificial features Tidal Elevation data

39
04. Transportation Carriageway Carriageway Infrastructure Tracks Transport Utilities Railway Railway Infrastructure Railway Embankment & Cuttings Airport

40
05. Land Cover & Land Use Built up Agricultural Forest West Land Water bodies Wet Lands Grass Land/Grazing Land Snow Cover

41
06. Utilities Transmission Lines Pipe Lines Water Utilities Conveyor Belt Rope Way Filling Stations Solid Waste Management

42
07. Government & Administrative boundaries International Boundaries State Boundaries District Boundaries Subdivision / Tehsil / Taluk / Mandal Boundaries Pragana Boundaries in UP Village Boundaries Cantonment Boundaries Municipal/ Corporation Boundaries Ward Boundaries Panchayat Boundaries Block Boundaries Constituency Boundaries Police Station Boundaries Park/Lawn Boundaries Boundary Infrastructure

43
08. Land surface elevation & Hypsography Contours Mountain Features Mud Volcanoes Sand Features High Mountain Features

44
09. Geodetic Control Points Primary Secondary Topographic Other Sources

45
10.Vital Installation Civil Vital Installations Military Vital Installations

46
CodeLevel 1Level 2Level 3Level 42k10k25kRemarks 01-01-00-00Residential 01-01-01-00Huts 01-01-01-01TemporaryAPP 01-01-01-02PermanentAPP 01-01-02-00Village Block 01-01-02-01In ruinAAp/A 01-01-02-02ExistingAAP/A 01-01-03-00Buildings 01-01-03-01Single floorAp/A- 01-01-03-02Multi FloorAp/A- 01-02-00-00Commercial 01-02-01-00Finance/Banks 01-02-01-01Nationalized BankAP- 01-02-01-02Private BankAP- 01-02-01-03Chit FundsAP- 01-02-02-00Farms 01-02-02-01Poultry FarmAP/AP 01-02-02-02Diary FarmAP/AP

47
Geometry of the object => Feature (NUIS)
")
48
Data Model 1:2K Urban Layer (Point Feature) Table 2.1 –Topographical Features –Land Marks (Religious) –Land Marks (Infrastructure) –Land Marks (Others) Urban Network Layer (Line Feature) Table 2.2 –Transport –Infrastructure –Topographical Features –Drainage
 Table 2.1 –Topographical Features –Land Marks (Religious) –Land Marks (Infrastructure) –Land Marks (Others) Urban Network Layer (Line Feature) Table 2.2 –Transport –Infrastructure –Topographical Features –Drainage")
49
Data Model 1:2K Urban Layer (Polygon Feature) Table 2.3 –Built-up (Residential) –Built-up (Non-Residential) –Religious –Transport –Recreational –Administrative –Water Bodies –Public/Semi-public –Other Land Uses
 Table 2.3 –Built-up (Residential) –Built-up (Non-Residential) –Religious –Transport –Recreational –Administrative –Water Bodies –Public/Semi-public –Other Land Uses")
57
Data Collection (Digital Photogrammetric)
")
59
Attribute Data Collection (Field Work)
")
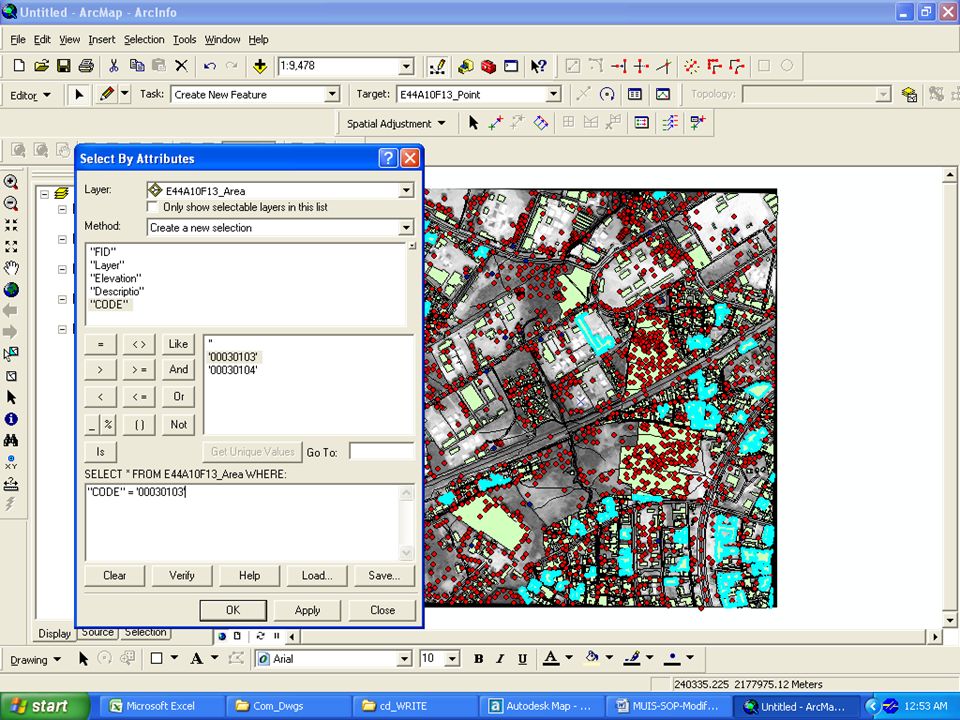
63
00030102 00030103 00030104

64
Attribute Data Addition

76
Thank You !!!

Similar presentations


 G.P. Singh Technical Director National Informatics Centre, Govt. of India Kendriya Bhawan.>")


? A GIS is a particular form of Information System applied to geographical.>")


