Download presentation
Presentation is loading. Please wait.

1
Building of Research Team in the Field of Environmental Modeling and the Use of Geoinformation Systems with the Consequence in Participation in International Networks and Programs Registry number: CZ.1.07/2.3.00/20.0170

2
SmartGrid projects Maps of cooperation Mircea ARDELEAN

3
Maps of cooperation What are the SmartGrids? Who is JRC? The survey Maps of cooperation

4
Smart Grids http://ses.jrc.ec.europa.eu/smart-grid-interactive-tool

5
Maps of cooperation What are the SmartGrids? Who is JRC? The survey Maps of cooperation

6
Joint Research Centre is the European Commission’s in-house science service 7 JRC Scientific Institutes Commissioner Mairé Geoghegan-Quinn Research, Innovation & Science President José ManuelBarroso 28 Commission Members DG Research & Innovation (RTD) Director-General Dominique Ristori Joint Research Centre
 Director-General Dominique Ristori Joint Research Centre")
7
Maps of cooperation What are the SmartGrids? Who is JRC? The survey Maps of cooperation

8
The survey Aim: to map all the smart grids projects in Europe maintain a database of the projects JRC acts as a impartial and honest energy broker

9
Maps of cooperation The survey 281 projects1,8 bln €

10
Maps of cooperation What are the SmartGrids? Who is JRC? The survey Maps of cooperation

11
Geographical distribution of projects

12
Maps of cooperation Project scale Very Small scale projects ≤ €2.5 mn Small scale projects €2.5 … €7.5 mn Medium scale projects €7.5 … €20 mn Large scale projects €20 … €30mn Very large scale projects ≥ €30 mn Average project budget: €6.5 mn

13
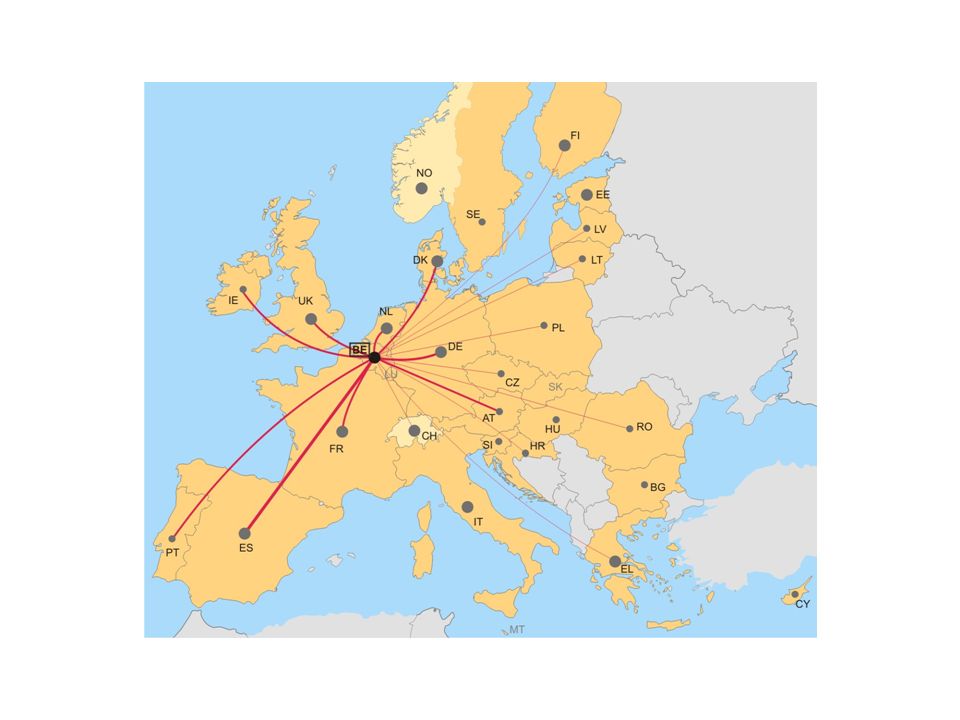
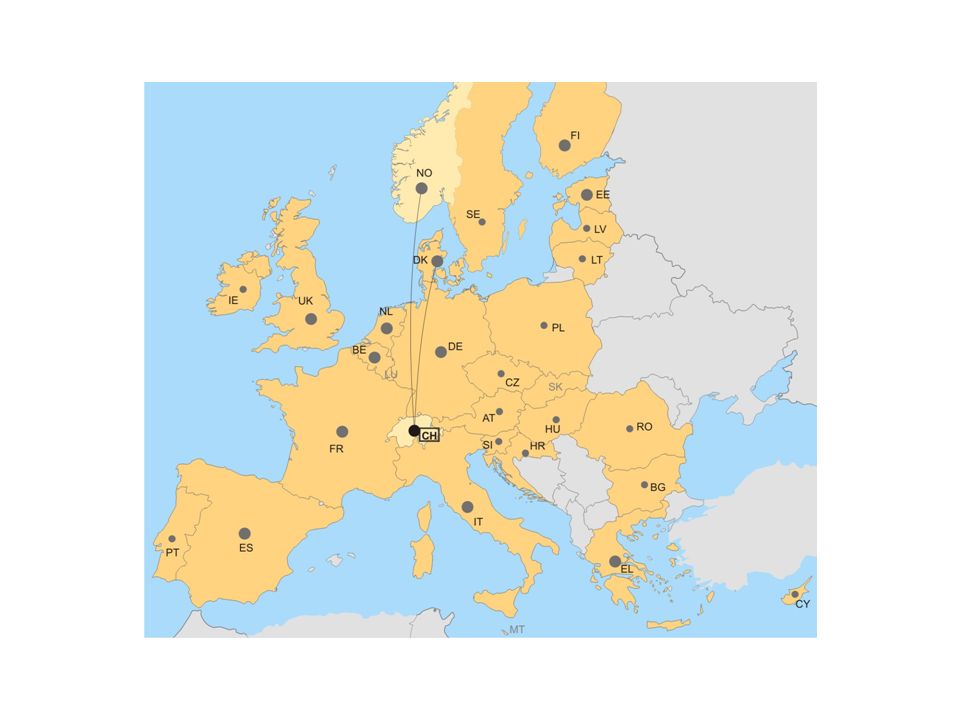
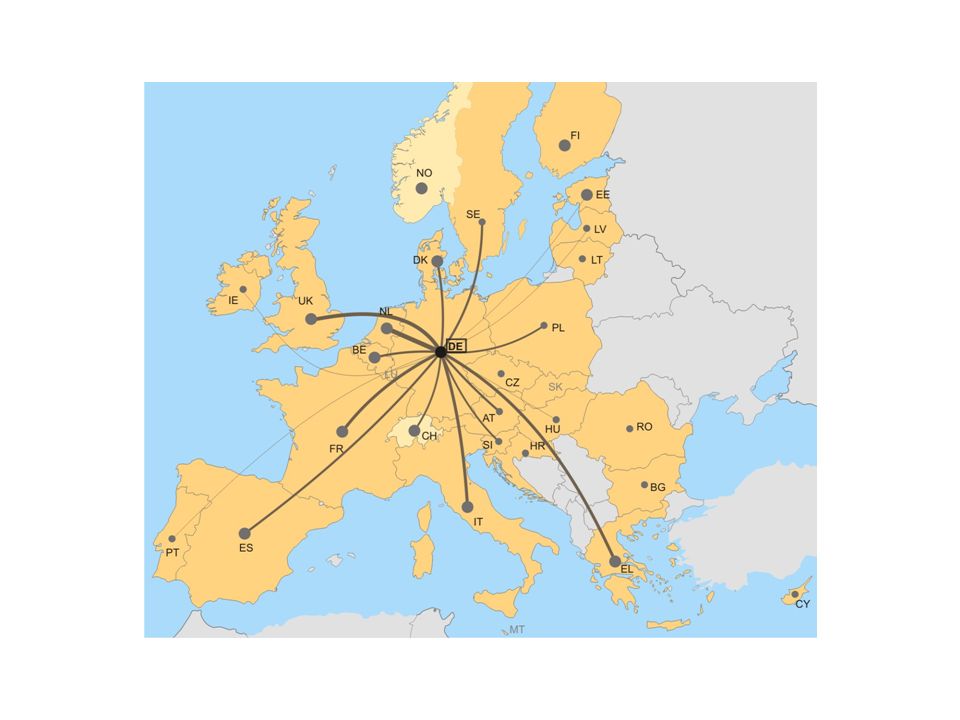
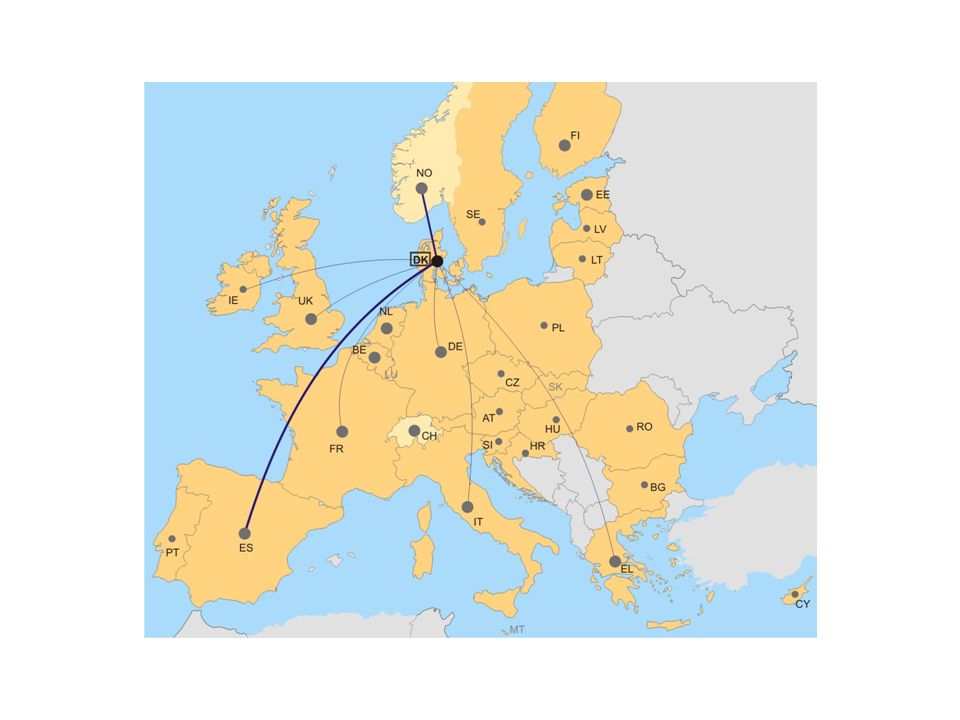
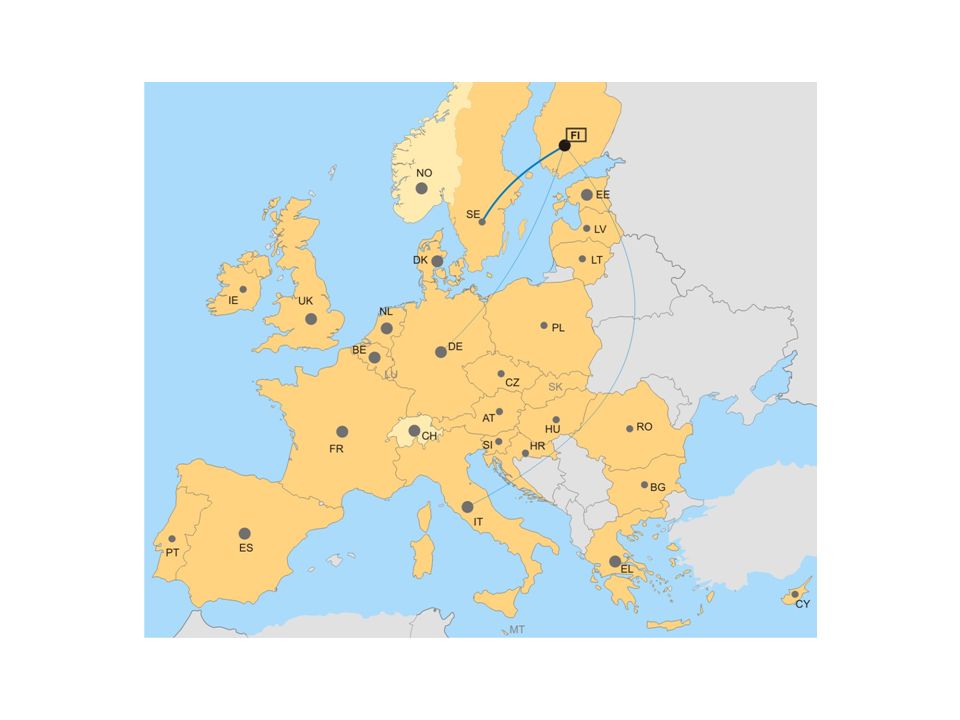
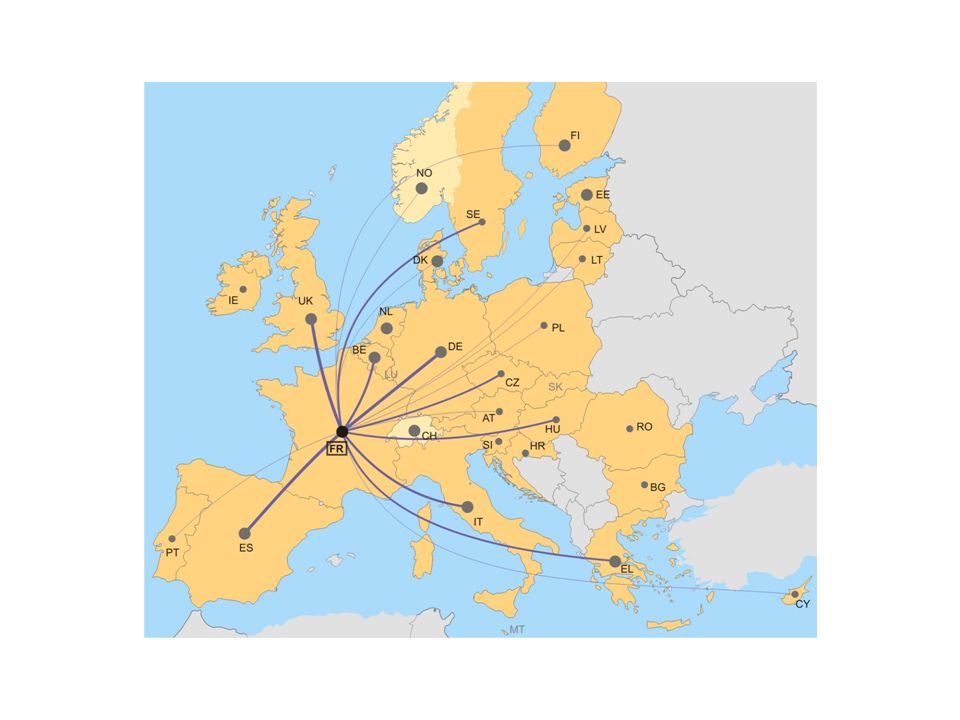
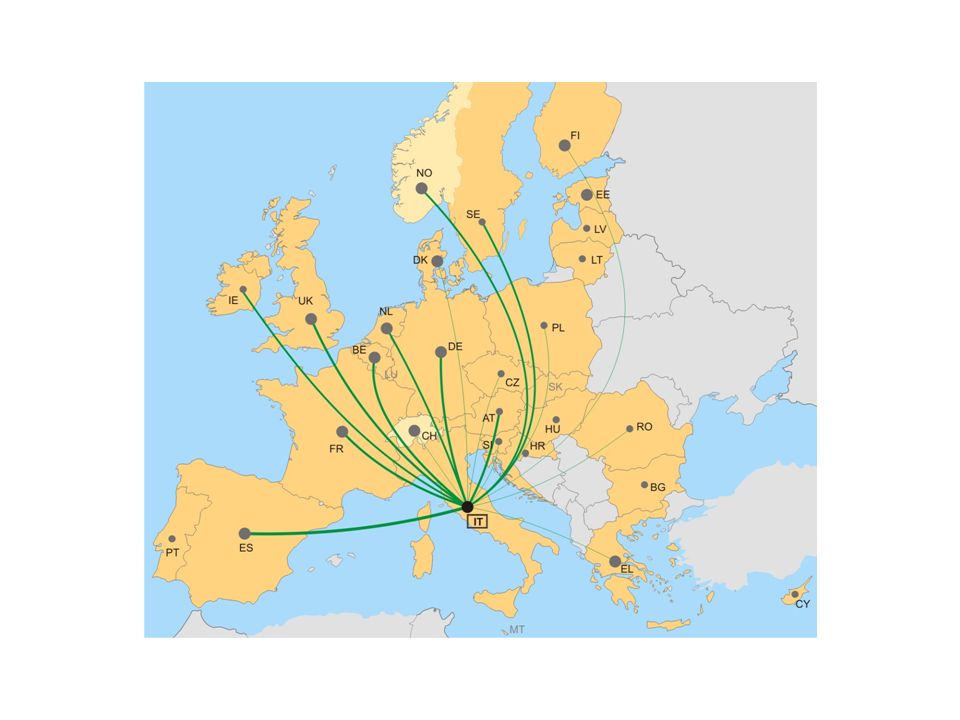
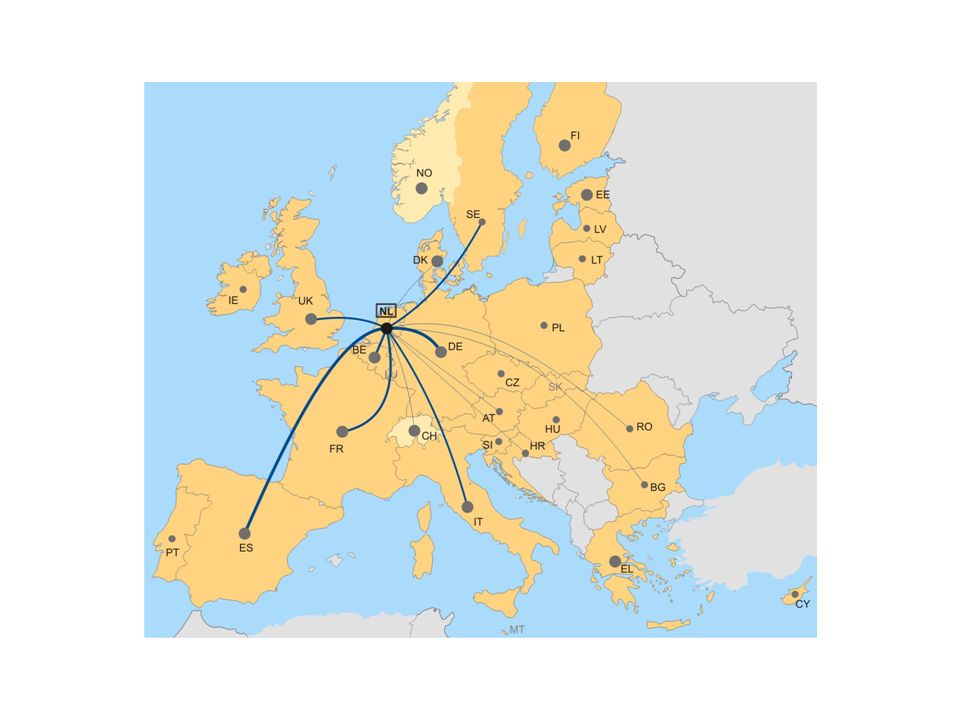
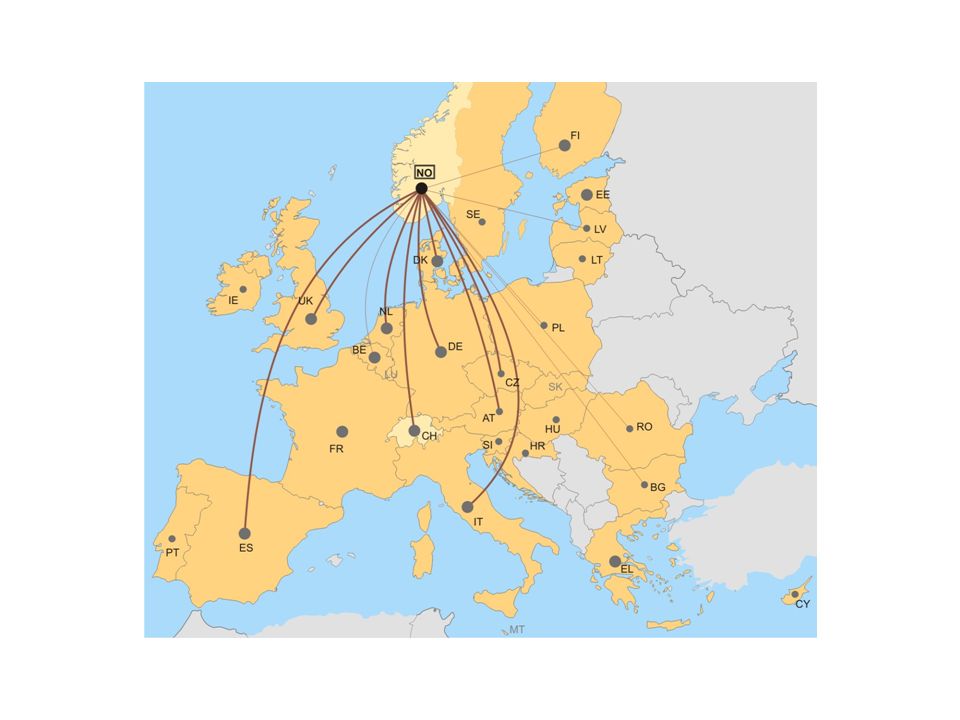
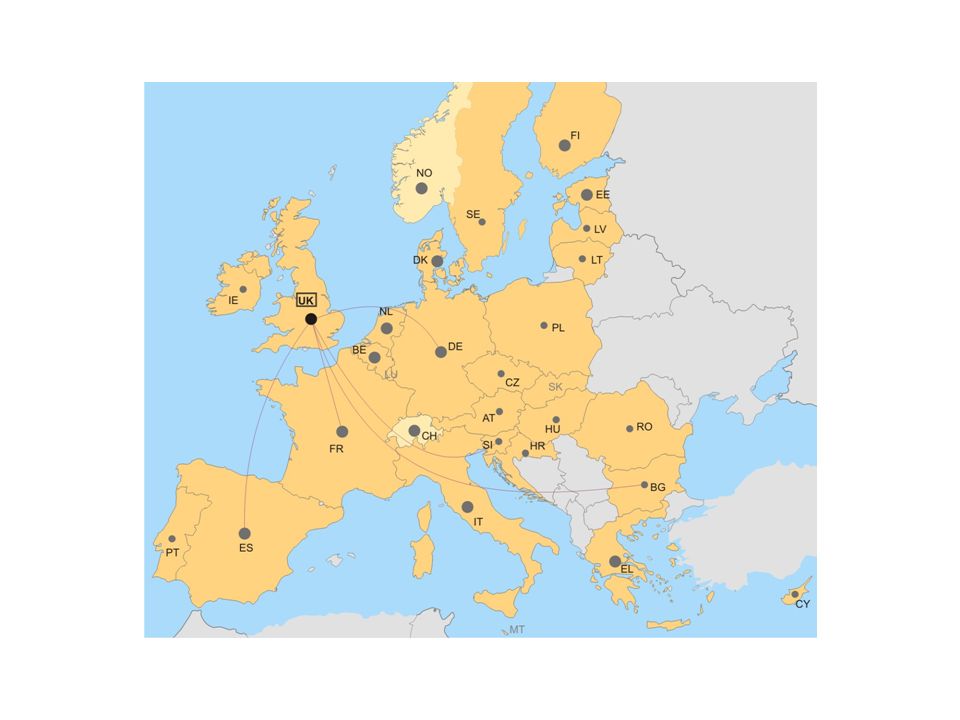
Maps of cooperation Multinational cooperation links

14
Maps of cooperation Multinational cooperation links

15
Maps of cooperation Multinational cooperation links

16
Maps of cooperation Multinational cooperation links

17
Maps of cooperation Multinational cooperation links

18
Maps of cooperation Multinational cooperation links

19
Maps of cooperation Multinational cooperation links

20
Maps of cooperation Multinational cooperation links

21
Maps of cooperation Conclusions Western Europe – the most project leaders Western Europe – largest budgets Eastern Europe – the least project leaders Eastern Europe – smallest budgets Strong polarization West ↔ East Weak cooperation in East between neighbors

23
Backup

24
DSO s are leading in 70 projects, utilities in 45, for 57% of total investment Universities/research centers and TSOs respectively account for 23% and 20% Which companies are participating in SG projects in EU? Share of participation per organization

Similar presentations


>")


 BUSINESS SUPPORTING ACTIVITIES AND PROJECTS.>")


