Download presentation
Presentation is loading. Please wait.

2
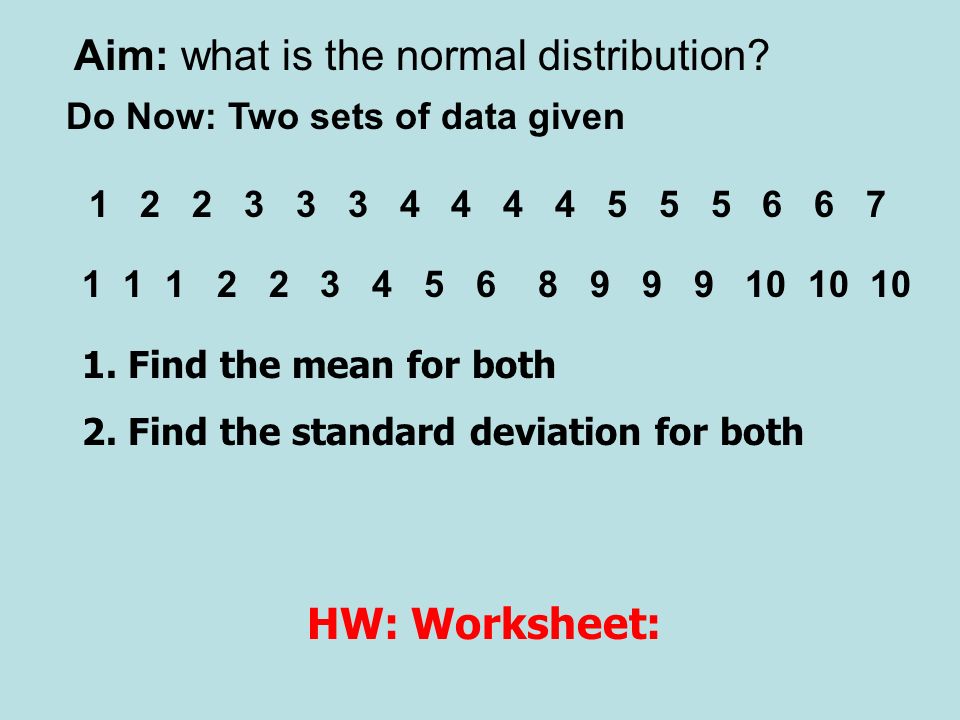
Aim: what is the normal distribution? Do Now: Two sets of data given 1 2 2 3 3 3 4 4 4 4 5 5 5 6 6 7 1 1 1 2 2 3 4 5 6 8 9 9 9 10 10 10 1. Find the mean for both 2. Find the standard deviation for both HW: Worksheet:

3
xixi fifi 11 22 33 44 53 62 71 xixi fifi 13 22 31 41 51 61 81 93 103 Frequency Table

6
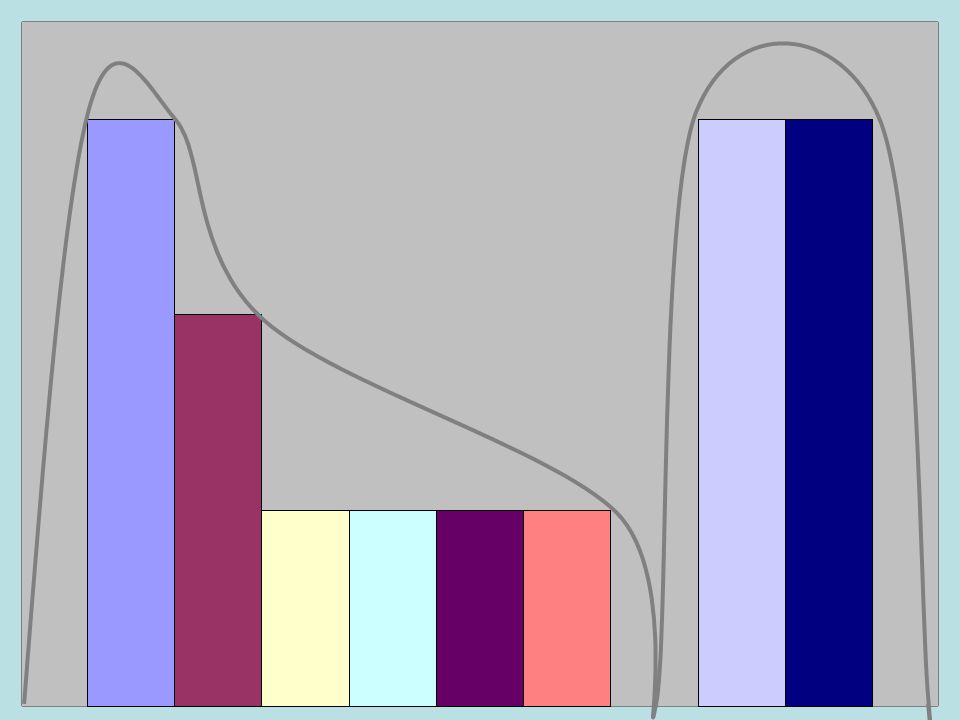
A bell-shaped curve called the normal curve In a normal curve, the greatest frequency occurs at a data value in the center of the distribution. The distribution of data represented by the normal curve is called a normal distribution This center value is the mean, μ

7
0 Normal Curve 68% 95% 99.5%

8
68% of the scores fall within of the mean 95% of the scores fall withinof the mean 99.5% of the scores fall within of the mean A normal curve is divided into several sections by the standard deviations

9
A normal curve divided into 100%, therefore we can find the percentile of a certain score.

10
102.1 locates on -1.5 standard deviation or on about 7 th percentile. Then the answer is choice (1)
")
Similar presentations

FREQUENCY 52-530.5 53-541.5 54-551 55-562 56-576.5 57-5818 58-5934.5 59-6079.5.>")


Which set has the largest standard deviation? The smallest? a. 0 10 20 30 40 b. 0 0 20 40 40 c. 0 19 20 21 40 2)Without calculating,>")


