Download presentation
Presentation is loading. Please wait.

1
Current Evidence for Estimating Energy Requirements
Clare Soulsby, Research Dietitian

2
Main components of energy expenditure:
basal metabolic rate (BMR) alteration in BMR due to disease process (stress factors) activity diet induced thermogenesis (DIT)
 alteration in BMR due to disease process (stress factors) activity. diet induced thermogenesis (DIT)")
3
Estimating BMR: controversies
basal metabolic rate (BMR) vs. resting energy expenditure (REE) prediction equations vs. measured energy expenditure (MEE)
 vs. resting energy expenditure (REE) prediction equations vs. measured energy expenditure (MEE)")
4
Conditions essential for measuring BMR
post-absorptive (12 hour fast) lying still at physical and mental rest thermo-neutral environment (27 – 29oC) no tea/coffee/nicotine in previous 12 hours no heavy physical activity previous day gases must be calibrated establish steady-state (~ 30 minutes) * if any of the above conditions are not met = REE
 lying still at physical and mental rest. thermo-neutral environment (27 – 29oC) no tea/coffee/nicotine in previous 12 hours. no heavy physical activity previous day. gases must be calibrated. establish steady-state (~ 30 minutes) * if any of the above conditions are not met = REE.")
5
Estimating BMR: controversies
basal metabolic rate (BMR) vs. resting energy expenditure (REE) prediction equations vs. measured energy expenditure (MEE)
 vs. resting energy expenditure (REE) prediction equations vs. measured energy expenditure (MEE)")
6
Estimating BMR: prediction equations
may over or under-estimate (compared with MEE) inadequately validated poor predictive value for individuals open to misinterpretation (Cortes & Nelson, 1989; Malone, 2002; Reeves & Capra, 2003)
 inadequately validated. poor predictive value for individuals. open to misinterpretation. (Cortes & Nelson, 1989; Malone, 2002; Reeves & Capra, 2003)")
8
Estimating BMR:which equation?
Harris-Benedict Schofield Equations disease specific eg Ireton Jones Kcal/kg

9
Estimating BMR: Harris Benedict Equations
Developed in 1919 From data collected between 1909 and 1917 (Harris Benedict 1919) Study population: 136 men; mean age 27 ± 9 yrs, mean BMI 21.4 ± 2.8 103 women; mean age 31 ± 14 yrs, mean BMI 21.5 ± 4.1 Tends to overestimate in healthy individuals (Daly 1985, Owen 1986, Owen 1987)
 Study population: 136 men; mean age 27 ± 9 yrs, mean BMI 21.4 ± women; mean age 31 ± 14 yrs, mean BMI 21.5 ± 4.1. Tends to overestimate in healthy individuals (Daly 1985, Owen 1986, Owen 1987)")
10
Estimating BMR: Schofield Equations
developed in 1985 (Schofield 1985) meta analysis of 100 studies of 3500men and 1200 women studies conducted between 1914 and 1980 (including Harris Benedict data) 2200 (46%) subjects were military Italian adults 88 (1.2%) subjects were >60 years SE kcal/d (women) kcal/d (men) (Schofield 1985)
 meta analysis of 100 studies of 3500men and 1200 women. studies conducted between 1914 and 1980 (including Harris Benedict data) 2200 (46%) subjects were military Italian adults. 88 (1.2%) subjects were >60 years. SE kcal/d (women) kcal/d (men) (Schofield 1985)")
11
Estimating BMR: disease specific equations
developed for specific patient groups (Ireton Jones 1992, Ireton Jones 2002) advantage over Schofield/ HB equations: Schofield /HB estimate BMR of a healthy individual then necessary to adjust for disease using a stress factors disease specific equations include patients in their database so aim to more accurately reflect BMR of hospitalised patients
 advantage over Schofield/ HB equations: Schofield /HB estimate BMR of a healthy individual then necessary to adjust for disease using a stress factors. disease specific equations include patients in their database so aim to more accurately reflect BMR of hospitalised patients.")
12
Estimating BMR: Ireton-Jones energy equations
ventilated and breathing ICU patients 3 x 1 minute measurements 200 patients unclear whether measurements took place during feed infusion/ after treatment etc 52% burns, 31% trauma validation studies, IJEE had a better agreement with MEE: HBx1.2, HBx1.3, 21kcal/kg

13
Estimating BMR Schofield equation derived using meta analysis:
greater power than small/ local studies compiled from unstructured data set obtained for diverse reasons: problems with sampling assumptions accuracy approx ±15% disease specific equations useful in some circumstances

14
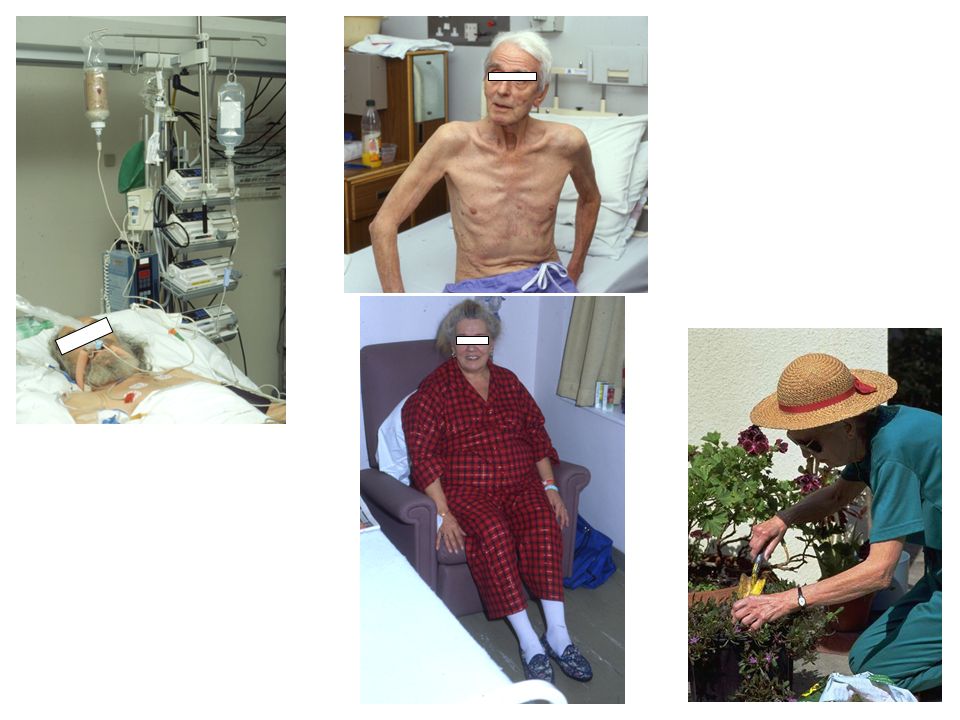
Estimating BMR what about: the elderly? the obese?

15
Estimating BMR: the elderly
Original Schofield equations: only 88 (1.2%) of subjects >60 years particularly unsuitable for >75yr included data on subjects from the tropics Revised equations for the elderly: published in the 1991 COMA (DH 1991) include additional data from 2 studies; 101 Glaswegian men (60-70yr) 170 Italian men and 180 Italian women excluded data collected in the tropics
 of subjects >60 years. particularly unsuitable for >75yr. included data on subjects from the tropics. Revised equations for the elderly: published in the 1991 COMA (DH 1991) include additional data from 2 studies; 101 Glaswegian men (60-70yr) 170 Italian men and 180 Italian women. excluded data collected in the tropics.")
16
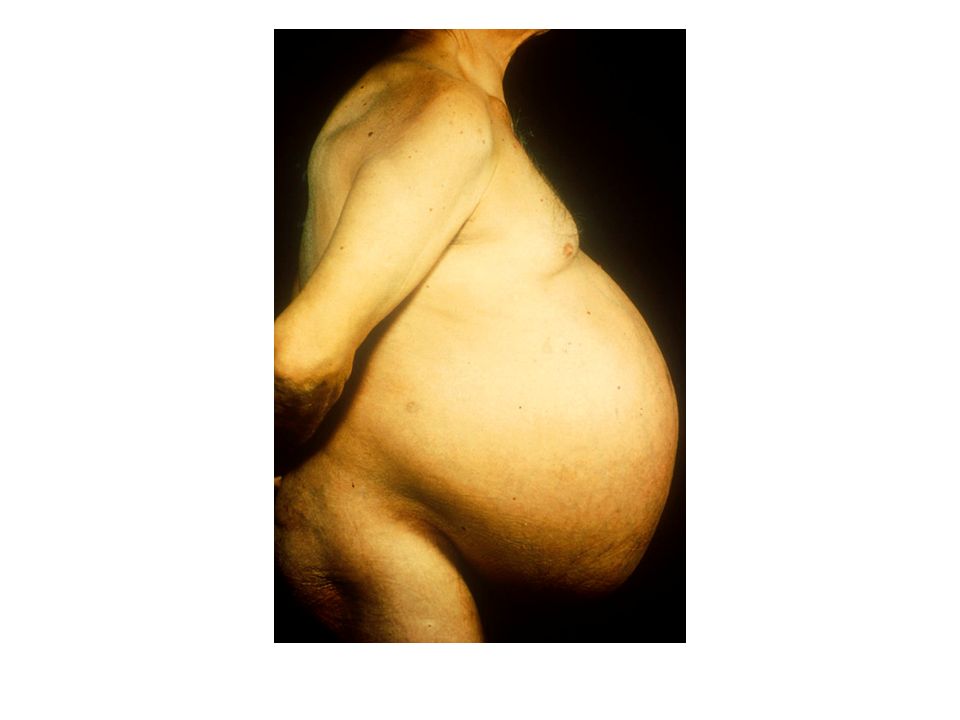
Estimating BMR: Obesity
equations (such as Schofield) are linear weight increases linearly with estimated BMR may overestimate in obese
 are linear. weight increases linearly with estimated BMR. may overestimate in obese.")
17
Estimating BMR: obesity
BMI % of Schofield database % of UK population (DOH 1999) > 25 14.6% 40.8% > 30 4.5% 9.7%
 > % 40.8% > % 9.7%")
18
Estimating BMR: Obesity
obese data primarily obtained from 2 groups: Burmese hill dwellers retired Italian military there were significant differences in weight/ BMR association between groups, Italian group showed greatest difference obese subjects in Schofield data may not be a statistically representative sample of the population is general

19
Estimating BMR: Obesity
recent (Horgan 2003) reassessed validity of the Schofield data to predict BMR in obese conclusions: BMR increases more slowly at heavier weights to ignore this is to over predict energy requirements any general equation for predicting BMR may be biased for some groups or populations.
 reassessed validity of the Schofield data to predict BMR in obese. conclusions: BMR increases more slowly at heavier weights. to ignore this is to over predict energy requirements. any general equation for predicting BMR may be biased for some groups or populations.")
20
Estimating BMR: adjusted body weight (ADJ)
estimate of how much of the extra body weight is lean and thus metabolically active 2 methods: 25% adjusted weight = (actual body weight x 0.25) + ideal body weight adjusted average weight = (actual body weight + ideal body weight) x 0.5
 + ideal body weight. adjusted average weight. = (actual body weight + ideal body weight) x 0.5.")
21
Estimating BMR: adjusted body weight (ADJ)
first reported in newsletter Q&A format not validated studies suggest adjusted average weight has better predictive value than 25% adjusted weight (Glynn 1998, Barak 2002) no longer included in ASPEN guidelines (2002)
 no longer included in ASPEN guidelines (2002)")
22
Estimating BMR: Obesity
predicting BMR is very difficult (without measuring lean body mass) adequacy of specific equations? (Ireton-Jones et al., 1992; Glynn et al., 1998) actual body weight + stress + activity = overestimate access to indirect calorimetry is limited
 adequacy of specific equations (Ireton-Jones et al., 1992; Glynn et al., 1998) actual body weight + stress + activity = overestimate. access to indirect calorimetry is limited.")
23
Determining energy requirements in obesity
non stressed patients: calculate as normal and kcal for decrease in energy stores mild to moderately stress: calculate as normal omission of stress and activity avoids the adverse effects of overfeeding severe stress might be necessary to add a stress factor to BMR *monitoring essential eg blood glucose

24
Estimating energy requirements
The main components of energy expenditure are estimated: BMR Alteration in BMR due to disease process (stress factors) Activity DIT
 Activity. DIT.")
25
Levels of evidence 1. a) Meta-analyses
b) Systematic reviews of randomised controlled trials (RCTs) c) RCTs 2. a) Systematic reviews of case-control or cohort studies b) Case-control or cohort studies 3. Non-analytic studies e.g. case studies 4. Expert opinion (adapted from: Draft NICE Guidelines for Nutrition Support in Adults, 2005)
 Systematic reviews of randomised controlled trials (RCTs) c) RCTs. 2. a) Systematic reviews of case-control or cohort studies. b) Case-control or cohort studies. 3. Non-analytic studies e.g. case studies. 4. Expert opinion. (adapted from: Draft NICE Guidelines for Nutrition Support in Adults, 2005)")
26
Stress factors timing of measurements
over (hyperalimentation) vs. under-feeding changes in therapeutic interventions e.g. improved wound care, anti-pyretics, sedation, control of ambient room temperature err towards lower end of the range and monitor
 vs. under-feeding. changes in therapeutic interventions. e.g. improved wound care, anti-pyretics, sedation, control of ambient room temperature. err towards lower end of the range and monitor.")
27
Stress factors unable to include a stress factor for every disease or condition many measured in far from ideal circumstances limited by data available may choose to underfeed in certain circumstances necessary to refer back to the literature included a checklist of factors to look for when reviewing papers

28
Adverse effect of over-feeding
excess carbohydrate: difficulties controlling blood glucose increased CO2 production respiratory problems in vulnerable patients (eg COPD/ ventilated) swings in blood glucose increase mortality in critically ill aim not to exceed the glucose oxidation rate (4-7 mg glucose/ kg/ min) long term excess carbohydrate can lead to steatohepatosis or fatty liver (Elwyn DH, 1987).
 swings in blood glucose increase mortality in critically ill. aim not to exceed the glucose oxidation rate (4-7 mg glucose/ kg/ min) long term excess carbohydrate can lead to steatohepatosis or fatty liver (Elwyn DH, 1987).")
29
Estimating energy requirements
The main components of energy expenditure are estimated: BMR Alteration in BMR due to disease process Activity DIT

30
Total energy expenditure
Activity + DIT Activity + DIT BMR BMR Health Disease

31
Activity factor energy expended during active movement of skeletal muscle approximately 20-40% of energy expenditure in free living individuals depends on duration and intensity of the exercise activity is less than 20% of the energy expenditure in hospitalised or institutionalised NB assumes normal muscle function

32
Activity factor for activity: institutionalised patients combined with DIT
Activity level Males and females Bedbound immobile Bedbound mobile/ sitting Mobile on ward + 10% + 15 – 20% + 25%

33
Activity factor:abnormal muscle function
hospital patients likely to have higher activity levels: abnormal neuro-muscular function e.g. brain injury, Parkinson’s, cerebral palsy, motor neurone disease, and Huntington’s chorea prolonged active physiotherapy effort involved in moving injured or painful limbs

34
Community patients free living individuals have higher energy expenditure due to physical activity nursing home and house bound patients ? similar activity levels to hospital patients for active patients in the community a PAL should be added

35
Physical activity level (PAL) of adults
Non-occupational activity occupational activity light M F moderate mod/ heavy M F non active m. active very active

36
Estimating energy requirements
The main components of energy expenditure are estimated: BMR Alteration in BMR due to disease process Activity DIT

37
Diet-induced thermogenesis
Continuous infusion of enteral feed and parenteral nutrition do not significantly increase REE Bolus feeding increases REE by ~ 5% Mixed meal increases REE ~ 10 % PALs include DIT (COMA, 1991) guidelines include combined factor for activity and DIT
 guidelines include combined factor for activity and DIT.")
38
Estimating requirements: sources of error
prediction equation for BMR stress factor: degree of stress inaccurately assessed poor evidence to support stress factor used activity level inaccurately assessed or poorly understood DIT varies by 10% depending on feeding method

39
Sources of error: inaccurate weight
Inaccurately measured weight estimated weight inaccurate scales patient had their feet on the floor (chair scales) patient was fluid overloaded ( 20% of hospital patients) amputees
 patient was fluid overloaded ( 20% of hospital patients) amputees.")
41
Conclusions Estimated requirements are only a starting point
- set realistic goals of treatment for each patient - monitor and amend as patient’s condition changes Review and criticise the literature regularly - be aware of gaps in the evidence - understand the limitations of guidelines - check applicability to your patients Contribute to research and audit projects

Similar presentations
 to Nutritional Support Alan Shenkin Department of Clinical Chemistry University of Liverpool.>")


>")


 supports research into obesity, insulin resistance, diabetes and disorders of energy balance. We aim to increase the.>")


>")