Download presentation
Presentation is loading. Please wait.

1
Exploring Relationships: Correlations & Multiple Linear Regression Dr James Betts Developing Study Skills and Research Methods (HL20107)
")
2
Lecture Outline: Correlation Coefficients Coefficients of Determinations Prediction & Regression Multiple Linear Regression Assessment Details.

3
StatisticsDescriptiveInferentialCorrelational Relationships GeneralisingOrganising, summarising & describing data Significance

4
Correlation A measure of the relationship (correlation) between interval/ratio LOM variables taken from the same set of subjects A ratio which indicates the amount of concomitant variation between two sets of scores This ratio is expressed as a correlation coefficient (r): Perfect Negative Relationship Perfect Positive Relationship No Relationship + _ Strong ModerateWeak Strong ModerateWeak +10 +0.7 +0.3+0.1 -0.7-0.3-0.1
 between interval/ratio LOM variables taken from the same set of subjects A ratio which indicates the amount of concomitant variation between two sets of scores This ratio is expressed as a correlation coefficient (r): Perfect Negative Relationship Perfect Positive Relationship No Relationship + _ Strong ModerateWeak Strong ModerateWeak")
5
Correlation Coefficient & Scatterplots Direction Variable X (e.g. VO 2 max). Variable Y (e.g. 10 km run time) Variable X (e.g. VO 2 max) Variable Y (e.g. Exercise Capacity).
. Variable Y (e.g. 10 km run time) Variable X (e.g. VO 2 max) Variable Y (e.g. Exercise Capacity)..")
6
Correlation Coefficient & Scatterplots Variable X (e.g. VO 2 max) Variable Y (e.g. Exercise Capacity). Variable X (e.g. Age) Variable Y (e.g. Strength) Form
 Variable Y (e.g. Exercise Capacity). Variable X (e.g. Age) Variable Y (e.g. Strength) Form.")
7
Correlation Coefficient & Scatterplots Variable X (e.g. VO 2 max) Variable Y (e.g. Exercise Capacity). Significance Variable X (e.g. VO 2 max) Variable Y (e.g. 100 m Sprint time).
 Variable Y (e.g. Exercise Capacity). Significance Variable X (e.g. VO 2 max) Variable Y (e.g. 100 m Sprint time)..")
8
Correlation Coefficient & Scatterplots Variable X (e.g. VO 2 max) Variable Y (e.g. Exercise Capacity). Variable X (e.g. VO 2 max) Variable Y (e.g. 100 m sprint time). Significance
 Variable Y (e.g. Exercise Capacity). Variable X (e.g. VO 2 max) Variable Y (e.g. 100 m sprint time). Significance.")
9
Methods of Calculating r Any method of calculating r requires: –Homoscedacity (i.e. equal scattering) –Linear data (curvilinear data requires eta η) Parametric data (i.e. raw data >ordinal LOM and either normal distribution or large sample) permits the use of Pearsons Product-Moment Correlation If raw data violates these assumptions then use Spearmans Rank Order Correlation instead.
 –Linear data (curvilinear data requires eta η) Parametric data (i.e. raw data >ordinal LOM and either normal distribution or large sample) permits the use of Pearsons Product-Moment Correlation If raw data violates these assumptions then use Spearmans Rank Order Correlation instead..")
10
X = Alcohol UnitsY = Skill ScoreX2X2 Y2Y2 XY 1542251660 1461963684 1041001640 98816472 87644956 8864 7104910070 69368154 4141619656 212414424 Totals= Pearsons Product-Moment Correlation

11
r = n XY-( X)( Y) [n X 2 -( X) 2 ] [n Y 2 -( Y) 2 Pearsons Product-Moment Correlation
![r = n XY-( X)( Y) [n X 2 -( X) 2 ] [n Y 2 -( Y) 2 Pearsons Product-Moment Correlation](http://images.slideplayer.com/3/781476/slides/slide_11.jpg "r = n XY-( X)( Y) [n X 2 -( X) 2 ] [n Y 2 -( Y) 2 Pearsons Product-Moment Correlation")
12
X = Alcohol UnitsY = Skill ScoreRank XRank YDD2D2 154101.58.572 14693636 10481.56.542 9875.51.52.3 875.541.52.3 885.5 00 71048416 69374 414210864 21219864 Total= Spearmans Rank-Order Correlation

13
r = 1 - 6 D 2 n(n 2 -1)
")
15
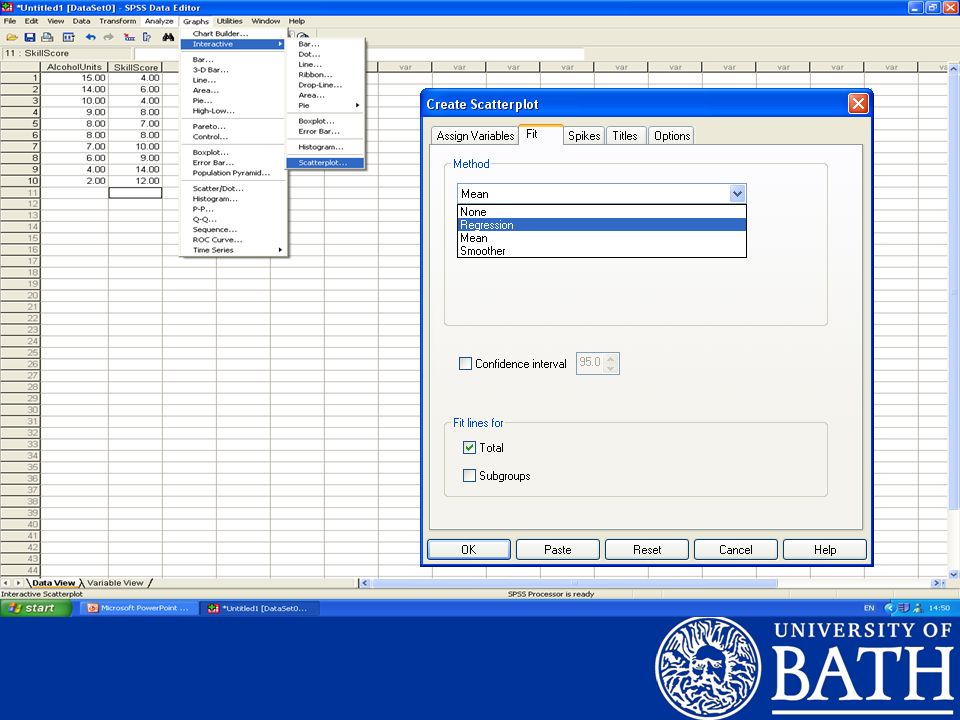
SPSS Correlation Outputs

16
Coefficient of Determination (r 2 x 100) AKA variance explained, this figure denotes how much of the variance in Y can be explained/predicted by X e.g. to predict long jump distance (Y) from maximum sprint speed (X) r= 0.8 r 2 = 64% YX
 from maximum sprint speed (X) r= 0.8 r 2 = 64% YX.")
17
Correlation versus Regression By attempting to predict one variable using another, we are now moving away from simple correlation and moving into the concept of regression Correlation = Regression =

18
Linear Regression The equation for a linear relationship can be expressed as: Y= a + bX - where: a = the y intercept; and b = the gradient Variable X (e.g. VO 2 max) Variable Y (e.g. Exercise Capacity).
 Variable Y (e.g. Exercise Capacity)..")
21
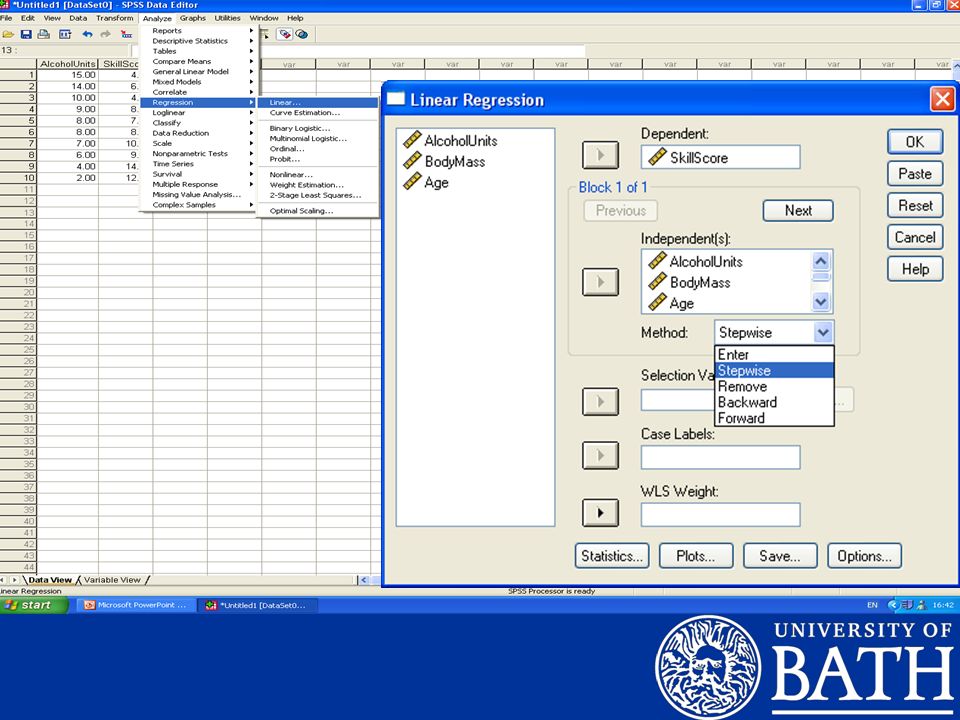
SPSS Regression Output

22
Extrapolation versus Interpolation Variable X (e.g. VO 2 max) Variable Y (e.g. Exercise Capacity). Remember that the accuracy of your equation depends upon the linear relationship you observed ? Interpolation = Extrapolation =
 Variable Y (e.g. Exercise Capacity). Remember that the accuracy of your equation depends upon the linear relationship you observed . Interpolation = Extrapolation =.")
23
Multiple Linear Regression We saw earlier how maximum sprint speed (X) can predict/explain 64% of variance in long jump distance (Y) Y X r 2 = 64% …but can Y be predicted any more effectively using more than one independent variable (i.e. X 1, X 2, X 3, etc)?
 .")
24
Multiple Linear Regression However, we can often predict Y effectively just using a specific subset of X variables (i.e. a reduced model) Y X1X1 X 2 Event Experience
 Y X1X1 X 2 Event Experience.")
25
Multiple Linear Regression Best Subset Selection Methods involve calculation of r for every possible combination of IVs Stepwise regression methods involve gradually either adding or removing variables and monitoring the impact of each action on r. –Standard methods add and remove variables –Forward selection methods begin with 1 IV and add more –Backwards elimination methods begin with all IVs and remove The order in which IVs are added/removed is critical as the variance explained solely by any one will be entirely dependent upon the presence of others.

27
SPSS Multiple Linear Regression Output

28
Summary: Exploring Relationships The relationship between two variables can be expressed as a correlation coefficient (r) The coefficient of determination (r 2 ) denotes the % of one variable that is explained by another Linear regression can provide an equation with which to predict one variable from another Multiple linear regression can potentially improve this prediction using multiple predictor variables.
 The coefficient of determination (r 2 ) denotes the % of one variable that is explained by another Linear regression can provide an equation with which to predict one variable from another Multiple linear regression can potentially improve this prediction using multiple predictor variables.")
29
Coursework Project (40 % overall grade) Your coursework will require you to address 2 out of 3 research scenarios that are available on the unit webpage For each of the 2 scenarios you will need to: –Perform a literature search in order to provide a comprehensive introduction to the research area –Identify the variables of interest and evaluate the research design which was adopted –Formulate and state appropriate hypotheses…
 Your coursework will require you to address 2 out of 3 research scenarios that are available on the unit webpage For each of the 2 scenarios you will need to: –Perform a literature search in order to provide a comprehensive introduction to the research area –Identify the variables of interest and evaluate the research design which was adopted –Formulate and state appropriate hypotheses…")
30
Contd… –Summarise descriptive statistics in an appropriate and well presented manner –Select the most appropriate statistical test with justification for your decision –Transfer the output of your inferential statistics into your word document –Interpret your results and discuss the validity and reliability of the study –Draw a meaningful conclusion (state whether hypotheses are accepted or rejected).
.")
31
Coursework Details (see unit outline) 2000 words maximum (i.e. 1000 for each) Any supporting SPSS data/outputs to be appended To be submitted on Thursday 6 th May Assessment Weighting Evaluation & Analysis (30 %) Reading & Research (20 %) Communication & Presentation (20 %) Knowledge (30 %)
 Any supporting SPSS data/outputs to be appended To be submitted on Thursday 6 th May Assessment Weighting Evaluation & Analysis (30 %) Reading & Research (20 %) Communication & Presentation (20 %) Knowledge (30 %).")
32
Coursework Details All information relating to your coursework (including the relevant data files) are accessible via the module web page: http://people.bath.ac.uk/jb335/Y2%20Research%20Skills%20(FH200107).html Web address also referenced on shared area Electronic copy to be included with submission. Any further questions/problems can be raised in the CW revision lecture/labs after Easter

33
Timed Practical Computing Exercise (20 % overall grade) This test will involve analysis/interpretation of the resultant data assessed via short answer questions Practice session Wednesday 14 th April Duration = 80 min (2 groups) I will Email specific details after Easter.
 This test will involve analysis/interpretation of the resultant data assessed via short answer questions Practice session Wednesday 14 th April Duration = 80 min (2 groups) I will specific details after Easter.")
34
both IVs unpaired Both IVs paired >2 variables 2 variables >2 groups 2 groups >2 observations 2 observations >1 observed frequency 1 observed frequency Looking for differences between categories/frequencies? (i.e. nominal LOM) Goodness of Fit χ 2 Looking for differences within the same group of subjects? (i.e. paired data) Looking for differences between 2 separate groups of subjects? (i.e. unpaired data) Looking for relationships? Looking for differences with >1 independent variable? Contingency χ 2 Paired t-test 1-way paired ANOVA Independent t-test 1-way unpaired ANOVA Pearsons r Multiple Linear Regression 2-way paired ANOVA 2-way unpaired ANOVA 1 IV paired 1 IV unpaired 2-way mixed model ANOVA Wilcoxon test Friedmans test Mann-Whitney test Kruskal Wallis test Spearmans r Post-Hoc Tests non-parametric Start Here If multiple DVs are involved then use MANOVA
 Goodness of Fit χ 2 Looking for differences within the same group of subjects. (i.e. paired data) Looking for differences between 2 separate groups of subjects. (i.e. unpaired data) Looking for relationships. Looking for differences with >1 independent variable. Contingency χ 2 Paired t-test 1-way paired ANOVA Independent t-test 1-way unpaired ANOVA Pearsons r Multiple Linear Regression 2-way paired ANOVA 2-way unpaired ANOVA 1 IV paired 1 IV unpaired 2-way mixed model ANOVA Wilcoxon test Friedmans test Mann-Whitney test Kruskal Wallis test Spearmans r Post-Hoc Tests non-parametric Start Here If multiple DVs are involved then use MANOVA.")
Similar presentations


>")


