Download presentation
Presentation is loading. Please wait.

1
OCEAN STRATIFICATION

2
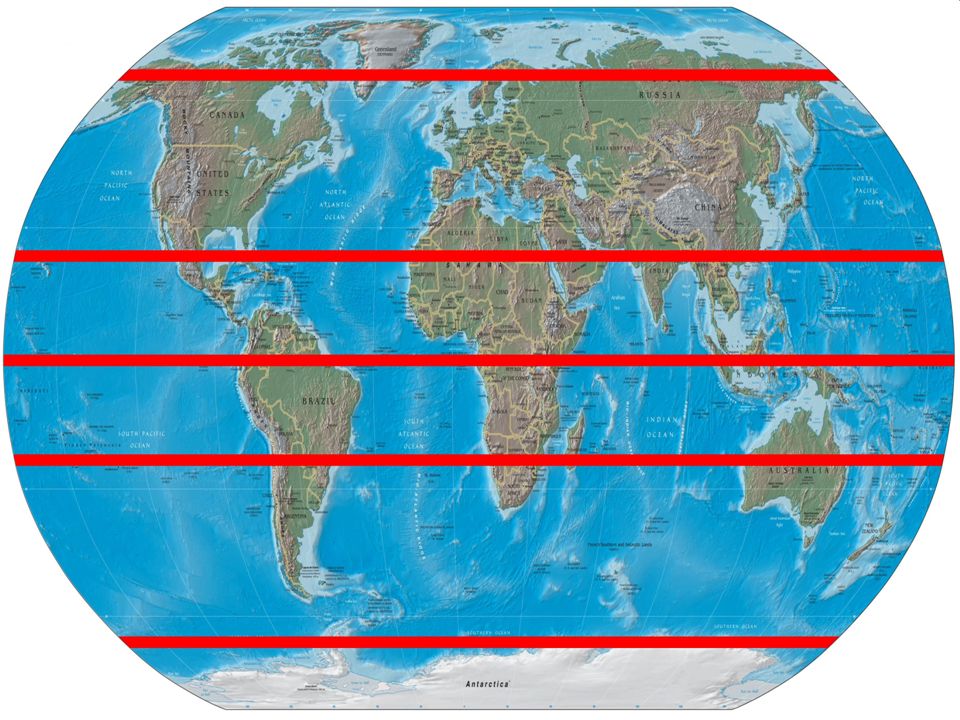
SURFACE AND DEPTH SALINITY VARIATIONS Surface variations – Varies with latitude Lowest at high latitudes Highest at tropics of Cancer and Capricorn Dips near the Equator

3
Surface Variations Why vary at the surface? – High Latitudes: low salinity Lots of precipitation Melting of ice Runoff Limited evaporation

4
Surface Variations Why vary at the surface? – Tropics of Capricorn and Cancer: High salinity Warm air descends here Evaporation rates are high Little precipitation Little runoff

6
Surface Variation Why vary at the surface? – Equator: Warm temperatures High evaporation rates Increased precipitation Increased runoff Kind of offset one another

7
Depth Salinity Variation Low latitude regions – High salinity at surface – Dips to intermediate level with depth High latitude regions – Low salinity at surface – Goes to intermediate level with depth – Approaches value of low latitude version at depth Salinity varies little with ocean depth

8
The Halocline Rapid change in salinity with depth – Between 300m – 1000m Low latitude: – Curve is a decrease in salinity High latitude: – Curve is an increase in salinity

10
SEAWATER DENSITY Pure water = 1.000g/cm 3 at 4°C Seawater: – Dissolved substances increase density – 1.022 – 1.030g/cm 3

11
The ocean is layered Ocean Stratification – Lower density floats on top – Higher density at bottom

12
Density is affected by… Temperature: – Density increases as temperature decreases – Greatest influence Salinity: – Density increases as salinity increases – Has more effect at poles Pressure: – Density increases as pressure increases – Least effect

13
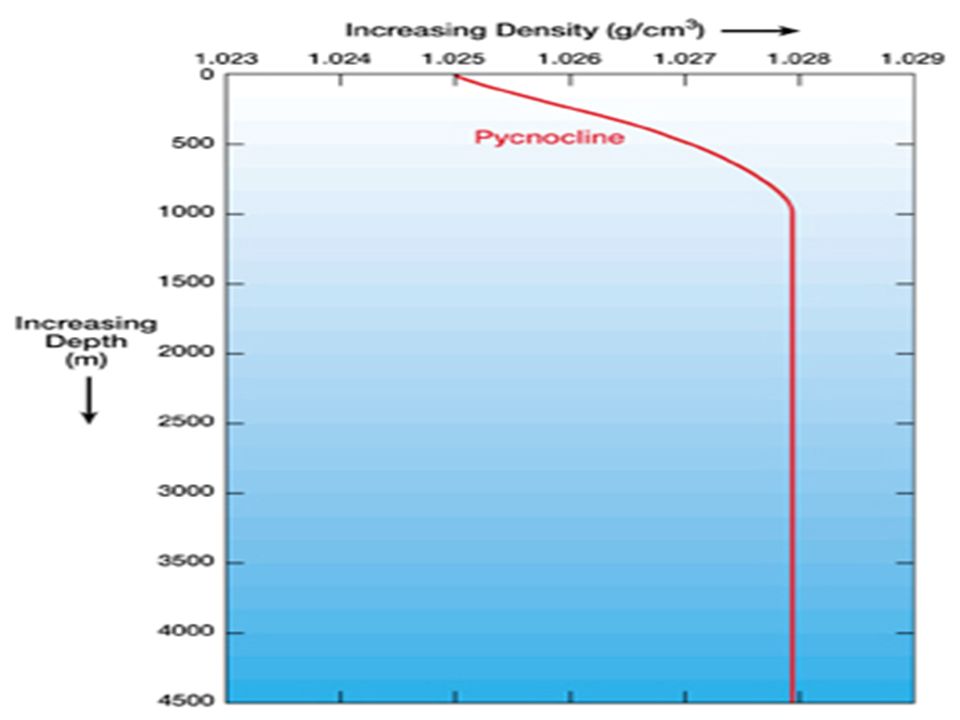
Density curves – low-latitude Density remains fairly constant till 300m – Good surface mixing from currents, waves and tides Below 300m: – Density increases rapidly with depth to 1000m Below 1000m: – Density remains constant

14
Density curve – High latitudes Very little variation with depth High density at surface – low water temp High density below the surface –low water temp Straight line

15
Pycnocline and Thermocline Pycnocline: – Layer of rapidly changing density with depth Thermocline: – Layer of rapidly changing temperature with depth Typically occurs between 300-1000m

18
Thermoclines in High Latitudes Cold year round surface water Thermocline and pycnocline rarely develop – Only during the short summer Long days of sunlight – Stays isothermal and isopycnal

19
Why is it important? Pycnocline=barrier to mixing – Results from combined effects of halo and thermoclines – Results in a layered ocean

Similar presentations


 Temperature 2.) Salinity 3.) Pressure Density increases with increasing salinity Density.>")


