Download presentation
Presentation is loading. Please wait.

1
Graphing Quadratic Equations in Vertex and Intercept Form
Section 4.2 Graphing Quadratic Equations in Vertex and Intercept Form

2
The y intercept of the graph is c if the equation is in STANDARD FORM
Quadratic Functions A quadratic function has the form: f (x) = ax2 + bx + c Where a, b and c are real numbers and a is not equal to 0. The y intercept of the graph is c if the equation is in STANDARD FORM . The basic shape of the graph is a PARABOLA or U shaped
 = ax2 + bx + c. Where a, b and c are real numbers and. a is not equal to 0. The y intercept of the graph is c if the equation is in STANDARD FORM. . The basic shape of the graph is a PARABOLA. or U shaped.")
3
Positive Quadratic Negative Quadratic y = ax2 y = -ax2 Parabolas always have a lowest point (minimum) or a highest point (maximum, if the parabola is upside-down). This point, where the parabola changes direction, is called the "vertex".
 or a highest point (maximum, if the parabola is upside-down). This point, where the parabola changes direction, is called the vertex .")
4
Vertex- Axis of symmetry- The lowest or highest point of a parabola.
The vertical line through the vertex of the parabola. Axis of Symmetry

5
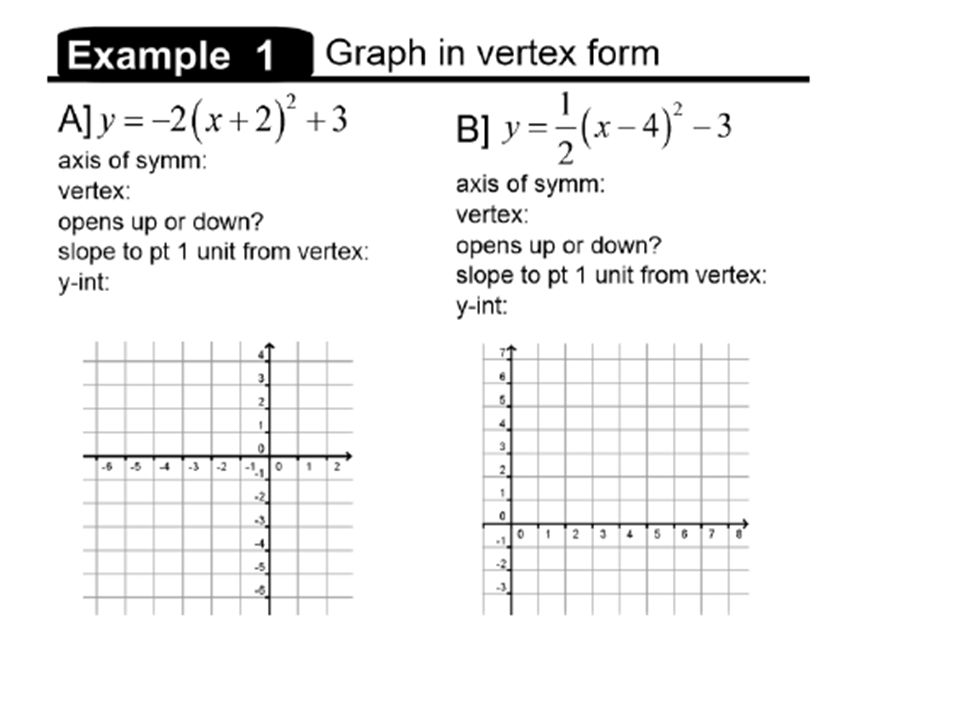
Vertex Form: y = a(x – h)2 + k, - the vertex is the point (h, k).
- the axis of symmetry is x = h - if “a” is positive it opens up - if “a” is negative it opens down Plot the vertex and then find two other points by using “a” as your rise/run

7
Vertex Form (x – h)2 + k – vertex form
Each function we just looked at can be written in the form (x – h)2 + k, where (h , k) is the vertex of the parabola, and x = h is its axis of symmetry. (x – h)2 + k – vertex form Equation Vertex Axis of Symmetry y = x2 or y = (x – 0)2 + 0 (0 , 0) x = 0 y = x2 + 2 or y = (x – 0)2 + 2 (0 , 2) y = (x – 3)2 or y = (x – 3)2 + 0 (3 , 0) x = 3
2 + k, where (h , k) is the vertex of the parabola, and x = h is its axis of symmetry. (x – h)2 + k – vertex form. Equation. Vertex. Axis of Symmetry. y = x2 or y = (x – 0) (0 , 0) x = 0. y = x2 + 2 or y = (x – 0) (0 , 2) y = (x – 3)2 or y = (x – 3) (3 , 0) x = 3.")
8
(-2, 5) EXAMPLE A Graph a quadratic function in vertex form 12
Graph y = – (x + 2)2 + 5. SOLUTION STEP 1: Identify the vertex (-2, 5) STEP 2: Plot the vertex & draw the line of symmetry STEP 3: Determine if it opens up or down
 SOLUTION. STEP 1: Identify the vertex. (-2, 5) STEP 2: Plot the vertex & draw. the line of symmetry. STEP 3: Determine if it opens up or down.")
9
EXAMPLE A Graph a quadratic function in vertex form 12 Graph y = – (x + 2)2 + 5. STEP 4: Use “a” as your rise/run Down 1 and over 2 STEP 5: Draw a parabola

12
Example B: Graph y = (x + 2)2 + 1
Analyze y = (x + 2)2 + 1. Step 1 Plot the vertex (-2 , 1) Step 2 Draw the axis of symmetry, x = -2. Step 3 Find and plot two points on one side , such as (-1, 2) and (0 , 5). Step 4 Use symmetry to complete the graph, or find two points on the left side of the vertex.
 Step 1 Plot the vertex (-2 , 1) Step 2 Draw the axis of symmetry, x = -2. Step 3 Find and plot two points on one side , such as (-1, 2) and (0 , 5). Step 4 Use symmetry to complete the graph, or find two points on the. left side of the vertex.")
13
Example C: Graph y=-.5(x+3)2+4
a is negative (a = -.5), so parabola opens down. Vertex is (h,k) or (-3,4) Axis of symmetry is the vertical line x = -3 Table of values x y -1 2 -3 4 -5 2 Vertex (-3,4) (-4,3.5) (-2,3.5) (-5,2) (-1,2) x=-3
, so parabola opens down. Vertex is (h,k) or (-3,4) Axis of symmetry is the vertical line x = -3. Table of values x y Vertex (-3,4) (-4,3.5) (-2,3.5) (-5,2) (-1,2) x=-3.")
14
Now you try one!

15
Minimum “a” is positive Maximum “a” is negative
GUIDED PRACTICE for Examples 1 and 2 Graph the function. Label the vertex and axis of symmetry. y = (x + 2)2 – 3 Minimum “a” is positive y = –(x + 1)2 + 5 Maximum “a” is negative
2 – 3. Minimum a is positive. y = –(x + 1) Maximum a is negative.")
20
Intercept Form Equation
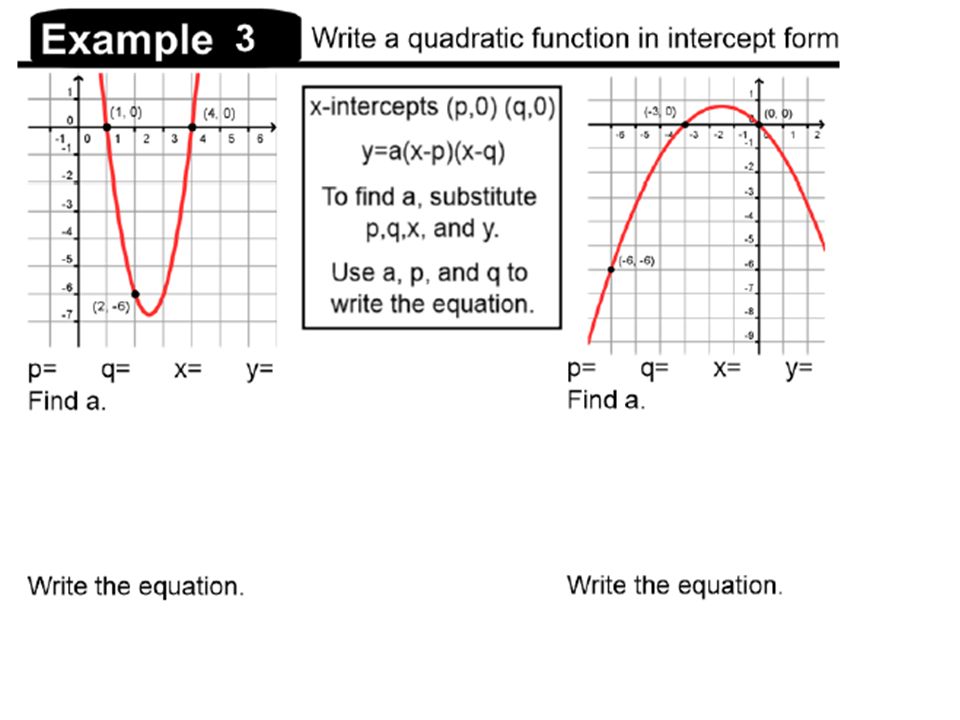
y=a(x-p)(x-q) The x-intercepts are the points (p,0) and (q,0). The axis of symmetry is the vertical line x= The x-coordinate of the vertex is To find the y-coordinate of the vertex, plug the x-coord. into the equation and solve for y. If “a” is positive, parabola opens up If “a” is negative, parabola opens down.
(x-q) The x-intercepts are the points (p,0) and (q,0). The axis of symmetry is the vertical line x= The x-coordinate of the vertex is. To find the y-coordinate of the vertex, plug the x-coord. into the equation and solve for y. If a is positive, parabola opens up. If a is negative, parabola opens down.")
22
Example D: Graph y=-(x+2)(x-4)
Since a is negative, parabola opens down. The x-intercepts are (-2,0) and (4,0) To find the x-coord. of the vertex, use To find the y-coord., plug 1 in for x. Vertex (1,9) The axis of symmetry is the vertical line x=1 (from the x-coord. of the vertex) (1,9) (-2,0) (4,0) x=1
 and (4,0) To find the x-coord. of the vertex, use. To find the y-coord., plug 1 in for x. Vertex (1,9) The axis of symmetry is the vertical line x=1 (from the x-coord. of the vertex) (1,9) (-2,0) (4,0) x=1.")
27
Now you try one! y=2(x-3)(x+1) Open up or down? X-intercepts? Vertex?
Axis of symmetry?

28
x=1 (-1,0) (3,0) (1,-8)
 (3,0) (1,-8)")
Similar presentations


 Definitions Definitions 3 forms for a quad. function 3 forms for a quad. function Steps for graphing each form.>")

>")


 = 3x 2 + 10x + 8 2.Factor f(x) = 2x 2 - 7x + 3.>")

