Download presentation
Presentation is loading. Please wait.

1
Some statistical ideas Marian Scott Statistics, University of Glasgow June 2012

2
What shall we cover? Why might we need some statistical skills Statistical inference- what is it? how to handle variation exploring data probability models inferential tools- hypothesis tests and confidence intervals Regression and relationships

3
Why quantify? We need statistical skills to: Make sense of numerical information, Summarise data, Present results (graphically), Test hypotheses Construct models Decision making- Which areas should be restricted? Prediction-What is the trend in temperature? Predict its level in 2050? Decision making-is it safe to eat fish? Regulatory- Have emission control agreements reduced air pollutants? Understanding -when did things happen in the past
, Test hypotheses Construct models Decision making- Which areas should be restricted. Prediction-What is the trend in temperature. Predict its level in Decision making-is it safe to eat fish. Regulatory- Have emission control agreements reduced air pollutants. Understanding -when did things happen in the past.")
4
Observed nitrogen signals in rivers, lakes and groundwater in Europe (EEA). What is a trend and how should we evaluate it? How sure are we?

5
Trends in seasons over Europe (Global Change Biology, 2006) 21 countries, 125,000 studies, 542 plant and 19 animal species, 1971-2000 Spring is on average 6 to 8 days earlier than it was 30 years ago Analysis of 254 national time series, pattern of observed change in spring matches measured national warming (correlation coefficient –0.69, P<0.001) What do the statistical terms mean?
 21 countries, 125,000 studies, 542 plant and 19 animal species, Spring is on average 6 to 8 days earlier than it was 30 years ago Analysis of 254 national time series, pattern of observed change in spring matches measured national warming (correlation coefficient –0.69, P<0.001) What do the statistical terms mean")
6
Spatial patterns of change Spatial patterns of change may be important Changes in the start and end of the growing season between two years (1961, 2004) –heterogeneous
 –heterogeneous")
7
the statistical process A process that allows inferences about properties of a large collection of things (the population) to be made based on observations on a small number of individuals belonging to the population (the sample). The use of valid statistical sampling techniques increases the chance that a set of specimens (the sample, in the collective sense) is collected in a manner that is representative of the population.
 is collected in a manner that is representative of the population..")
8
What is the population? The population is the set of all items that could be sampled, such as all fish in a lake, all people living in the UK, all trees in a spatially defined forest, or all 20-g soil samples from a field. Appropriate specification of the population includes a description of its spatial extent and perhaps its temporal stability

9
What are the sampling units? In some cases, sampling units are discrete entities (i.e., animals, trees), but in others, the sampling unit might be investigator-defined, and arbitrarily sized. Example- technetium in shellfish The objective here is to provide a measure (the average) of technetium in shellfish (eg lobsters for human consumption) for the west coast of Scotland. Population is all lobsters on the west coast Sampling unit is an individual animal. Variability exists amongst the sampling units and hence within the population
, but in others, the sampling unit might be investigator-defined, and arbitrarily sized. Example- technetium in shellfish The objective here is to provide a measure (the average) of technetium in shellfish (eg lobsters for human consumption) for the west coast of Scotland. Population is all lobsters on the west coast Sampling unit is an individual animal. Variability exists amongst the sampling units and hence within the population.")
10
Some other terminology Parameter: this is a number that describes the population, usually what we want to know about Example- population mean technetium level Statistic: this is a number that we calculate from the sample Example- sample mean technetium level Variability exists amongst the sampling units and hence within the population, so we could imagine hypothetically drawing different samples, all would give a different sample mean.

11
Summarising data- means, medians and other such statistics

12
Data types Numerical: a variable may be either continuous or discrete. – For a discrete variable, the values taken are whole numbers (e.g. number of invertebrates). – For a continuous variable, values taken are real numbers ( e.g. pH, alkalinity, DOC, temperature). Categorical: a limited number of categories or classes exist, each member of the sample belongs to one and only one of the classes. – Compliance is a nominal categorical variable since the categories are unordered. – Level of diluent (eg recorded as low, medium,high) would be an ordinal categorical variable since the different classes are ordered
. – For a continuous variable, values taken are real numbers ( e.g. pH, alkalinity, DOC, temperature). Categorical: a limited number of categories or classes exist, each member of the sample belongs to one and only one of the classes. – Compliance is a nominal categorical variable since the categories are unordered. – Level of diluent (eg recorded as low, medium,high) would be an ordinal categorical variable since the different classes are ordered.")
16
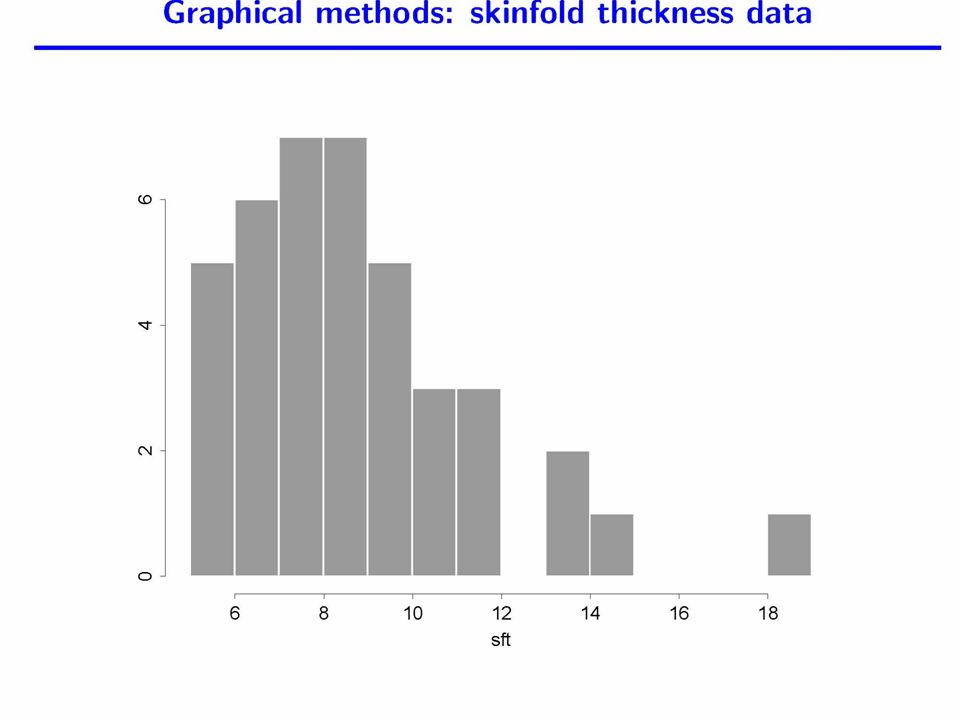
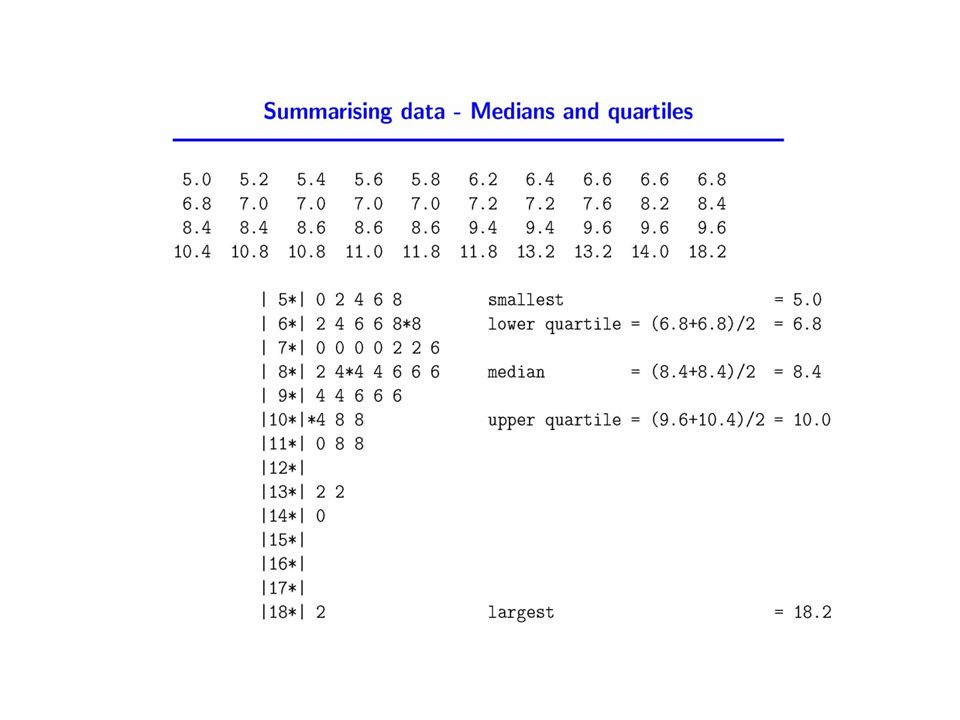
plotting data- histograms, boxplots, stem and leaf plots, scatterplots

21
median lower quartile upper quartile

22
Example -Bathing water quality All bathing water sites are classified as either Excellent, Good, Sufficient or Poor in terms of the quantities of 2 different microbiological indicator bacteria Faecal Streptococci (FS) Faecal Coliforms (FC) Sufficient is the minimum standard that bathing water sites are required to meet Classification for each site is based on the 90 th & 95 th percentiles of samples over the most recent 4 bathing seasons joint work with Ruth Haggarty, Claire Ferguson
 Faecal Coliforms (FC) Sufficient is the minimum standard that bathing water sites are required to meet Classification for each site is based on the 90 th & 95 th percentiles of samples over the most recent 4 bathing seasons joint work with Ruth Haggarty, Claire Ferguson")
23
Preliminary Analysis There is considerable variation –Across different sites –Within the same site across different years Distribution of data is highly skewed with evidence of outliers and in some cases bimodality

24
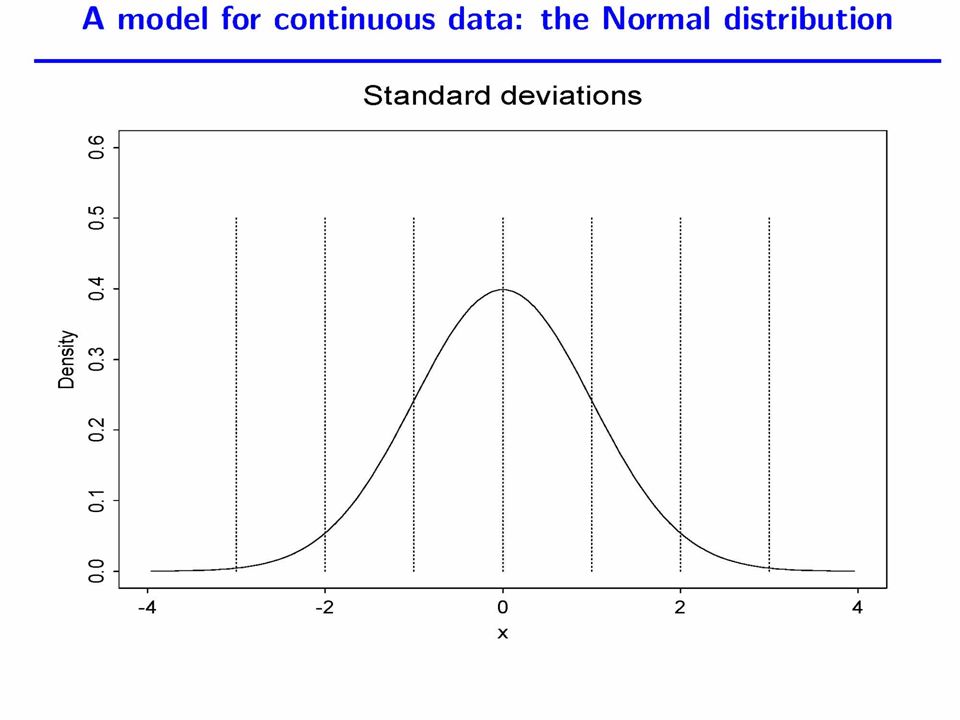
probability models- the Normal especially

30
checking distributional assumptions

32
Modelling Continuous Variables checking normality Normal probability plot Should show a straight line p-value of test is also reported (null: data are Normally distributed)
")
33
Statistical inference Confidence intervals Hypothesis testing and the p-value Statistical significance vs real-world importance Building statistical models

34
a formal statistical procedure- confidence intervals

35
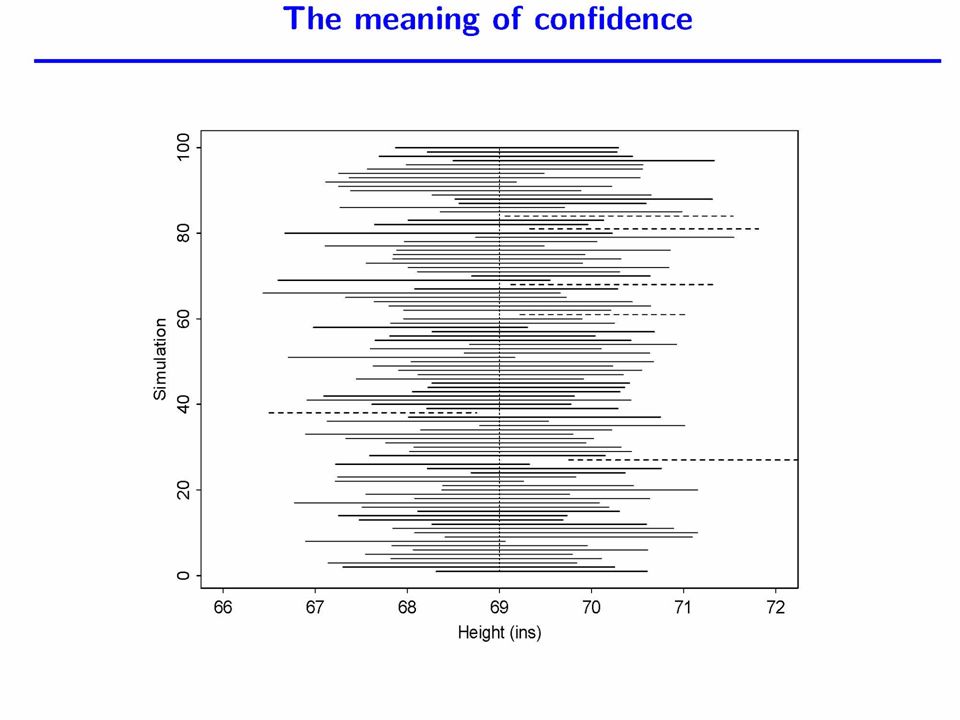
Confidence intervals- an alternative to hypothesis testing A confidence interval is a range of credible values for the population parameter. The confidence coefficient is the percentage of times that the method will in the long run capture the true population parameter. A common form is sample estimator 2* estimated standard error

40
another formal inferential procedure- hypothesis testing

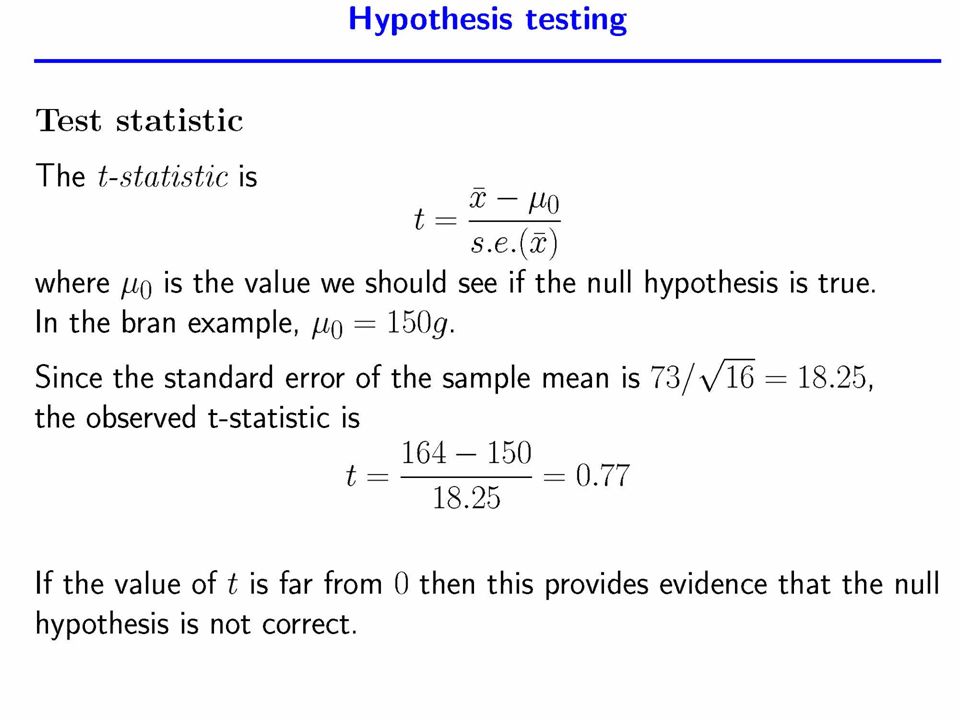
41
Hypothesis Testing Null hypothesis: usually no effect Alternative hypothesis: effect Make a decision based on the evidence (the data) There is a risk of getting it wrong! Two types of error:- –reject null when we shouldnt - Type I –dont reject null when we should - Type II

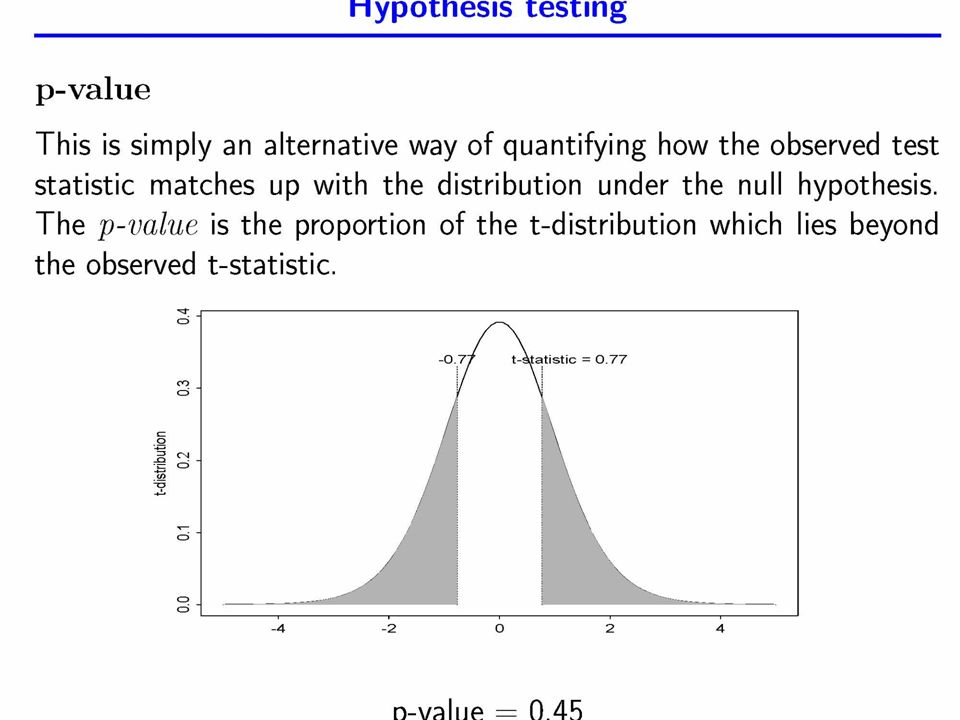
42
Significance Levels We cannot reduce probabilities of both Type I and Type II errors to zero. So we control the probability of a Type I error. This is referred to as the Significance Level or p-value. Generally p-value of <0.05 is considered a reasonable risk of a Type I error. (beyond reasonable doubt)
.")
43
Statistical Significance vs. Practical Importance Statistical significance is concerned with the ability to discriminate between treatments given the background variation. Practical importance relates to the scientific domain and is concerned with scientific discovery and explanation.

44
Power Power is related to Type II error probability of power = 1 - making a Type II error Aim: to keep power as high as possible (also related to sample size calculations)
")
48
relationships- linear or otherwise

49
Correlations and linear relationships pearson correlation Strength of linear relationship Simple indicator lying between –1 and +1 Check your plots for linearity

50
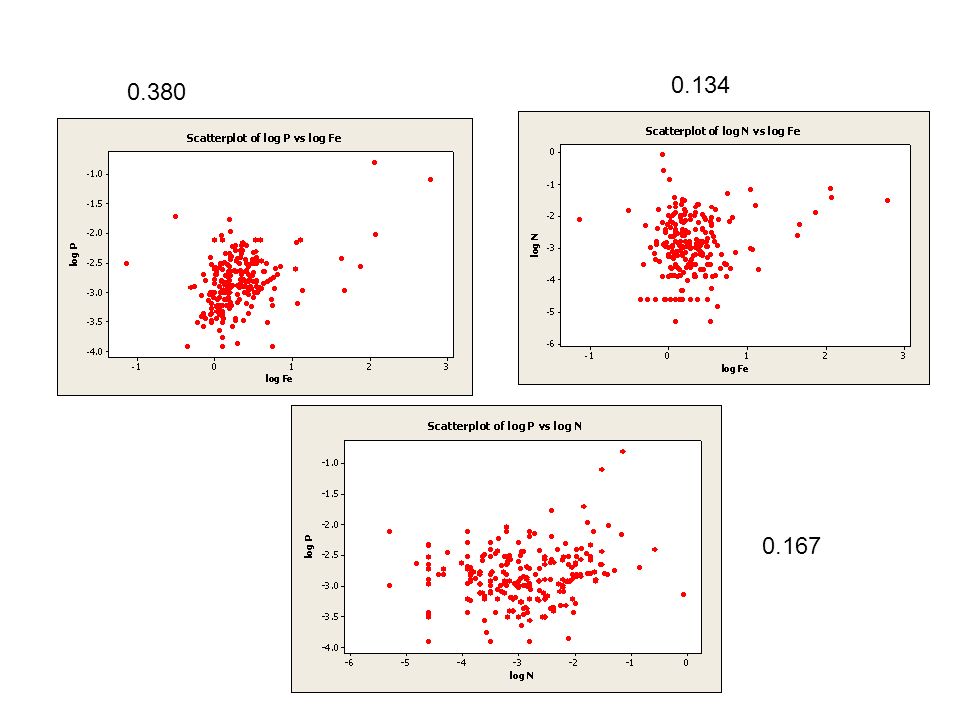
Interpreting correlations The correlation coefficient is used as a measure of the linear relationship between two variables, The correlation coefficient is a measure of the strength of the linear association between two variables. If the relationship is non-linear, the coefficient can still be evaluated and may appear sensible, so beware- plot the data first.

51
0.167 0.134 0.380
52
what is a statistical model?

53
Statistical models Outcomes or Responses these are the results of the practical work and are sometimes referred to as dependent variables. Causes or Explanations these are the conditions or environment within which the outcomes or responses have been observed and are sometimes referred to asindependent variables, but more commonly known as covariates.

54
Specifying a statistical models Models specify the way in which outcomes and causes link together, eg. Chl-a ~ Temperature there should be an additional item on the right hand side giving a formula:- Chl-a ~ Temperature + Error This says that Chl-a depends on temperature, but that there is also some random variability (error)
.")
55
Example 1: are atmospheric SO 2 concentrations declining? Measurements made at a monitoring station over a 20 year period Complex statistical model developed to describe the pattern, the model portions the variation to trend, seasonality, residual variation

58
summary hypothesis tests and confidence intervals are used to make inferences we build statistical models to explore relationships and explain variation a general linear modelling framework is very flexible assumptions should be checked.

59
Statistics might be needed where? designing and evaluation monitoring and sampling networks; sampling strategies the analysis of observational records, (e.g. past climate indicators, water quality, pollutant trends); trends, spatio-temporal modelling, dealing with variation the study and modelling of extreme events (e.g. sea levels, flood prediction) for prediction and management of future occurrences; extremes, risk modelling, uncertainty evaluating the state of the environment;trends, uncertainty, prediction
; trends, spatio-temporal modelling, dealing with variation the study and modelling of extreme events (e.g. sea levels, flood prediction) for prediction and management of future occurrences; extremes, risk modelling, uncertainty evaluating the state of the environment;trends, uncertainty, prediction.")
60
Statistics might be needed where? the use of complex computer models to simulate the whole earth system (e.g. climate change and the carbon cycle); uncertainty, model evaluation the analysis of observational records, (e.g. past climate indicators, water quality, pollutant trends); trends, spatio-temporal modelling, dealing with variation the study and modelling of extreme events (e.g. sea levels, flood prediction) for prediction and management of future occurrences; extremes the evaluation and quantification of risk and uncertainty (e.g. volcanic or earthquake prediction);uncertainty, prediction
; uncertainty, model evaluation the analysis of observational records, (e.g. past climate indicators, water quality, pollutant trends); trends, spatio-temporal modelling, dealing with variation the study and modelling of extreme events (e.g. sea levels, flood prediction) for prediction and management of future occurrences; extremes the evaluation and quantification of risk and uncertainty (e.g. volcanic or earthquake prediction);uncertainty, prediction.")
61
Statistics and the environment Appropriate statistical models can give –added value to your data, –better descriptions of complex change behaviour and –begin to tease out climate change driven effects in environmental quality –handle natural variation. Greater, innovative statistical analysis needed for environmental science

62
Statistics and the environment As environmental scientists, we need to try and ensure that: data are gathered under good statistical principles and that they are not left in the filing cabinet. We need to ensure that Good environmental science is served by good statistical science. Environmental science should be Data and information rich

63
Statistics training we have chosen a few key statistical topics to cover- there are many others We will also have some practical examples for you to work through with guidance the main software tool will be R, which is freely available- this is very similar but not identical to S+ there should be lots of opportunities to ask questions

Similar presentations


>")


