Download presentation
Presentation is loading. Please wait.

1
Investment Risk Eric Higgins Department of Finance, KSU

2
Investing – Definition of an investment: The current commitment of dollars for a period of time in order to get future payments Put in money today to get more in the future

3
Investing Risk -- Risk is the possibility that you won’t get back what you expect – The problem with ignoring risk: Things sound too good Don’t consider the downside

4
Investment What are some investment options? – Bank Account – Bonds – Stocks – Real Estate – Art – Private Investment

5
How Risky are Investments Rank the following investments in terms of risk … – An FDIC insured bank account – An investment in the debt of Microsoft – A 10-year government bond – A friend wants you to invest in his idea to open a new barbershop – A share of IBM stock – Buying a house

6
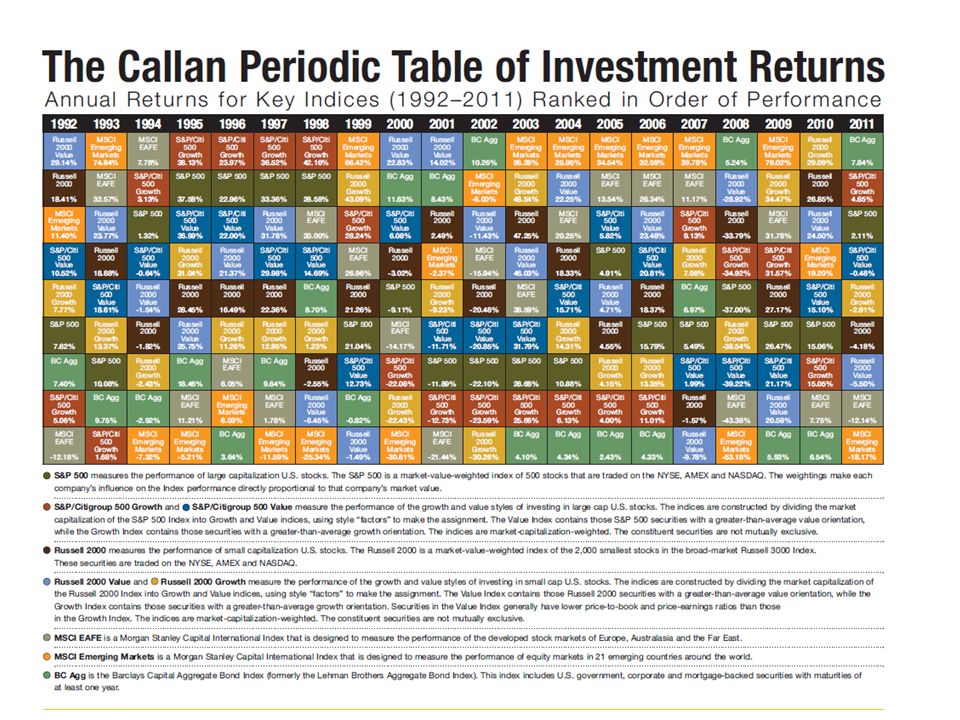
How Risky are Investments Risk ranking… – An FDIC insured bank account – A 10-year government bond – An investment in the debt of Microsoft – Buying a house – A share of IBM stock – A friend wants you to invest in his idea to open a new barbershop http://www.finrafoundation.org/resources/educa tion/modules/ http://www.finrafoundation.org/resources/educa tion/modules/ http://www.callan.com/research/periodic/

8
Investing Lesson: – Higher risk, higher return – Put money in a bank savings account, get 2% return guaranteed – Put money in the stock market, get 11% with the chance that you may lose money

9
Compound Interest The principle of compounding means that you earn interest on interest Three things to consider – Invest early – Invest often – Have patience

10
Risk How risky are you? You have the following choice for your salary in the first year that you graduate: – $50,000 for certain – A coin-flip where you get either $100,000 or $0

11
Probability What is more likely? – Two people in this room have the same birthday – Somebody in this room has a birthday on October 31 Two people having the same birthday is actually much more likely You have to understand the role of probability in making investment decisions – Relates to risk

12
Expected Returns Expected returns are based on the probabilities of possible outcomes In this context, “expected” means average if the process is repeated many times The “expected” return does not even have to be a possible return

13
Required Returns and Risk Suppose we have two assets, A and B, that are both expected to return 15% and have a price of $100. (thus, both stocks will return $15) Suppose that stock A is riskier than stock B. What would happen? What if the price of A fell to $75 and B rose to $150?
 Suppose that stock A is riskier than stock B. What would happen. What if the price of A fell to $75 and B rose to $150 .")
14
Required vs. Expected Returns Expected returns are what an investment will earn Required returns are what an investment should earn The two may differ, creating investment opportunities

15
Example: Expected Returns Suppose you have predicted the following returns for stocks C and T in three possible states of nature. What are the expected returns? – StateProbabilityCT – Boom0.30.150.25 – Normal0.50.100.20 – Recession???0.020.01 R C =.3(.15) +.5(.10) +.2(.02) =.099 = 9.99% R T =.3(.25) +.5(.20) +.2(.01) =.177 = 17.7%
 +.5(.10) +.2(.02) =.099 = 9.99% R T =.3(.25) +.5(.20) +.2(.01) =.177 = 17.7%.")
16
Variance and Standard Deviation Variance and standard deviation still measure the volatility of returns Using unequal probabilities for the entire range of possibilities Weighted average of squared deviations

17
Example: Variance and Standard Deviation Consider the previous example. What are the variance and standard deviation for each stock? Stock C – 2 =.3(.15-.099) 2 +.5(.1-.099) 2 +.2(.02-.099) 2 =.002029 – =.045 Stock T – 2 =.3(.25-.177) 2 +.5(.2-.177) 2 +.2(.01-.177) 2 =.007441 – =.0863
 2 +.5( ) 2 +.2( ) 2 = – =.045 Stock T – 2 =.3( ) 2 +.5( ) 2 +.2( ) 2 = – =")
18
Another Example Consider the following information: – StateProbabilityABC, Inc. – Boom.25.15 – Normal.50.08 – Slowdown.15.04 – Recession.10-.03 What is the expected return? What is the variance? What is the standard deviation?

19
Portfolios A portfolio is a collection of assets An asset’s risk and return is important in how it affects the risk and return of the portfolio The risk-return trade-off for a portfolio is measured by the portfolio expected return and standard deviation, just as with individual assets

20
Example: Portfolio Weights Suppose you have $15,000 to invest and you have purchased securities in the following amounts. What are your portfolio weights in each security? – $2000 of DCLK – $3000 of KO – $4000 of INTC – $6000 of KEI DCLK: 2/15 =.133 KO: 3/15 =.2 INTC: 4/15 =.267 KEI: 6/15 =.4

21
Portfolio Expected Returns The expected return of a portfolio is the weighted average of the expected returns for each asset in the portfolio You can also find the expected return by finding the portfolio return in each possible state and computing the expected value as we did with individual securities

22
Example: Expected Portfolio Returns Consider the portfolio weights computed previously. If the individual stocks have the following expected returns, what is the expected return for the portfolio? – DCLK: 19.65% – KO: 8.96% – INTC: 9.67% – KEI: 8.13% E(R P ) =.133(19.65) +.2(8.96) +.167(9.67) +.4(8.13) = 9.27%
 =.133(19.65) +.2(8.96) +.167(9.67) +.4(8.13) = 9.27%.")
23
Perfect Negative Correlation 25 15 0 -10 0 0 15 25 Stock WStock MPortfolio WM...............

24
Perfect Positive Correlation Stock M 0 15 25 -10 Stock M’ 0 15 25 -10 Portfolio MM’ 0 15 25 -10

25
The Principle of Diversification Diversification can substantially reduce the variability of returns without an equivalent reduction in expected returns This reduction in risk arises because worse than expected returns from one asset are offset by better than expected returns from another However, there is a minimum level of risk that cannot be diversified away and that is the systematic portion

26
Figure 13.1

27
Savings Game Start with $1,000 – You need to pick a risk category – High risk earns 2X the market return, Medium risk earns the market return, Low risk earns ½ the market return. – Market returns will be determined randomly. – Each “round” represents 5 years. We will play four rounds. – You can change your risk category after every round – Goal is to end up with the most money at the end of the game.

28
Savings Game In addition to ending up with the most money you have to have: – $500 at the end of round 2 to put a down payment on a car – If you don’t meet the goal, you lose $1,000 on your ending total.

29
Round 1 We will randomly choose a card from a deck of cards. – Red means loss, black means gain – Amount of gain/loss equal to the amount on the card, face cards all 10% gain/loss

30
Round 2 If the market went up in Round 1, it is likely that the market will go down in Round 2. If the market went down in Round 1, it is likely that the market will go up in Round 2. I will now remove one suit (red or black) from the deck of cards and we will draw again. Remember – You need $500 at the end of Round 2 – The probability of the market going up/down has changed. It is not random any more.
 from the deck of cards and we will draw again. Remember – You need $500 at the end of Round 2 – The probability of the market going up/down has changed. It is not random any more..")
31
Round 3 Risk aversion…choice of certain vs. uncertain payoff – You can either go up 5% Risk doesn’t matter here. If you choose this you get 5%. – I will flip a coin, heads the market goes up 10% tails the market goes down 5%. Risk matters if you take the gamble. High risk gets 2X market, medium risk gets market, low risk gets ½ market

32
Round 4 Roll the Dice – I will roll two dice… 5, 6, 7, 8, 9 the market goes up 10% 2, 3, 4, 10, 11, 12 the market goes down 5% – Think about the odds, what is most likely to happen? – Choose your risk level carefully this is the last round

33
Rounds 1, 2: Card Draw RedLowMediumHighBlackLowMediumHigh 20.950.900.8221.051.101.22 30.930.860.7331.081.161.34 40.900.820.6641.101.221.47 50.880.770.5951.131.281.61 60.860.730.5361.161.341.76 70.840.700.4771.191.401.93 80.820.660.4281.221.472.10 90.790.620.3791.251.542.29 100.770.590.33101.281.612.49 J0.770.590.33J1.281.612.49 Q0.770.590.33Q1.281.612.49 K0.770.590.33K1.281.612.49 A0.770.590.33A1.281.612.49 Round 3:LowMedHigh Choose 5%:1.28 Heads:1.281.612.49 Tails:.88.77.59 Round 4: LowMediumHigh 5, 6, 7, 8, 91.281.612.49 2, 3, 4, 10, 11, 120.880.770.59

34
External Resources http://www.financialliteracyfocus.org/edu.html http://www.mymoney.gov/myresources.html http://www.jumpstart.org/jump$tart- clearinghouse.html http://www.jumpstart.org/jump$tart- clearinghouse.html http://www.weseed.com/ http://www.smartmoney.com/?link=SM_logo_home

Similar presentations

 Chapter.>")


